Plotting ROC curve in R Programming (original) (raw)
Last Updated : 23 Jul, 2025
In binary classification problems, it's important to evaluate how well a model performs. One popular and useful method is using the ROC (Receiver Operating Characteristic) curve. This curve helps us visualize the trade-off between the model’s ability to correctly identify positive cases and the chance of incorrectly identifying negatives as positives.
What is an ROC Curve?
An ROC curve is a graph that shows the performance of a binary classifier as its decision threshold is changed. It plots:
- **True Positive Rate (TPR): Also called **sensitivity or **recall, it shows how many actual positives were correctly predicted.
- **False Positive Rate (FPR): The proportion of actual negatives that were wrongly predicted as positives.
- **Area Under the Curve (AUC): A single number that summarizes how well the model distinguishes between the two classes.
- **Perfect: AUC = 1 means the model makes flawless predictions, correctly distinguishing all positives and negatives.
- **Random: AUC = 0.5 means the model performs no better than random guessing, showing no discriminative ability.
Importance of ROC Curves in Model Evaluation
The ROC curve in R helps in understanding how well the model performs across different thresholds. It provides a visual understanding of the trade-off between true positives and false positives. The ROC curve is particularly helpful when:
- Imbalanced dataset where one class dominates over the other.
- Compare the performance of multiple classification models.
- Interested in how the classifier performs over a range of thresholds.
To work with ROC curves in R, we can use two packages:
R `
install.packages("pROC") install.packages("ROCR")
`
1. Plotting ROC Curve Using pROC
The pROC package makes it simple to compute and visualize ROC curves. Let's start with a basic example using a simulated dataset.
- **set.seed(123): Ensures reproducibility by fixing the random number generation.
- **sample(): Creates a vector of binary outcomes (0 and 1) to simulate actual labels.
- **runif(): Generates 100 random probabilities between 0 and 1 to simulate predicted scores.
- **library(pROC): Loads the pROC package into the R session.
- **roc(): Calculates the ROC curve using actual outcomes and predicted probabilities.
- **plot(): Draws the ROC curve with optional AUC display.
- **abline(): Adds a diagonal line representing random classification (FPR = TPR). R `
set.seed(123)
actual <- sample(c(0, 1), 100, replace = TRUE)
predicted_probs <- runif(100)
library(pROC)
roc_curve <- roc(actual, predicted_probs)
plot(roc_curve, col = "blue", main = "ROC Curve", print.auc = TRUE)
abline(a = 0, b = 1, lty = 2, col = "red")
`
**Output:
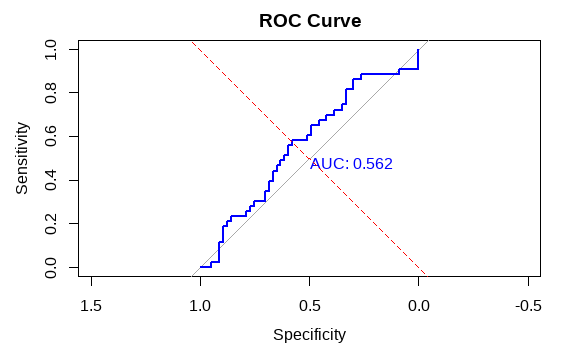
Plotting ROC curve in R Programming
In this graph
- The ROC Curve shows sensitivity vs. specificity, with axes reversed as commonly used in some R visualizations.
- The blue line represents the classifier's performance, while the gray and red lines show reference baselines.
- The AUC value is 0.562, indicating performance only slightly better than random guessing.
2. Plotting ROC Curve Using ROCR
The ROCR package offers flexibility in terms of plotting and evaluating the ROC curve with more customizable options.
- **library(ROCR): Loads the ROCR package into the environment.
- **prediction(): Creates a prediction object from predicted probabilities and actual class labels.
- **performance(): Calculates performance metrics (e.g., TPR and FPR) needed for the ROC plot.
- **plot(): Plots the ROC curve using the performance object.
- **abline(): Adds a red diagonal line as a reference for random guessing. R `
library(ROCR)
pred <- prediction(predicted_probs, actual)
perf <- performance(pred, "tpr", "fpr")
plot(perf, col = "darkgreen", lwd = 2, main = "ROC Curve with ROCR")
abline(a = 0, b = 1, col = "red", lty = 2)
`
**Output:
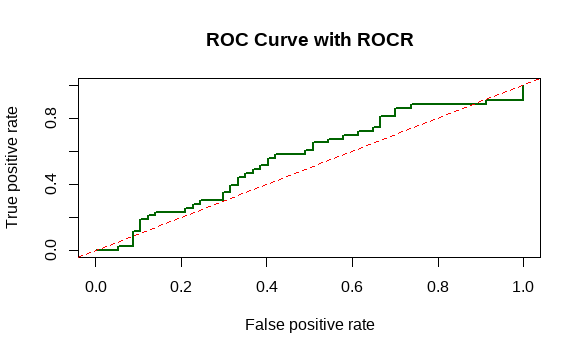
Plotting ROC curve in R Programming
In this graph
- ROC Curve shows the trade-off between true positive rate and false positive rate.
- The green line represents the model performance, red line indicates random guessing.
- Curve above the red line means better classification ability of the model.