Impaired germinal center reaction in mice with short telomeres (original) (raw)
Abstract
Reduction of germinal center reactivity is a landmark of immunosenescence and contributes to immunological dysfunction in the elderly. Germinal centers (GC) are characterized by extensive clonal expansion and selection of B lymphocytes to generate the pool of memory B cells. Telomere maintenance by telomerase has been proposed to allow the extensive proliferation undergone by B lymphocytes in the GC during the immune response. We show here that late generation mTR–/– mice, which lack the mouse telomerase RNA (mTR) and have short telomeres, present a dramatic reduction in GC number following antigen immunization. Upon immunization with an antigen, wild-type splenocyte telomeres are elongated and this is accompanied by a high expression of the telomerase catalytic subunit in the spleen GC. In contrast, telomerase-deficient mTR–/– splenocytes show telomere shortening after immunization, presumably due to cell proliferation in the absence of telomerase. All together, these results demonstrate the importance of telomere maintenance for antibody-mediated immune responses and support the notion that telomere elongation detected in wild-type spleens following immunization is mediated by telomerase.
Keywords: aging/germinal centers/immunosenescence/telomerase/telomeres
Introduction
Mammals are protected from antigenic and pathogenic stresses by an effective immune system response. The antibody-mediated immune response is achieved by a process that occurs primarily in the germinal centers (GC) where naive B lymphocytes undergo somatic hypermutation and clonal expansion followed by the selection of cells expressing receptors with the highest affinity for the antigen (reviewed in Kelsoe, 1996; Sprent, 1997). The generation of long-lived immune memory assures a more effective response and a faster neutralization of the pathogen after a secondary challenge. During aging, however, there is a marked decline in the reactivity of the immune system, which has been attributed in part to impairment of lymphocyte function coincident with a decrease in the GC reaction (reviewed in Zheng et al., 1997). The decline in immune system reactivity could be partly due to the exhaustion of the proliferative potential of naive B cells as a consequence of telomere shortening with increasing age (Effros and Pawelec, 1997; Hodes, 1999). Telomerase is activated when B cells enter the GC and is subsequently down-regulated when B cells differentiate to memory B cells (Hiyama et al., 1995; Norrback et al., 1996; Hu et al., 1997; Weng et al., 1997; Liu et al., 1999). In accordance with this, telomeres are longer in GC B cells than in naive B cells or in memory B cells (Weng et al., 1997).
Telomeres have an essential role in stabilizing chromosome ends and in preventing end-to-end fusions (Counter et al., 1992; Blasco et al., 1997; Lee et al., 1998; Nakamura et al., 1998; Niida et al., 1998; Hande et al., 1999). Mammalian telomeres consist of repeats of the sequence TTAGGG (reviewed in Blackburn, 1991; Greider, 1996). Telomerase is a reverse transcriptase that elongates telomeres by copying an RNA template that is stably bound to the enzyme (Greider and Blackburn, 1985, 1989; Singer and Gottschling, 1994; Blasco et al., 1995; Feng et al., 1995; McEachern and Blackburn, 1995; Harrington et al., 1997; Kilian et al., 1997; Lingner et al., 1997; Meyerson et al., 1997; Nakamura et al., 1997; Greenberg et al., 1998; Martín-Rivera et al., 1998; Nugent and Lundblad, 1998), and has a fundamental role in maintaining telomeres (Singer and Gottschling, 1994; Blasco et al., 1997). Human telomeric sequences are lost with increasing age in some adult tissues. In particular, telomere length in fibroblasts and peripheral blood mononuclear cells declines proportionally to donor age at a rate of 50–200 bp per year (Harley et al., 1990; Vaziri et al., 1993; Frenck et al., 1998). In somatic telomerase-negative cells, telomere loss is thought to occur due to incomplete DNA replication (reviewed in Autexier and Greider, 1996). In cells that normally have low levels of telomerase activity, such as B and T cells, telomere loss is proposed to be a consequence of the down-regulation of telomerase activity with age (Hiyama et al., 1995).
The observations mentioned above suggest that telomerase activation is important in determining the proliferative potential of the cells and that telomerase is the main mechanism that counteracts telomere loss. In fact, the introduction of constitutively expressed telomerase catalytic subunit into cells with a limited life-span is sufficient to stabilize their telomeres and, in some cases, to extend their life-span indefinitely without inducing changes associated with neoplastic transformation (Bodnar et al., 1998; Kiyono et al., 1998; Wang et al., 1998; Jiang et al., 1999; Morales et al., 1999). Interestingly, telomerase-independent telomere elongation has been described in some immortal human cell lines that do not have detectable telomerase activity (Bryan et al., 1995, 1997), as well as in cell lines derived from telomerase-deficient mice (Hande et al., 1999). The relevance of these alternative telomere-maintenance mechanisms in physiological processes remains open.
Mice genetically deficient for telomerase activity provide a unique opportunity to understand the role of telomere maintenance in organism viability (Blasco et al., 1997; Lee et al., 1998; Herrera et al., 1999a,b; Rudolph et al., 1999). mTR–/– mice, which lack the mouse telomerase RNA (mTR), are viable for only four to six generations depending on the specific genetic background; however, as telomeres shorten and chromosome fusions accumulate with increasing generations, these mice show defects in the germ line, the gut and the hematopoietic system (Blasco et al., 1997; Lee et al., 1998; Herrera et al., 1999b; Rudolph et al., 1999). Here we show that late generation mTR–/– mice show a decreased immune system reactivity manifested by a defective GC formation after immunization. The observations described here support the concept that telomere shortening with age may contribute to immunosenescence in the elderly.
Results and discussion
Expression of the catalytic subunit of mouse telomerase, mTERT, in the spleen
The lymphoid area of the spleen, or white pulp, consists of three distinct parts: the marginal zone, the periarteriolar lymphoid sheath (PALS) and the follicle. The marginal zone is formed by specialized macrophages and the IgM/IgD B cell subset, the PALS contains T cells and interdigitating dendritic cells, and the follicles are constituted of naive B cells and the follicular dendritic cells. After antigenic stimulation, naive B cells undergo extensive proliferation in the follicles forming the GC and generating memory B cells (reviewed in Kelsoe, 1996). Spleen follicles are easily visualized by morphological criteria and by immunohistochemistry with naive B cell marker B220 (see Figure 2A for examples); GC are identified by staining with peanut agglutinin (PNA) (see Figure 3A for example). It has been reported that human telomerase activity is regulated during B cell development. More specifically, telomerase activity is present in both naive and memory B cells, but is significantly up-regulated in the GC (Hiyama et al., 1995; Norrback et al., 1996; Hu et al., 1997; Weng et al., 1997). Concurring with this, recent studies showed that both components of human telomerase, the human telomerase RNA (hTR), as well as the transcript for the catalytic component of telomerase (hTERT), are present in the GC B cells (Yashima et al., 1998; Lui et al., 1999).

Fig. 2. Reduced numbers of spleen follicles in late generation mTR–/– mice. (A and B) Representative images of spleen sections from age-matched non-immunized wild-type and G6 mTR–/– mice. All images are shown at the same magnification (20× objective); the fact that the follicles in (B) are smaller is coincidental, as follicles do not have an invariable size and in a given section there are larger and smaller follicles. Sections were stained with naive B cell-specific antibody B220 (blue) and with GC marker PNA (brown). The figures show mostly spleen follicles and not GC, as there was no immunization. Non-immunized mice show a weak, spatially restricted area of PNA-positive cells (brown) inside the follicle, which is unambiguously identified by B220 staining (blue). The images shown are not the full spleen section and are shown for illustrative purposes. For quantification of follicle numbers see (C). (C) The average number of follicles visualized per spleen section from several wild-type and G6 mTR–/– mice is shown with bars. The total number of spleen sections from each mouse used to calculate follicle number per section is indicated at the bottom of the graph. In all cases, half of the spleen was used to estimate the number of follicles. All spleens had a similar size, therefore similar volumes of the spleen were scanned for follicles. The follicles were counted along the full longitudinal sections of the spleen, and an average of 20–30 follicles per section in the wild-type and 10–15 follicles per section in the G6 mTR–/– (KO-G6) mice were counted. Standard deviation bars are shown. (D) Relative activation with respect to wild-type mice of splenocytes from G6 mTR–/– mice following mitogen stimulation (see Materials and methods for details). α–CD3 and Con–A, T cell-specific mitogens; LPS, B cell-specific mitogen; Ion-PMA, B + T cell mitogens. Total numbers of mice used for each experiment are indicated below the graph. Standard deviation bars are also shown. See Materials and methods for detailed description of the experiment.

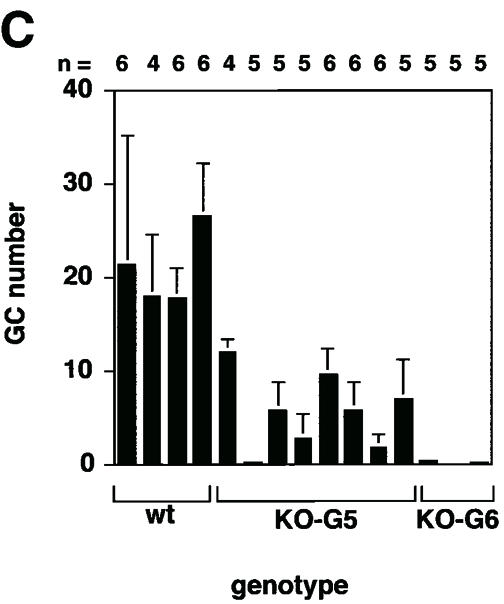


Fig. 3. Reduced numbers of GC in late generation mTR–/– mice after immunization with KLH. (A) Representative images of spleen sections from non-immunized and immunized wild-type mice (14 days after the second immunization with KLH). Sections were stained with naive B cell marker B220 (blue) and with GC marker PNA (brown). All parts of this figure are the same magnification (20× objective). Non-immunized mice show a weak and spatially restricted area of PNA-positive cells (brown) inside the follicle. In contrast, immunized mice mostly present GC, which are characterized by a strong and wide area of PNA-positive cells [compare the two panels in (A)]. (B) Representative images of spleen sections from non-immunized and immunized G6 mTR–/– mice (14 days after the second immunization with KLH). Sections were stained with naive B cell marker B220 (blue) and with GC marker PNA (brown). All parts of this figure are at the same magnification (20× objective). Non-immunized mice show a weak and spatially restricted area of PNA-positive cells (brown) inside the follicle. In contrast, immunized mice mostly present GC, which are characterized by a strong, wide area of PNA-positive cells [compare the two panels in (B)]. (C) The average number of GC visualized per spleen section from wild-type, G5 and G6 mTR–/– mice is shown with bars. The total number of spleen sections used for the analysis is indicated at the bottom of the graph. GC were counted as described for follicles in legend to Figure 2. Standard deviation bars are shown. (D) Analysis of the in vivo immune response to KLH in wild-type and G6 mTR–/– mice. Sera were collected 14 days after the primary immunization and the IgM and IgG anti-KLH titers were calculated by serially diluting the serum samples. The three dilutions used for each serum are represented. Results are given as the serum dilution giving half-maximal binding to Ag as measured at 492 nm that was 1873 and 1110 for total IgM and 1.6 × 10⁴ and 1.08 × 10⁴ for total IgG in two different wild-type mice, WT1 and WT2, respectively (▪ and ♦); 301 and 249 for total IgM and 1.0 × 10⁴ and 1.0 × 10⁴ for total IgG in two different G6 mTR–/– mice, KO1-G6 and KO2-G6, respectively (○ and ▵). (E) Representative images of wild-type and G1 mTR–/– spleens 14 days after second immunization with KLH (immunized). Sections were stained with B cell-specific antibody B220 (blue) and with GC marker PNA (brown). Both images are at the same magnification (20× objective). (F) The average number of GC visualized in spleen sections from wild-type and G1 mTR–/– mice is shown with bars. The total number of spleen sections used for the analysis is indicated at the bottom of the graph. Standard deviation bars are shown.
To determine whether telomerase was up-regulated in the spleen during the GC reaction triggered by an antigen, we analyzed telomerase expression in spleens from non–immunized and keyhole limpet hemocyanin (KLH)-immunized mice using the K-370 antibody, which specifically recognizes the mTERT protein subunit of telomerase (Martín-Rivera et al., 1998) (see Materials and methods). The images in Figure 1 correspond to individual follicles or GC, which were identified by staining with markers B220 and PNA (see above; not shown). As a control for antibody specificity, Figure 1A shows a spleen section containing a GC that was preincubated with the peptide used to derive the anti-telomerase K-370 antibody prior to staining with K-370 anti-telomerase antibody. As expected, no mTERT signal (brown color) was detected. The spleen sections in Figure 1B and C were directly stained with anti-telomerase antibody K-370. Figure 1B shows an individual follicle from a non-immunized spleen showing an mTERT-specific pattern in the follicle, in agreement with the fact that naive B cells are telomerase-positive (Hiyama et al., 1995; Norrback et al., 1996; Hu et al., 1997; Weng et al., 1997). The mTERT-specific signal was increased in a spleen GC from an immunized mouse (compare Figure 1B with C). These results suggest that mTERT is up-regulated in the spleen GC that are formed following immunization. The spleens of mTR–/– mice also showed mTERT expression, confirming previous data reporting normal mTERT protein expression in telomerase-deficient mTR–/– spleens (Martín–Rivera et al., 1998). All together, these data show that the catalytic protein component of telomerase, TERT, is present in the spleen follicles of non-immunized mice and that it is up-regulated in the GC formed after immunization. This further reinforces the notion that telomerase may have an important role in maintaining the elevated proliferation that B cells undergo in the GC following immunization.

Fig. 1. mTERT is expressed in the spleen follicles and GC. Representative images of spleen follicles/GC stained with K-370 anti-telomerase antibody (brown). All spleen sections were processed in parallel. (A) A spleen follicle from a non-immunized mouse pre-incubated with the peptide that was used to derive the K-370 antibody prior to K-370 incubation shows no specific staining. (B) Typical staining with K-370 antibody of a spleen follicle from a non-immunized wild-type mouse. (C) Strong K-370 staining of a spleen GC 14 days after second immunization with KLH. All images shown in this figure are at the same magnification (40× objective). We confirmed that follicles and GC were correctly identified by subsequent staining of the sections with markers B220 and PNA (the panels in this figure do not show these additional stains for purposes of clarity, but see for example Figure 3E).
Reduced GC formation in G5 and G6 mTR–/– mice
Several mutations that affect follicle structure or B cell activation are reported to result in defects in GC formation (reviewed in Kosco-Vilbois et al., 1997). Mice deficient for telomerase activity offer a unique opportunity to study the role of telomerase and telomeres in the formation of GC in response to antigens (Hodes, 1999). Here we describe GC formation in wild-type and late generation mTR–/– after immunization with KLH.
In the absence of immunization, spleens from wild-type and G6 mTR–/– mice show characteristic follicle staining with the naive B cell marker B220 (Figure 2A and B, blue staining; these figures are for illustrative purposes, they do not reflect the follicle numbers) and a weak staining with GC marker PNA (brown color). Interestingly, the spleens from mTR–/– mice of the sixth generation (G6) showed fewer follicles than those from wild-type mice (Figure 2C); indeed, the number of follicles was reduced to ∼50% compared with age-matched wild-type spleens (Figure 2C). The reduction in the number of follicles in G6 mTR–/– spleens coincides with a decrease in the proliferative response of G6 mTR–/– splenocytes to B and, to a lesser degree, to T cell mitogens (Figure 2D) (see Materials and methods for details). Since naive B cells are generated in the bone marrow, the lower follicle number in the G5 mTR–/– spleens may reflect reduced bone marrow function in the late generation mTR–/– mice.
To investigate a possible immune defect in vivo, 15 age-matched wild-type, G5 mTR–/– and G6 mTR–/– mice were immunized with 50 μg of KLH antigen (see Materials and methods). Non-immunized and immunized mice were killed 13–14 days after the second KLH boost and the number of GC in the spleens were counted. To identify GC, frozen spleen sections were immunostained with the B cell marker B220 (blue) and the GC marker PNA (brown). Wild-type spleens showed typical GC number and structure after immunization (Figure 3A and C). Specifically, an enlargement of the PNA+ compartment (brown) is typically detected in wild-type immunized spleens compared with control non-immunized spleens (Figure 3A, compare non-immunized with immunized, images are at the same magnification). In contrast, G5 and G6 mTR–/– spleens showed a dramatic reduction in GC number compared with their wild-type counterparts (Figure 3C). Interestingly, a few GC were still detectable in immunized G5 and G6 mTR–/– spleens (Figure 3B, see immunized spleen section; Figure 3C). This dramatic decrease in the number of GC formed in the late generation mTR–/– mice is in agreement with a defect in the immune response triggered by KLH, as shown by the diminished KLH-specific IgM and IgG antibodies detected in the sera of immunized G6 mTR–/– mice compared with that of immunized wild-type controls (Figure 3D).
In contrast to the behavior of G5 and G6 mTR–/– mice, when G1 mTR–/– mice were KLH-immunized, the GC numbers detected in spleen were similar to those of wild-type controls (wild-type: 19.1 GC/spleen section; G1 mTR–/–: 24 GC/spleen section) (see Figure 3E for images of wild-type and G1 mTR–/– immunized spleens and Figure 3F for quantification of GC numbers). This observation concurs with the fact that although G1 mTR–/– mice lack telomerase activity they still have long telomeres and show none of the phenotypes associated with telomere shortening (Blasco et al., 1997; Lee et al., 1998; Rudolph et al., 1999).
The above observations suggest that late generation but not early generation mTR–/– mice have a GC formation defect coincidental with the telomere shortening described in increasing generations of mTR–/– mice (Blasco et al., 1997; Lee et al., 1998; see below). This GC formation defect in late generation mTR–/– mice probably results from diminished splenocyte proliferation as shown by the impaired in vitro activation of B and T cells from late generation mTR–/– mice.
Impaired proliferative capacity of G6 mTR–/– splenocytes
To characterize defective GC formation in response to antigen immunization in late generation mTR–/– mice, we studied the ability of wild-type and G6 mTR–/– splenocytes to proliferate in response to mitogens before and after antigen immunization of the mice. Splenocytes from immunized wild-type mice showed increased proliferation in response to mitogen stimuli (∼5- to 7-fold increase, except 30-fold for concanavalin A, Con-A; Figure 4) compared with similarly stimulated splenocytes from non-immunized mice (the activation of non-immunized wild-type splenocytes by different mitogens is normalized to 100 in Figure 4). Splenocytes from immunized G6 mTR–/– mice showed a very poor proliferative response to mitogens compared with that of splenocytes from immunized wild-type mice (Figure 4; compare wild-type and G6 mTR–/– groups of mice). Despite the difference in the absolute proliferation levels between wild-type and mTR–/– mice, when mitogen stimulation of splenocytes from immunized G6 mTR–/– mice was compared with that of G6 mTR–/– non-immunized controls, a 5–fold increase in relative activation was observed for most mitogens [Con-A, lipopolysaccharide (LPS), ionomycin plus phorbol 12-myristate 13-acetate (Ion-PMA)] Taken together, these data show that splenocytes from immunized late generation mTR–/– mice have an impaired proliferative response to both B and T cell-specific mitogens compared with splenocytes from immunized wild-type mice and that this defect is probably the consequence of the initial proliferative defect shown by the non-immunized G6 mTR–/– splenocytes (Figures 4 and 2D).

Fig. 4. Mitogen-induced proliferation in splenocytes from non-immunized and KLH-immunized wild-type and G6 mTR–/– mice. Activation following mitogen stimulation of splenocytes from immunized wild-type and G6 mTR–/– mice with respect to that of non-immunized mice (see Materials and methods). For simplicity, activation of non-immunized wild-type splenocytes is considered to be 100% for all mitogens used, and the remainder of the values are expressed as a percentage relative to wild-type activation. α–CD3 and Con–A, T cell-specific mitogens; LPS, B cell-specific mitogen; Ion-PMA, B + T cell mitogens. Non-immunized and 14 days after second immunization with KLH. Total numbers of mice used in each experiment are indicated above the graph. Standard deviation bars are also shown.
Cell cycle distribution and apoptosis in G6 mTR–/– splenocytes from immunized mice
An additional cause of the impaired GC formation in the G5 and G6 mTR–/– spleens is that immunization-induced cell proliferation may trigger apoptosis in cells that have short telomeres. To test this possibility, splenocytes from control wild-type and from G6 mTR–/– mice were stimulated with LPS (a B cell-specific mitogen), and the cell cycle profile and apoptosis were determined by conventional cytometry after mitogen treatment (see Materials and methods). Splenocytes from G5 (KO-G5) and G6 mTR–/– mice (KO-G6) showed a slight increase in apoptosis after mitogen treatment compared with control wild-type splenocytes (19.9% in wild-type, 24.7% in G6 mTR–/– mice; Figure 5), and the cell cycle profile was similar to that of the control wild-type mice (Figure 5). This result suggests that increased apoptosis is unlikely to be the cause of diminished GC formation in the spleens from late generation immunized mTR–/– mice.

Fig. 5. Apoptosis following mitogen stimulation in splenocytes and thymocytes from wild-type, G5 and G6 mTR–/– mice. Cell cycle distribution of total splenocytes after LPS treatment. LPS, B cell-specific mitogen. White, apoptosis; light grey, cells in G1; dark grey, cells in S–phase; black, cells in G2. The total number of mice used for the analysis is indicated at the bottom of the graph. Standard deviation bars are shown.
Telomere length analysis of wild-type and mTR–/– splenocytes before and after immunization
Previous studies showed that telomere restriction fragments are longer in GC B cells than in naive or memory B cells (Weng et al., 1997), in agreement with the high telomerase activity levels described in GC B cells (Weng et al., 1997). It has been suggested that telomerase elongates telomeres during GC formation, allowing the clonal expansion that occurs in the GC to form the memory B cell pool. To address this hypothesis in vivo, we measured telomere length in proliferating (mitogen stimulated) wild-type, G1 and G5 mTR–/– splenocytes from control non-immunized or from KLH-immunized mice. Telomere length was determined using quantitative FISH (Q-FISH) on metaphases (see Materials and methods). In proliferating wild-type splenocytes, average telomere length (measured as telomere fluorescence; 1 telomere fluorescence unit equals 1 kb of TTAGGG repeats in a plasmid) was ∼5 kb longer in immunized mice than in non-immunized controls (Table I; compare Figure 6A and B), suggesting telomere elongation in splenocytes following immunization. This increase in average telomere length coincides with an increase in the frequency of long telomeres in the splenocytes from immunized wild-type compared with that of splenocytes from non-immunized controls (Figure 6E). To investigate if this telomere elongation is a consequence of the telomerase up-regulation described in wild-type GC, we compared telomere length in splenocytes from non-immunized and KLH-immunized G1 mTR–/– mice. G1 mTR–/– mice lack telomerase activity but have telomeres similar in length (Table I) to those of wild-type mice, and therefore, do not show any phenotypes associated with telomere shortening (Blasco et al., 1997; Lee et al., 1998; Rudolph et al., 1999). Q-FISH analysis indicated that splenocytes from immunized telomerase-deficient G1 mTR–/– mice show an average telomere shortening of 7 kb when compared with splenocytes from non-immunized G1 mTR–/– mice (Table I; Figure 6F). This telomere shortening is in agreement with B cell proliferation having occurred in the absence of telomerase activity in the immunized mTR–/– mice. These results strongly suggest that the telomere elongation detected in wild-type spleens following in vivo immunization is mediated by telomerase activity.
Table I. Telomere length analysis of splenocytes from wild-type (Wt), G1 and G5 mTR–/– mice before (N) and after (I) immunization with KLH.
| | p-arm (kb) | q-arm (kb) | p + q average (kb) | Metaphases analyzed | Telomeres without detectable TTAGGG repeats (%) | | | ------------- | ------------- | ------------------ | ------------------- | ----------------------------------------------- | ---- | | Wt-1 (N) | 33.9 ± 11.7 | 47.6 ± 17.0 | 40.8 ± 14.3 | 14 | 0 | | Wt-2 (N) | 31.9 ± 10.5 | 43.6 ± 15.1 | 37.7 ± 12.8 | 16 | 0 | | Wt-3 (N) | 40.2 ± 10.9 | 44.9 ± 21.5 | 42.6 ± 16.2 | 10 | 0 | | Wt-4 (N) | 34.4 ± 15.2 | 47.9 ± 18.5 | 41.2 ± 16.8 | 10 | 0 | | Wt-5 (I) | 39.4 ± 21.3 | 53.6 ± 19.9 | 46.5 ± 19.9 | 16 | 0 | | Wt-6 (I) | 41.6 ± 27.2 | 43.1 ± 24.6 | 42.3 ± 26.0 | 14 | 0 | | Wt-7 (I) | 37.9 ± 19.4 | 54.5 ± 26.5 | 46.2 ± 22.4 | 11 | 0 | | KOG1-1 (N) | 38.9 ± 22.8 | 41.6 ± 27.9 | 40.3 ± 25.3 | 10 | 0 | | KOG1-2 (N) | 32.0 ± 16.1 | 43.0 ± 20.9 | 37.5 ± 18.5 | 10 | 0 | | KOG1-3 (I) | 30.3 ± 19.6 | 30.2 ± 20.7 | 30.3 ± 20.1 | 10 | 0.34 | | KOG1-4 (I) | 28.6 ± 18.6 | 36.4 ± 24.3 | 32.5 ± 21.5 | 10 | 0.5 | | KOG5-1 (N) | 21.2 ± 14.2 | 34.7 ± 26.3 | 27.9 ± 20.3 | 13 | 2.3 | | KOG5-2 (N) | 24.8 ± 16.7 | 35.7 ± 20.7 | 30.3 ± 18.7 | 14 | 1.8 | | KOG5-3 (I) | 33.8 ± 13.8 | 51.0 ± 17.3 | 42.3 ± 15.6 | 13 | 0.3 | | KOG5-4 (I) | 35.2 ± 14.6 | 49.9 ± 19.4 | 42.6 ± 17.0 | 15 | 0.8 | | KOG5-5 (I) | 32.9 ± 25.9 | 41.4 ± 24.4 | 37.2 ± 25.1 | 14 | 2.8 |


Fig. 6. Metaphase chromosomes from wild-type and G5 mTR–/– splenocytes from mice prior to and after KLH immunization. (A and B) Metaphases from wild-type splenocytes. (A) Metaphase corresponding to splenocytes from a non-immunized mouse. (B) Metaphase of splenocytes from a KLH-immunized mouse. Quantification of telomere length of these cells is shown in Table I. Images are shown for illustrative purposes only. (C and D) Metaphases from fifth generation mTR–/– splenocytes. (C) Metaphase corresponding to splenocytes from a non-immunized mouse. (D) Metaphase of splenocytes from a KLH-immunized mouse. Quantification of telomere length of these cells is shown in Table I. Images are shown for illustrative purposes only. (E) Distribution of telomere fluorescence intensity values of the average of p- and q-telomeres (black bars) in splenocytes from control wild-type mice (Wt-1, Wt-2, Wt-3) or wild-type mice that have been immunized with KLH (Wt-5, Wt-6 and Wt-7). The frequency of chromosomes with long telomeres increases in the splenocytes from immunized mice. N, non-immunized; I, immunized. (F) The distribution of telomere fluorescence intensity values of the average of p- and q-telomeres (black bars) in splenocyte-derived control G1 mTR–/– mice (KOG1-1 and KOG1-2) or G1 mTR–/– mice that have been immunized with KLH (KOG1-3 and KOG1-4). The frequency of chromosomes with short telomeres increases in the splenocytes from immunized mice. N, non-immunized; I, immunized. (G) The distribution of telomere fluorescence intensity values of the average of p- and q-telomeres (black bars) in splenocyte-derived control G5 mTR–/– mice (KOG5-1 and KOG5-2) or G5 mTR–/– mice that have been immunized with KLH (KOG5-3, KOG5-4 and KOG5-5). The frequency of chromosomes with long telomeres increases in the splenocytes from immunized mice. N, non-immunized; I, immunized.
When we measured telomere length in dividing splenocytes from non-immunized late generation G5 mTR–/– mice, they were considerably shorter than those of their wild-type counterparts (Table I; compare Figure 6C and A), concurring with the fact that telomeres shorten with increasing generations in mTR–/– mice (Blasco et al., 1997; Herrera et al., 1999b). Strikingly, in proliferating splenocytes from immunized G5 mTR–/– mice, telomeres were on average 12 kb longer than those of proliferating splenocytes from non-immunized G5 mTR–/– mice (Table I; compare Figure 6C and D). In agreement with this, the increase in telomere length upon immunization was easily visualized by the increase in the frequency of long telomeres in splenocytes from immunized G5 mTR–/– mice when compared with those from non-immunized mice (Figure 6G). These results suggest that cells with long telomeres are selected during the proliferation triggered by immunization of late generation mTR–/– mice since non-immunized G5 mTR–/– showed short telomeres (see above). These cells with long telomeres may derive from: (i) a surviving subpopulation of G5 mTR–/– cells that have preserved long telomeres after five generations in mice without telomerase (which appears unlikely); or, alternatively, (ii) from activation of still-to-be-defined telomerase-independent telomere rescue mechanims in late generation mTR–/– splenocytes. Either way, telomeres appear to be critical in sustaining cell proliferation during the GC reaction. The existence of telomere-rescue mechanisms in late generation mTR–/– mice is supported by previous reports showing that late generation mTR–/– cells in culture can maintain telomeres without telomerase (Hande et al., 1999). Telomerase-independent telomere rescue has also been described in human cell lines that lack telomerase activity and in yeast strains that are deficient for telomerase components (Lundblad and Blackburn, 1993; Bryan et al., 1995, 1997; McEachern and Blackburn, 1996). At this point, we cannot speculate on the nature of these telomere rescue mechanisms, although double crosses of the mTR–/– mice deficient in DNA repair and recombination genes could help advance our understanding of this problem.
In summary, the data presented here indicate that late generation mTR–/– mice, which are telomerase deficient and have short telomeres, show a dramatic reduction in the number of GC formed following in vivo antigen immunization. This reduced GC reactivity of late generation mTR–/– mice may contribute to immunosenescence in these mice (Lee et al., 1998; Herrera et al., 1999b). The results presented here also support the idea that telomere maintenance by telomerase is coincidental with the extensive proliferation undergone by B lymphocytes in the GC during the immune response.
Materials and methods
Mice
The wild-type and the different generations of mTR–/– mice were generated as described (Blasco et al., 1997). The genetic background of both wild-type and mTR–/– mice used here was identical to that described previously as the original mixed background: 60% C57BL6; 37.5% 129Sv; 2.5% SJL (Blasco et al., 1997; Lee et al., 1998; Rudolph et al., 1999).
Immunization
Age-matched (6–7 month old) wild-type (15 mice) and mTR–/– mice from the first (G1), fifth (G5) and sixth (G6) generation (a total of 18 mice) were immunized intraperitoneally with 50 μg of KLH (Pierce, Rockford, IL), boosted after 10 days, and bled 7, 10 and 14 days later. Anti-KLH titers were determined in serially diluted serum samples, using KLH-coated ELISA plates. IgM- and IgG-specific antibodies were detected by means of previously tested peroxidase-labeled rabbit antibodies specific for each antibody (Pharmingen, San Diego, CA) (see legend to Figure 3D).
In vitro B and T cell mitogen stimulation
Wild-type or mTR–/– splenocytes before or after immunization with KLH were prepared by teasing the spleen through a nylon screen. Red cells were lysed by osmotic shock and single-cell suspensions were prepared. In each case, a total of 2.5 × 10⁵ splenocytes were resuspended in RPMI 1640 containing 10% FBS (fetal bovine serum) and 0.55 μM β-mercaptoethanol, then plated in round-bottom 96-well plates. Mitogens were used at concentrations for optimal stimulation: including anti-CD3 (1.5 μg/ml; Pharmingen, San Diego, CA), Con-A (1.5 μg/ml; Sigma, St Louis, MO), LPS (10 μg/ml; Sigma), ionomycin (1 μM; Sigma), PMA (20 nM; Sigma). Following a 24 h pulse of 3H-labeled thymidine, cells were harvested 48 h after mitogen addition onto glass fiber filter strips (Wallac, Turku, Finland) using an LKB Wallac 1295-001 Cell Harvester. The c.p.m. incorporated by each cell lysate were determined using an LKB 1205 Rackbeta Liquid Scintillation Counter (ICN, Costa Mesa, CA). For every sample, six different [3H]thymidine incorporations were carried out: a triplicate for the cells with the mitogen and a triplicate without the mitogen to determine the corresponding background levels. The mean c.p.m. value of each sample set is divided by the mean c.p.m. value of the corresponding control non-stimulated cells. For each mitogen, several mice of each genotype are used and the mean value is represented in the graph with the corresponding standard deviation bars. For reasons of simplicity, activation of wild-type splenocytes to any of the mitogens is established as 100%.
Cell death assays
Single-cell suspensions of wild-type or mTR–/– splenocytes were prepared by teasing the spleen through a nylon screen. Red cells were lysed by osmotic shock and single-cell suspensions were prepared. Cells were cultured at 37°C in RPMI 1640 medium (200 ml/well) supplemented with 10% fetal calf serum (FCS), 0.55 μM β-mercaptoetanol, 10 mM HEPES and 2 mM glutamine. Splenocytes (1 × 10⁶) were activated by incubation with 10 μg/ml LPS (Sigma) for 72 h. Apoptosis was determined by FACS analysis of propidium iodide-stained (Coulter DNA-Prep) samples. Cells with a DNA content lower than 2n were considered apoptotic.
Immunohistochemistry
Spleens from immunized and non-immunized wild-type and late generation G5 or G6 mTR–/– mice were embedded in OCT compound (Tissue-Tek) and frozen at –70°C. Sections of 8 μm were obtained using a cryostat (Leica CM 1900) and air-dried at room temperature for 30 min. Tissue sections were fixed in acetone at –20°C, incubated in 0.3% H2O2 in methanol for 30 min to inactivate internal peroxidases, then blocked in 6% goat serum in phosphate-buffered saline. Some sections were incubated with PNA-peroxidase (Sigma). Immunolabeled cells were visualized with diaminobenzidine (DAB; Sigma). The sections were incubated with biotin-conjugated rabbit anti-mouse B220 (Sigma) for 60 min; immunolabeled cells were then visualized with streptavidin–alkaline phosphatase and NBT-BCIP (Boehringer Mannheim). The sections were lightly counterstained with eosin. Other sections were incubated with K-370 (1:500) at 4°C overnight, followed by biotinylated anti-rabbit antibody (Amersham); immunolabeled cells were then visualized with streptavidin–peroxidase (Vecstain Kit; Vector Laboratories, Burlingame, CA) and DAB. Images were captured with 20× or 40× objectives, as indicated.
Quantitative fluorescent in situ hybridization
Splenocytes from wild-type and mTR–/– mice were cultured for 48 h in RPMI 1640 medium (200 ml/well) supplemented with 10% FCS, 0.55 μM β-mercaptoethanol, 10 mM HEPES and 2 mM glutamine in the presence of ionomycin (1 μM; Sigma) PMA (20 nM; Sigma) to stimulate cell division. Cells were harvested following 4–5 h treatment with colcemid (0.1 μg/ml) and cells were centrifuged (120 g, 8 min). After hypotonic swelling in sodium citrate (0.03 M) for 25 min at 37°C, cells were fixed in methanol:acetic acid (3:1). After two to three additional fixative changes, the cell suspension was dropped onto clean, wet slides and dried overnight. FISH was performed essentially as described (Zijlmans et al., 1997).
The Cy-3-labeled (C3TA2)3 PNA probe (Perseptive Biosystems, Bedford, MA) was dissolved in a hybridization buffer containing 70% formamide, 10 mM Tris pH 7.0, 0.25% (w/v) blocking reagent (Boehringer Mannheim) at a concentration of 0.5 μg/ml. The hybridization mixture (2 × 10 ml) was placed on the slides and a coverslip (22 × 60 mm) applied, followed by DNA denaturation (3 min, 80°C). After hybridization for 2 h at room temperature, slides were washed twice for 15 min each with 70% formamide–10 mM Tris pH 7.2 and three times for 5 min each with 0.05 M Tris, 0.15 M NaCl pH 7.5, Tween-20 0.05%. Slides were dehydrated in an ethanol series and air-dried, then counterstained with DAPI (0.2 μg/ml) in Vectashield (Vector Laboratories).
Digital images were recorded with a COHU High Performance CCD camera on a Leica Leitz DMRB fluorescence microscope (Leica, UK) equipped with a red fluorescence filter (Leica I3–513808) and a DAPI fluorescence filter (A–513808), both located on a manual wheel. Images were acquired with Q–FISH software (Leica), using a 100×/NA 1.0 objective lens (Leica) and a 100 W mercury/xenon lamp (Leica). A dedicated computer program was used for image analysis, as described (Zijlmans et al., 1997). The integrated fluorescence intensity for each telomere was calculated after correction for image acquisition exposure time. A minimum of 10 metaphases per group was analyzed.
Calibration
The details of calibration for telomere fluorescence intensity are explained elsewhere (Martens et al., 1998). Briefly, we used two calibration levels to ensure a reliable quantitative estimate of telomere length in various samples. First, to correct for daily variations in lamp intensity and alignment, images of fluorescent beads were acquired and analyzed with the Image Analysis computer program. Secondly, relative telomere fluorescence units (TFU) were extrapolated from plasmid calibration. For this, we hybridized and analyzed plasmids with a defined (TTAGGG)n length of 0.15, 0.40, 0.80 and 1.60 kb (Hanish et al., 1995). There was linear correlation (r = 0.986) for plasmid fluorescence intensity and (TTAGGG)n length, with a slope of 47.7. The calibration-corrected telomere fluorescence intensity (ccTFI) of each telomere was calculated according to the formula ccTFI = (Bea1/Bea2) × (TFI/47.7), where Bea1 = fluorescence intensity of beads when plasmids were analyzed, Bea2 = fluorescence intensity of beads when sample X was analyzed and TFI = unmodified fluorescence intensity of a telomere in sample X. Following this, the ccTFI of individual telomeres is expressed in TFU, in which one unit corresponds to 1 kb of plasmid TTAGGG repeats.
Acknowledgments
Acknowledgements
We are indebted to Juan Martín-Caballero and Esther Leonardo for their assistance. We thank Manuel Serrano and Cathy Mark for critical reading of the manuscript and Luis Borlado for helpful discussions. E.H. is supported by a predoctoral fellowship from the Department of Immunology and Oncology. Research at the laboratory of M.A.B. is funded by grants PM95-0014 and PM97-0133 from the Ministry of Education and Culture, Spain, by grant 08.1/0030/98 from the Regional Government of Madrid, and by the Department of Immunology and Oncology. The Department of Immunology and Oncology was founded and is supported by the Spanish Research Council (CSIC) and Pharmacia & Upjohn.
References
- Autexier C. and Greider, C.W. (1996) Telomerase and cancer: revisiting the telomere hypothesis. Trends Biochem., 21, 387–391. [PubMed] [Google Scholar]
- Blackburn E.H. (1991) Structure and function of telomeres. Nature, 350, 569–573. [DOI] [PubMed] [Google Scholar]
- Blasco M.A., Funk, W.D., Villeponteau, B. and Greider, C.W. (1995) Functional characterization and developmental regulation of mouse telomerase RNA. Science, 269, 1267–1270. [DOI] [PubMed] [Google Scholar]
- Blasco M.A., Lee, H.-W., Hande, P., Samper, E., Lansdorp, P., DePinho, R. and Greider, C.W. (1997) Telomere shortening and tumor formation by mouse cells lacking telomerase RNA. Cell, 91, 25–34. [DOI] [PubMed] [Google Scholar]
- Bodnar A.G. et al. (1998) Extension of life-span by introduction of telomerase into normal human cells. Science, 279, 349–352. [DOI] [PubMed] [Google Scholar]
- Bryan T.M., Englezou, A., Gupta, J., Bacchetti, S. and Reddel, R.R. (1995) Telomere elongation in immortal human cells without detectable telomerase activity. EMBO J., 14, 4240–4248. [DOI] [PMC free article] [PubMed] [Google Scholar]
- Bryan T.M., Marusic, L., Bacchetti, S., Namba, M. and Reddel, R.R. (1997) The telomere lengthening mechanism in telomerase-negative immortal human cells does not involve the telomerase RNA subunit. Hum. Mol. Genet., 6, 921–926. [DOI] [PubMed] [Google Scholar]
- Counter C.M., Avilion, A.A., LeFeuvre, C.E., Stewart, N.G., Greider, C.W., Harley, C.B. and Bacchetti, S. (1992) Telomere shortening associated with chromosome instability is arrested in immortal cells which express telomerase activity. EMBO J., 11, 1921–1929. [DOI] [PMC free article] [PubMed] [Google Scholar]
- Effros R.B. and Pawelec, G. (1997) Replicative senescence of T cells: does Hayflick limit lead to immune exhaustion? Immunol. Today, 18, 450–454. [DOI] [PubMed] [Google Scholar]
- Feng J. et al. (1995) The RNA component of human telomerase. Science, 269, 1236–1241. [DOI] [PubMed] [Google Scholar]
- Frenck R.W. Jr, Blackburn, E.H. and Shannon, K.M. (1988) The rate of telomere sequence loss in human leukocytes varies with age. Proc. Natl Acad. Sci. USA, 95, 5607–5610. [DOI] [PMC free article] [PubMed] [Google Scholar]
- Greenberg R.A., Allsopp, R.C., Chin, L., Morin, G. and DePinho, R. (1998) Expression of mouse telomerase reverse transcriptase during development, differentiation and proliferation. Oncogene, 16, 1723–1730. [DOI] [PubMed] [Google Scholar]
- Greider C.W. (1996) Telomere length regulation. Annu. Rev. Biochem., 65, 337–365. [DOI] [PubMed] [Google Scholar]
- Greider C.W. and Blackburn, E.H. (1985) Identification of a specific telomere terminal transferase activity in Tetrahymena extracts. Cell, 43, 405–413. [DOI] [PubMed] [Google Scholar]
- Greider C.W. and Blackburn, E.H. (1989) A telomeric sequence in the RNA of Tetrahymena telomerase required for telomere repeat synthesis. Nature, 337, 331–337. [DOI] [PubMed] [Google Scholar]
- Hande P., Samper,E., Lansdorp,P. and Blasco,M.A (1999a) Telomere length dynamics and chromosomal instability in cells derived from telomerase null mice. J.Cell Biol., 144, 589–601. [DOI] [PMC free article] [PubMed] [Google Scholar]
- Hanish J.P., Yanowitz, J.L. and de Lange, T. (1995) Stringent sequence requirements for the formation of human telomeres. Proc. Natl Acad. Sci. USA, 91, 8861–8865. [DOI] [PMC free article] [PubMed] [Google Scholar]
- Harley C.B., Futcher, A.B. and Greider, C.W. (1990) Telomeres shorten during aging of human fibroblasts. Nature, 345, 458–460. [DOI] [PubMed] [Google Scholar]
- Harrington L., Zhou, W., McPhail, T., Oulton, R., Yeung, D., Mar, V., Bass, M. and Robinson, M. (1997) Human telomerase contains evolutionarily conserved catalytic and structural subunits. Genes Dev., 11, 3109–3115. [DOI] [PMC free article] [PubMed] [Google Scholar]
- Herrera E., Samper, E. and Blasco, M.A (1999a) Telomere shortening in mTR–/– embryos is associated with failure to close the neural tube. EMBO J., 18, 1172–1181. [DOI] [PMC free article] [PubMed] [Google Scholar]
- Herrera E., Samper, E., Martín-Caballero, J., Flores, J.M., Lee, H.-W. and Blasco, M.A (1999b) Disease states associated to telomerase deficiency appear earlier in mice with short telomeres. EMBO J., 18, 2950–2960. [DOI] [PMC free article] [PubMed] [Google Scholar]
- Hiyama K., Hirai, Y., Kyoizumi, S., Akiyama, M., Hiyama, E., Piatyszek, M.A., Shay, J.W., Ishioka, S. and Yamakido, M. (1995) Activation of telomerase in human lymphocytes and hematopoietic progenitor cells. J. Immunol., 155, 3711–3715. [PubMed] [Google Scholar]
- Hodes R.J. (1999) Telomere length, aging and somatic cell turnover. J. Exp. Med., 190, 153–156. [DOI] [PMC free article] [PubMed] [Google Scholar]
- Hu B.T., Lee, S.C., Marin, E., Ryan, D.H. and Insel, R.A. (1997) Telomerase is up-regulated in human germinal center B cells in vivo and can be re-expressed in memory B cells activated in vitro. J. Immunol., 159, 1068–1071. [PubMed] [Google Scholar]
- Jiang X.-R. et al. (1999) Telomerase expression in human somatic cells does not induce changes associated with a transformed phenotype. Nature Genet., 21, 111–114. [DOI] [PubMed] [Google Scholar]
- Kelsoe G. (1996) Life and death in germinal centers. Immunity, 4, 107–111. [DOI] [PubMed] [Google Scholar]
- Kilian A., Bowtell, D.D.L., Abud, H.E., Hime, G.R., Venter, D.J., Keese, P.K., Duncan, E.L., Reddel, R.R. and Jefferson, R.A. (1997) Isolation of a candidate human telomerase catalytic subunit gene, which reveals complex splicing patterns in different cell types. Hum. Mol. Genet., 6, 2011–2019. [DOI] [PubMed] [Google Scholar]
- Kiyono T., Foster, S.A., Koop, J.I., McDougall, J.K., Galloway, D.A. and Klingelhutz, A.J. (1998) Both Rb/p16INK4a inactivation and telomerase activity are required to immortalize human epithelial cells. Nature, 396, 84–88. [DOI] [PubMed] [Google Scholar]
- Kosco-Vilbois M.H., Zentgraf, H., Gerdes, J. and Bonnefoy, J.-Y. (1997) To ‘B’ or not to ‘B’ a germinal center. Immunol. Today, 18, 225–230. [DOI] [PubMed] [Google Scholar]
- Lee H.-W., Blasco, M.A., Gottlieb, G.J., Horner, J.W., Greider, C.W. and DePinho, R.A. (1998) Essential role of mouse telomerase in highly proliferative organs. Nature, 392, 569–574. [DOI] [PubMed] [Google Scholar]
- Lingner J., Hughes, T.R., Schevchenko, A., Mann, M., Lundblad, V. and Cech, T. (1997) Reverse transcriptase motifs in the catalytic subunit of telomerase. Science, 276, 561–567. [DOI] [PubMed] [Google Scholar]
- Liu K., Schoonmaker, M.M., Levine, B.L., June, C.H., Hodes, R.J. and Weng, N.P. (1999) Constitutive and regulated expression of telomerase reverse transcriptase (hTERT) in human lymphocytes. Proc. Natl Acad. Sci. USA, 96, 5147–5152. [DOI] [PMC free article] [PubMed] [Google Scholar]
- Lundblad V. and Blackburn, E.H. (1993) An alternative pathway for yeast telomere maintenance rescues est1-senescence. Cell, 73, 347–360. [DOI] [PubMed] [Google Scholar]
- Martens U.M., Zijlmans, J.M., Poon, S., Dragowska, W., Yui, J., Chavez, E., Ward, R. and Lansdorp, P.M. (1998) Short telomeres on human chromosome 17p. Nature Genet., 18, 76–80. [DOI] [PubMed] [Google Scholar]
- Martín-Rivera L., Herrera, E., Albar, J.P. and Blasco, M.A. (1998) Expression of mouse telomerase catalytic subunit in embryos and adult tissues. Proc. Natl Acad. Sci. USA, 95, 10471–10476. [DOI] [PMC free article] [PubMed] [Google Scholar]
- McEachern M.J. and Blackburn, E.H. (1995) Runaway telomere elongation caused by telomerase RNA gene mutations. Nature, 376, 403–409. [DOI] [PubMed] [Google Scholar]
- McEachern M.J. and Blackburn, E.H. (1996) Cap-prevented recombination between terminal telomeric repeats arrays (telomere CPR) maintains telomeres in Kluyveromyces lactis lacking telomerase. Genes Dev., 10, 1822–1834. [DOI] [PubMed] [Google Scholar]
- Meyerson M. et al. (1997) hEST2, the putative human telomerase catalytic subunit gene, is upregulated in tumor cells and during immortalization. Cell, 90, 785–795. [DOI] [PubMed] [Google Scholar]
- Morales C.P., Holt, S.E., Ouellette, M., Kaur, K.J., Yan, Y., Wilson, K.S., White, M.A., Wright, W.E. and Shay, J.W. (1999) Absence of cancer-associated changes in human fibroblasts immortalized with telomerase. Nature Genet., 21, 115–118. [DOI] [PubMed] [Google Scholar]
- Nakamura T.M., Morin, G.B., Chapman, K.B., Weinrich, S.L., Andrews, W.H., Lingner, J., Harley, C.B. and Cech, T. (1997) Telomerase catalytic subunit homologs from fission yeast and human. Science, 277, 955–959. [DOI] [PubMed] [Google Scholar]
- Nakamura T.M., Cooper, J.P. and Cech, T. (1998) Two modes of survival of fission yeast without telomerase. Science, 282, 493–496. [DOI] [PubMed] [Google Scholar]
- Niida H., Matsumoto, T., Satoh, H., Shiwa, M., Tokutake, Y., Furuici, Y. and Shinkai, Y. (1998) Severe growth defect in mouse cells lacking the telomerase RNA component. Nature Genet., 19, 203–206. [DOI] [PubMed] [Google Scholar]
- Norrback K.F., Dahlenborg, K., Carlsson, R. and Roos, G. (1996) Telomerase activation in normal B lymphocytes and non-Hodgkin's lymphomas. Blood, 88, 222–229. [PubMed] [Google Scholar]
- Nugent C.I. and Lundblad, V. (1998) The telomerase reverse transcriptase: components and regulation. Genes Dev., 12, 1073–1085. [DOI] [PubMed] [Google Scholar]
- Rudolph K.L., Chang, S., Lee, H.-W., Blasco, M., Gottlieb, G., Greider, W.C. and DePinho, R.A. (1999) Longevity, stress response and cancer in aging telomerase deficient mice. Cell, 96, 701–712. [DOI] [PubMed] [Google Scholar]
- Singer M.S. and Gottschling, D.E. (1994) TLC1: Template RNA component of the Saccharomyces cerevisiae telomerase. Science, 266, 387–388. [DOI] [PubMed] [Google Scholar]
- Sprent J. (1997) Immunological memory. Curr. Opin. Immunol., 9, 371–379. [DOI] [PubMed] [Google Scholar]
- Vaziri H., Schachter, F. and Uchida, I. (1993) Loss of telomeric DNA during aging of normal and trisomy 21 human lymphocytes. Am. J. Hum. Genet., 52, 661–667. [PMC free article] [PubMed] [Google Scholar]
- Wang J., Xie, L.Y., Allan, S., Beach, D. and Hannon, G.J. (1998) Myc activates telomerase. Genes Dev., 12, 1769–1774. [DOI] [PMC free article] [PubMed] [Google Scholar]
- Weng N.-P., Granger, L. and Hodes, R.J. (1997) Telomere lengthening and telomerase activation during human B cell differentiation. Proc. Natl Acad. Sci. USA, 94, 10827–10832. [DOI] [PMC free article] [PubMed] [Google Scholar]
- Yashima K., Maitra, A., Timmons, C.F., Rogers, B.B., Pinar, H., Milchgrub, S., Wright, W.E., Shay, J.W. and Gazdar, A.F. (1998) Expression of the RNA component of human telomerase during development and differentiation. Cell Growth Diff., 9, 805–813. [PubMed] [Google Scholar]
- Zheng B., Han, S., Takahashi, Y. and Kelsoe, G. (1997) Immunosenescence and germinal center reaction. Immunol. Rev., 160, 63–77. [DOI] [PubMed] [Google Scholar]
- Zijlmans J.M., Martens, U.M., Poon, S., Raap, A.K., Tanke, H.J., Ward, R.K. and Lansdorp, P.M. (1997) Telomeres in the mouse have large inter-chromosomal variations in the number of T2AG3 repeats. Proc. Natl Acad. Sci. USA, 94, 7423–7428. [DOI] [PMC free article] [PubMed] [Google Scholar]