Differential mRNA expression of the human DNA methyltransferases (DNMTs) 1, 3a and 3b during the G0/G1 to S phase transition in normal and tumor cells (original) (raw)
Abstract
DNA methylation is essential for mammalian development, X-chromosome inactivation, and imprinting yet aberrant methylation patterns are one of the most common features of transformed cells. One of the proposed causes for these defects in the methylation machinery is overexpression of one or more of the three known catalytically active DNA methyltransferases (DNMTs) 1, 3a and 3b, yet there are clearly examples in which overexpression is minimal or non-existent but global methylation anomalies persist. An alternative mechanism which could give rise to global methylation errors is the improper expression of one or more of the DNMTs during the cell cycle. To begin to study the latter possibility we examined the expression of the mRNAs for DNMT1, 3a and 3b during the cell cycle of normal and transformed cells. We found that DNMT1 and 3b levels were significantly downregulated in G0/G1 while DNMT3a mRNA levels were less sensitive to cell cycle alterations and were maintained at a slightly higher level in tumor lines compared to normal cell strains. Enzymatic activity assays revealed a similar decrease in the overall methylation capacity of the cells during G0/G1 arrest and again revealed that a tumor cell line maintained a higher methylation capacity during arrest than a normal cell strain. These results reveal a new level of control exerted over the cellular DNA methylation machinery, the loss of which provides an alternative mechanism for the genesis of the aberrant methylation patterns observed in tumor cells.
INTRODUCTION
DNA in mammals can be modified post-replicatively by the addition of a methyl group to the 5-position of cytosine within the context of the CpG dinucleotide. Nearly 80% of CpG sites are methylated in human DNA in a non-random fashion (1). CpG-poor regions are generally hypermethylated while CpG-rich regions, termed CpG islands, are hypomethylated. CpG islands are often associated with the promoters of genes and are protected from methylation in normal cells by mechanisms which remain unclear (2). The degree of DNA methylation is generally inversely correlated with transcriptional activity when it occurs within the promoter region of a gene. The repression of transcription is thought to arise from both the inhibition of sequence-specific DNA binding factors (3) and the recruitment of methyl binding proteins which interact with histone deacetylases to modify histones and create a chromatin structure refractory to transcriptional initiation (4,5).
The enzymatic methylation machinery itself is composed of three known catalytically active DNA methyltransferases, DNMT1, 3a and 3b. DNMT1 has been the most extensively studied DNA methyltransferase and is the most abundant DNMT which is thought to be responsible for copying methylation patterns following DNA synthesis (6,7). DNMT1 is targeted to replication foci and has a 10–40-fold preference for hemimethylated DNA substrates (8,9). The newly identified DNMT3 enzymes are essential for embryonic development and are responsible for the wave of de novo methylation seen during embryogenesis which establishes the somatic methylation pattern for the organism (10,11). Mutations of the human DNMT3b gene are associated with ICF syndrome which is characterized by hypomethylated centromeric satellite sequences and genomic instability (11,12). All three DNMTs are ubiquitously expressed in adult and fetal tissues with fetal tissues expressing significantly higher levels than adult tissues (7,13).
Aberrant methylation patterns are one of the fundamental hallmarks of cancer cells. Tumor cells are in general hypomethylated relative to normal cells with regional hypermethylation (14). CpG islands are often targets of hypermethylation events in tumor cells indicating a fundamental disruption of methylation control in tumor cells (15). When a promoter-associated CpG island of a tumor suppressor gene becomes aberrantly hypermethylated this can silence expression of the relevant gene and act in a manner akin to deletion or mutation in giving the cell a selective growth advantage. The exact nature of the methylation defect in cancer cells is not known; however, it has been noted by several groups that DNMT1 is overexpressed in tumors cells (16,17) and more recently it has been shown that the DNMT3 family can be overexpressed as well (7,13). The degree of overexpression varies between reports but is usually 2–5-fold depending of the tumor type and the method of analysis. Not all tumors, however, overexpress the DNMTs (7) thus while overexpression may be necessary, in many cases it is probably not sufficient to cause the methylation defects observed in cancer cells.
Expression of DNMT1 has been shown to be upregulated by various oncogenic signals such as activated ras (18), fos (19) and the SV40 T-antigen (20). Low-level overexpression of DNMT1 results in cellular transformation while higher-level overexpression is toxic to cells (21,22). Levels of murine Dnmt1 have been shown to vary during the cell cycle and with the proliferative state of a cell (23) but there have been no reports on the cell cycle regulation of the DNMT3 family. Now that the role of the DNMT3 family in de novo methylation is firmly established, it is critical to examine the expression of these genes during the cell cycle and compare this with the cell cycle profile of DNMT1. In the present work, we investigated the expression of the three catalytically active human DNMTs at the RNA level in both normal and tumor cells and found that DNMT1 and 3b mRNA levels were nearly undetectable while DNMT3a mRNA levels were less affected when cells were arrested in G0/G1. The decrease in DNMT mRNA paralleled a similar decrease in enzymatic methylation capacity. This work is the first to demonstrate differential expression of the DNMTs during the cell cycle and reveals an additional level of regulation over the cellular methylation machinery which is likely to be essential for the proper maintenance of genomic methylation patterns.
MATERIALS AND METHODS
Tissue culture and cell synchronization
The T24 bladder tumor cell line and the normal fibroblast strains LD98 (bladder) and T-1 were maintained in McCoy’s 5-a supplemented with 10% (20% for LD98 and T-1) fetal bovine serum (FBS). MCF7 breast cancer cells were maintained in α-MEM supplemented with 10% FBS. Synchronization of MCF7 cells with Lovastatin has been described in detail previously (24). Briefly, cells were treated with 20 µM Lovastatin (Merck, Rahway, NJ) for 33 h after which time a 96% inhibition of DNA synthesis was achieved and cells were demonstrated to be arrested early in G1 (24). Cells were released by removal of Lovastatin and addition of 2 mM mevalonic acid (Sigma, St Louis, MO) and synchronized cells reached a peak of DNA synthesis 24 h after addition of mevalonic acid as measured by 3H-thymidine incorporation (24). T24, LD98 and T-1 cells were synchronized by a combination of confluence followed by maintenance in media containing 0.1% FBS for the times indicated. Cells were released by trypsinization and replating at lower density in media containing 10% (for tumor lines) or 20% (for normal cells) FBS.
Northern blot analysis
Twenty micrograms of total RNA were size fractionated on a 1.2% formaldehyde agarose gel, transferred to nylon membrane and hybridized with random primed cDNA fragments for the desired transcript. Probes were labeled with the Random-Prime DNA Label Kit (Roche Molecular Biochemicals, Indianapolis, IN) and hybridized at 65°C in ExpressHyb hybridization buffer (Clontech, Palo Alto, CA) according to the manufacturer’s instructions with the addition of 100 µg/ml sonicated human placental DNA (Sigma) to the ExpressHyb buffer. The DNMT3a cDNA probe corresponded to the _Eco_RI– _Not_I fragment derived from the EST plasmid containing the DNMT3a cDNA (GenBank accession no. W76111) and the DNMT3b cDNA probe corresponded to the _Hin_dIII–_Not_I fragment derived from the EST plasmid containing the DNMT3b3 cDNA (GenBank accession no. T66356) (10). The DNMT1 probe corresponded to the _Eco_RI–_Bam_HI fragment derived from plasmid pKR11D-6 (7). Detection of histone H4 employed an end-labeled antisense oligonucleotide probe (5′-CCT CGT AAA TGA GGC CAG AGA TCC GCT TAA-3′). Hybridization conditions were identical except the temperature was lowered to 48°C. Quantitation of northern blots was performed on a Molecular Dynamics (Sunnyvale, CA) PhosphorImager.
DNA methyltransferase assay
Methylation capacity was measured as described by Issa et al. (16). Briefly, cells were washed and resuspended in lysis buffer (50 mM Tris pH 7.8, 1.0 mM EDTA, 1.0 mM DTT, 0.1% sodium azide, 6 mg/ml PMSF, 10% glycerol, 1% Tween 80). The suspension was then passed through a 22-gauge needle twice, lysed by freeze–thaw and the protein concentration determined using the Bio-Rad protein assay reagent (Bio-Rad, Hercules, CA). For the DNA methyltransferase assay 20 µg of cellular protein was mixed with 500 ng of double-stranded oligonucleotides (unmethylated or hemimethylated), and 3 µCi SAM (S-adenosyl-l-[methyl-3H] methionine) (Amersham-Pharmacia, Piscataway, NJ) in a total volume of 20 µl for 2 h at 37°C. Stop solution (1.0 % SDS, 2.0 mM EDTA, 3% 4-aminosalicylate, 5% butanol, 0.25 mg/ml calf thymus DNA, 1.0 mg/ml proteinase K) was added and incubated at 37°C for 30 min. This solution was then extracted, ethanol precipitated and the pellet resuspended in 0.3 N NaOH and incubated at 37°C for 45 min. This solution was then spotted onto a Whatman GF/C filter, dried, washed with 5% trichloroacetic acid followed by 70% ethanol then counted using a Beckman liquid scintillation counter. All reactions were done in triplicate. The sequences of the oligonucleotides (Operon Technologies, Alameda, CA) used were: top (5′-GGG GGC CAA GCG CGC GCC TGG CGC CCG GGC CGG CTC AAG CGC GCG CCT GGC GCC CGG ATC-3′), and bottom (5′-GAT CCG GGC GCC AGG CGC GCG CTT GAG CCG GCC CGG GCG CCA GGC GCG CGC TTG G-3′). To create a hemimethylated substrate the bottom strand oligonucleotide was synthesized with 5-methylcytosine at all potential CpG sites and annealed to the same unmethylated top strand oligonucleotide.
RESULTS
In order to determine if the mRNAs for the human DNMT3 family varied during the cell cycle, as has been show to be the case for Dnmt1 in an immortalized murine cell line, steady-state levels of the human DNMT1, 3a and 3b mRNA transcripts were monitored in MCF7 breast cancer cells arrested in G1 by Lovastatin treatment and then released from the cell cycle block and followed for one round of DNA replication (24). Lovastatin has the advantage of being very efficient at arresting tumor cells as well as being relatively non-toxic and completely reversible (24). Northern blotting of total RNA from various timepoints during synchronization, G1 arrest and release indicated that the mRNA levels of DNMT1 and 3b varied similarly and were at their lowest levels during G1 and peaked late in S phase (Fig. 1). DNMT3b mRNA levels also exhibited an early peak at ∼8 h release which was not observed with DNMT1. DNMT3a mRNA levels on the other hand showed a minimal decrease during the same period (Fig. 1). DNA synthesis peaked ∼24 h after removal of Lovastatin and addition of mevalonic acid and cells reached a second G1 at ∼40 h and gradually began to escape synchrony beyond this timepoint (not shown, 24). Histone H4 (Fig. 1D) was used as a control to show that cells were growth arrested since histone mRNA synthesis has been shown to be tightly linked to DNA synthesis (25). The 28S ribosomal RNA (Fig. 1E) served as a loading control and indicated that samples were comparably loaded. The ratio of DNMT3a to DNMT1, determined by quantitation of the northern blots, was almost 6-fold higher in G1 than in S phase cells whereas the ratio of DNMT3b to DNMT1 was less subject to change (Fig. 1G).
Figure 1.
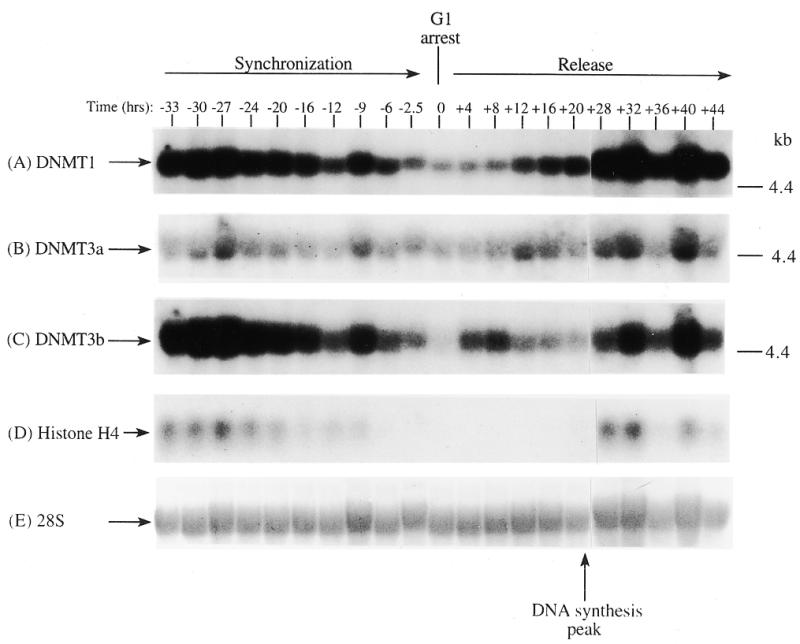


Synchronization and release of MCF7 breast cancer cells by Lovastatin. Total RNA from cells cultured in the presence of Lovastatin (negative numbers) then released back into cycle by the addition of mevalonic acid (positive numbers) was used for northern blotting with cDNA probes specific for (A) DNMT1, (B) DNMT3a, (C) DNMT3b and (D) histone H4. Molecular weights in kilobases (kb) are indicated at the right. At time zero cells were >96% inhibited for DNA synthesis while DNA synthesis reached a peak at ∼24 h after release (not shown) (24). Histone H4 mRNA served as a measure of cell proliferation while the 28S ribosomal RNA (E) served as a loading control. (F) PhosphorImager quantitation of the results from (A) to (D). Note that blots were sequentially probed for each transcript and exposures optimized for accurate PhosphorImager quantitation and thus do not accurately reflect absolute mRNA levels. (G) Data from (F) presented as the ratio of DNMT3a (dark gray bars) or DNMT3b (light gray bars) to DNMT1 for select timepoints.
We extended our observations in MCF7 cells to the T24 bladder cancer cell line and the LD98 normal fetal bladder fibroblast strain. These cells were efficiently growth arrested by a combination of confluence and culture in medium containing 0.1% FBS. Flow cytometry of such growth-arrested cells following propidium iodide staining showed that >95% of the cells were in the G1/G0 phase of the cell cycle (not shown). Each of the cell types was grown to confluence, the medium changed to serum-deficient medium, and the cells cultured for various times before being restimulated into the cell cycle by trypsinization and replating at low density in medium containing normal levels of FBS. The results for the T24 tumor line and the LD98 normal fibroblast strain (Fig. 2A, B and C) indicated that during a prolonged period of arrest (7 days in Fig. 2 compared to several hours in Fig. 1) all three DNMT transcripts decreased significantly and then increased substantially when cells were released back into cycle. Similar results were obtained with another fibroblast strain, T-1 (results not shown). DNMT1 and 3b were downregulated to a greater degree than DNMT3a, consistent with the results for the MCF7 cells synchronized with Lovastatin (Fig. 1). Interestingly, while DNMT3b mRNA steadily increased to its pre-arrest level, DNMT1 and 3a mRNAs exhibited a distinct peak before returning to pre-arrest levels. Hybridization to histone H4 (Fig. 2D) served as a control that cells were arrested while the 28S ribosomal RNA (Fig. 2E) served as a loading control. Quantitation of the northern blot results revealed that levels of DNMT3a decreased more significantly, relative to DNMT1 and 3b, in the normal cell strain than in the two tumor cell lines (Figs 1G and 2F). While the ratio of DNMT3b to DNMT1 remained relatively constant for all cell types and all timepoints, the ratio of DNMT3a to DNMT1 increased to a slightly greater degree in the tumor cell lines (5–6-fold) than in the normal fibroblast strains (2–3-fold).
Figure 2.
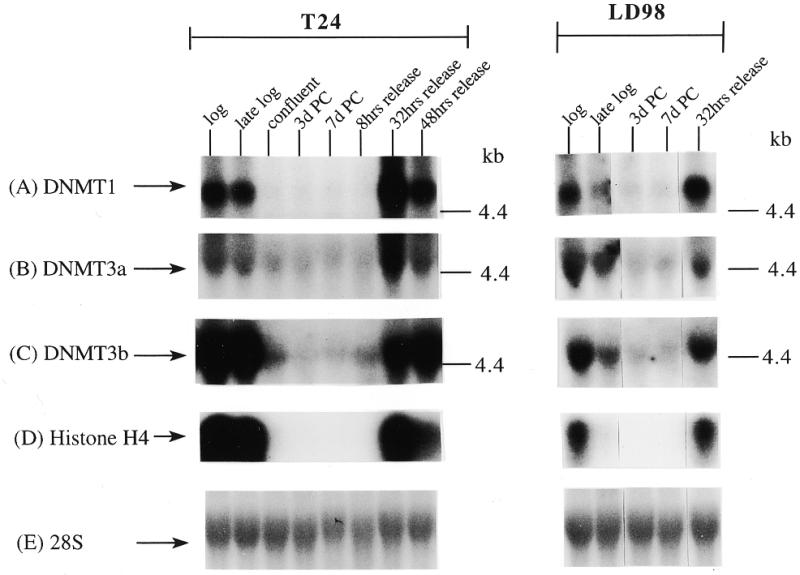


Synchronization of T24 bladder cancer cells (left) and LD98 normal fetal bladder fibroblasts (right) by confluence and growth in 0.1% FBS followed by release into cycle by replating at low density and growth in 10% FBS (20% for LD98). Total RNA from cells cultured in media containing 10% FBS [log, late log, confluent, 8, 32 and 48 h (‘hrs’) release] or 0.1% FBS [3 and 7 days (‘d’) post confluent (‘PC’)] was used for northern blotting with cDNA probes specific for (A) DNMT1, (B) DNMT3a, (C) DNMT3b and (D) histone H4. Molecular weights in kilobases (kb) are indicated at the right. Histone H4 mRNA served as a measure of cell proliferation while the 28S ribosomal RNA (E) served as a loading control. (F) PhosphorImager quantitation of the results from (A) to (D). Note that blots were sequentially probed for each transcript and exposures optimized for accurate PhosphorImager quantitation and thus do not accurately reflect absolute mRNA levels. (G) Data from (A) to (D) presented as the ratio of DNMT3a (dark gray bars) or DNMT3b (light gray bars) to DNMT1 for T24 (top) and LD98 (bottom).
Did the changes in DNMT mRNA levels translate into similar changes in methylation capacity of the cells? To address this issue, cell extracts were prepared from select timepoints during the arrest/release experiment from both LD98 (Fig. 3A) and T24 (Fig. 3B) cells and incubated with unmethylated (black bars) or hemimethylated (gray bars) double-stranded oligonucleotides and 3H-SAM as methyl donor. Results of triplicate experiments indicated that the methylation capacity decreased significantly in both T24 and LD98 cells during prolonged arrest (d3 p.c.) with T24 cells maintaining a slightly higher methylation capacity than LD98 cells for both substrates. Upon release into the cell cycle DNMT activity rapidly returned to the pre-arrest level. Interestingly, de novo DNMT activity (as monitored with the unmethylated substrate) increased to the pre-arrest level more quickly than did maintenance DNMT activity (as monitored with the hemimethylated substrate) and the overall level of maintenance DNMT activity was higher at all timepoints for both cell types.
Figure 3.

Average DNA methyltransferase activity in cell extracts prepared from LD98 (A) and T24 (B) cells. Twenty micrograms of cellular protein were incubated with an unmethylated (black bars) or hemimethylated (gray bars) double-stranded oligonucleotide substrate and 3H–SAM in triplicate reactions then counted in a scintillation counter. Incubation of cell extract in the absence of DNA substrate served as a background control for RNA methylation and was subtracted from each point. Error bars represent the standard deviation from the mean.
DISCUSSION
In the present paper we have investigated the expression of the three known catalytically active human DNA methyltransferases during the cell cycle in both normal and tumor cells. Results indicated that mRNA levels of all three DNMTs changed to varying extents during the cell cycle, with DNMT1 and 3b showing the largest decreases in G1 and DNMT3a the smallest. A larger decrease in DNMT3a mRNA was observed after more prolonged cell arrest which presumably corresponds to the G0 phase of the cell cycle. Furthermore, the ratio of the DNMT3a relative to DNMT1 increased in G1 and was 2–3-fold greater in tumor cells compared to normal fibroblasts. At the protein level, a DNA methyltransferase assay showed that the overall methylation capacity of the cells decreased significantly in both normal and tumor cells, with the tumor cells maintaining a slightly higher DNMT capacity than normal cells, and then rapidly returned to pre-arrest levels after release into cycle. Thus we have identified a new level of regulation imposed on the cellular DNA methylation machinery which is likely to be critical in maintaining normal methylation patterns and provides an additional pathway which could become dysregulated in tumor cells and lead aberrant methylation.
Is the differential downregulation of DNMT3a in normal versus tumor cell lines during cell cycle arrest significant? In the present study we utilized epithelial-derived tumor cell lines and normal fibroblast strains as ‘representatives’ of the tumor and normal states, respectively. Although both T24 and LD98 are derived from bladder tissue, the use of two different cell types makes such a conclusion impossible at this time. Future work will include examination of additional cell lines and cell lines derived from identical lineages. Potential aberrations in cell cycle-regulated expression of DNMTs provides an alternative explanation to DNMT overexpression as a contributor to the methylation anamolies observed in tumor cells. Inappropriately high level expression of one of the DNMTs during G1 for example could give rise to methylation errors or de novo methylation events at normally unmethylated CpG sites which would then be copied by DNMT1 after cell division (26). Such inappropriate timing of expression of a critical level of DNMT activity during multiple rounds of cell division could then lead to a progressive increase in aberrant methylation over time and could also be responsible for the global hypomethylation observed in tumor cells if, for example, certain DNMTs are localized to specific regions of the nucleus or are responsible for propagating methylation patterns of DNA segments which replicate during specific times during S phase. Such a specific function and localization has indeed been demonstrated for Dnmt3b which appears to be responsible for the initiation and/or maintenance of normal centromeric DNA methylation patterns (11,12,27).
Examination of enzymatic methylation capacity of cells during G0 revealed a significant decrease in both normal and tumor cells with tumor cells maintaining a slightly higher overall methylation capacity than normal cells. Upon release back into the cell cycle de novo methylation activity returned to pre-arrest levels more rapidly than maintenance methylation activity. Since DNMT3a mRNA levels remain consistently higher in G0/G1 arrested cells this enzyme may be responsible for the more rapid recovery of de novo activity since DNMT3a mRNA (and potentially protein) is already present and does not have to be synthesized de novo as in the case of DNMT1 and 3b. The higher methylation capacity observed for the arrested tumor cells compared with the arrested normal cells may also be attributable to the slightly higher levels of DNMT3a mRNA found at this stage of the cell cycle. De novo methylation in growth-arrested cells is not without precedence. Our previous studies examining remethylation of endogenous loci following 5-aza-2′-deoxycytidine treatment of T24 cells revealed that the rate of remethylation was unaffected by growth of the cells under reduced serum conditions (28). Furthermore, Pieper et al. observed de novo methylation at specific CpG island loci after a very long period of growth arrest (29) indicating that methylation need not be strictly linked to DNA replication. The exact role for DNMT3a in these effects will only be resolved when the catalytic activities of the DNMT3 family are characterized and antibodies become available to determine if the changes in mRNA level parallel changes in protein level for each DNMT. Such studies will be the focus of future work.
Acknowledgments
ACKNOWLEDGEMENTS
This work was supported by grant R01 CA 82422 from the National Cancer Institute (P.A.J.). K.D.R was supported by an American Cancer Society postdoctoral fellowship.
REFERENCES
- 1.Bird A. (1992) Cell, 70, 5–8. [DOI] [PubMed] [Google Scholar]
- 2.Bird A. (1986) Nature, 321, 209–213. [DOI] [PubMed] [Google Scholar]
- 3.Tate P.H. and Bird,A.P. (1993) Curr. Opin. Genet. Dev., 3, 226–231. [DOI] [PubMed] [Google Scholar]
- 4.Jones P.L., Veenstra,G.J.C., Wade,P.A., Vermaak,D., Kass,S.U., Landsberger,N., Strouboulis,J. and Wolffe,A.P. (1998) Nature Genet., 19, 187–191. [DOI] [PubMed] [Google Scholar]
- 5.Nan X., Ng,H.-H., Johnson,C.A., Laherty,C.D., Turner,B.M., Eisenman,R.N. and Bird,A. (1998) Nature, 393, 386–389. [DOI] [PubMed] [Google Scholar]
- 6.Bestor T.H. and Verdine,G.L. (1994) Curr. Opin. Cell Biol., 6, 380–389. [DOI] [PubMed] [Google Scholar]
- 7.Robertson K.D., Uzvolgyi,E., Liang,G., Talmadge,C., Sumegi,J., Gonzales,F.A. and Jones,P.A. (1999) Nucleic Acids Res., 27, 2291–2298. [DOI] [PMC free article] [PubMed] [Google Scholar]
- 8.Leonhardt H., Page,A.W., Weier,H. and Bestor,T.H. (1992) Cell, 71, 865–873. [DOI] [PubMed] [Google Scholar]
- 9.Pradhan S., Bacolla,A., Wells,R.D. and Roberts,R.J. (1999) J. Biol. Chem., 274, 33002–33010. [DOI] [PubMed] [Google Scholar]
- 10.Okano M., Xie,S. and Li,E. (1998) Nature Genet., 19, 219–220. [DOI] [PubMed] [Google Scholar]
- 11.Okano M., Bell,D.W., Haber,D.A. and Li,W. (1999) Cell, 99, 247–257. [DOI] [PubMed] [Google Scholar]
- 12.Xu G.-L., Bestor,T.H., Bourc’his,D., Hsieh,C.-L., Tommerup,N., Bugge,M., Hulten,M., Qu,X., Russo,J.J. and Viegas-Pequignot,E. (1999) Nature, 402, 187–191. [DOI] [PubMed] [Google Scholar]
- 13.Xie S., Wang,Z., Okano,M., Nogami,M., Li,Y., He,W.-W., Okumura,K. and Li,E. (1999) Gene, 236, 87–95. [DOI] [PubMed] [Google Scholar]
- 14.Jones P.A. and Laird,P.W. (1999) Nature Genet., 21, 163–166. [DOI] [PubMed] [Google Scholar]
- 15.Baylin S.B., Herman,J.G., Herman,J.R., Vertino,P.M. and Issa,J.-P. (1998) Adv. Cancer Res., 72, 141–196. [PubMed] [Google Scholar]
- 16.Issa J.-P., Vertino,P.M., Wu,J., Sazawal,S., Celano,P., Nelkin,B.D., Hamilton,S.R. and Baylin,S.B. (1993) J. Natl Cancer Inst., 85, 1235–1240. [DOI] [PubMed] [Google Scholar]
- 17.Kautiainen T.L. and Jones,P.A. (1986) J. Biol. Chem., 261, 1594–1598. [PubMed] [Google Scholar]
- 18.MacLeod A.R., Rouleau,J. and Szyf,M. (1995) J. Biol. Chem., 270, 11327–11337. [DOI] [PubMed] [Google Scholar]
- 19.Bakin A.V. and Curran,T. (1999) Science, 283, 387–390. [DOI] [PubMed] [Google Scholar]
- 20.Slack A., Cervoni,N., Pinard,M. and Szyf,M. (1999) J. Biol. Chem., 274, 10105–10112. [DOI] [PubMed] [Google Scholar]
- 21.Vertino P.M., Yen,R.-W.C., Gao,J. and Baylin,S.B. (1996) Mol. Cell. Biol., 16, 4555–4565. [DOI] [PMC free article] [PubMed] [Google Scholar]
- 22.Wu J., Issa,J.-P., Herman,J., Bassett,D.E., Nelkin,B.D. and Baylin,S.B. (1993) Proc. Natl Acad. Sci. USA, 90, 8891–8895. [DOI] [PMC free article] [PubMed] [Google Scholar]
- 23.Szyf M., Bozovic,V. and Tanigawa,G. (1991) J. Biol. Chem., 266, 10027–10030. [PubMed] [Google Scholar]
- 24.Keyomarsi K., Sandoval,L., Band,V. and Pardee,A.B. (1991) Cancer Res., 51, 3602–3609. [PubMed] [Google Scholar]
- 25.Heintz N., Sive,H.L. and Roeder,R.G. (1983) Mol. Cell. Biol., 3, 539–550. [DOI] [PMC free article] [PubMed] [Google Scholar]
- 26.Jones P.A. (1996) Cancer Res., 56, 2463–2467. [PubMed] [Google Scholar]
- 27.Hansen R.S., Wijmenga,C., Luo,P., Stanek,A.M., Canfield,T.K., Weemaes,C.M.R. and Gartler,S.M. (1999) Proc. Natl Acad. Sci. USA, 96, 14412–14417. [DOI] [PMC free article] [PubMed] [Google Scholar]
- 28.Bender C.M., Gonzalgo,M.L., Gonzales,F.A., Nguyen,C.T., Robertson,K.D. and Jones,P.A. (1999) Mol. Cell. Biol., 19, 6690–6698. [DOI] [PMC free article] [PubMed] [Google Scholar]
- 29.Pieper R.O., Lester,K.A. and Fanton,C.P. (1999) Nucleic Acids Res., 27, 3229–3235. [DOI] [PMC free article] [PubMed] [Google Scholar]