Thymic microenvironment reconstitution after postnatal human thymus transplantation (original) (raw)
. Author manuscript; available in PMC: 2012 Sep 1.
Published in final edited form as: Clin Immunol. 2011 Apr 16;140(3):244–259. doi: 10.1016/j.clim.2011.04.004
Abstract
A functional thymus develops after cultured thymus tissue is transplanted into subjects with complete DiGeorge anomaly. To gain insight into how the process occurs, 7 post-transplantation thymus biopsy tissues were evaluated. In 5 of 7 biopsies, the thymus appeared to be predominantly cortex with thymocytes expressing cortical markers. Unexpectedly, the epithelium expressed both cortical [cortical dendritic reticulum antigen 2 (CDR2)] and medullary [cytokeratin (CK) 14] markers. Early medullary development was suggested by epithelial cell adhesion molecule (EpCAM) reactivity in small areas of biopsies. Two other biopsies had distinct mature cortex and medulla with normal restriction of CK14 to the medulla and subcapsular cortex, and of CDR2 to cortex. These data are consistent with a model in which thymic epithelium contains CK14+ “progenitor epithelial cells”. After transplantation these cells proliferate as CK14+CDR2+ thymic epithelial cells that are associated with cortical thymocytes. Later these cells differentiate into distinct cortical and medullary epithelia.
Keywords: thymus transplantation, thymopoiesis, progenitor epithelial cells, cytokeratin
Introduction
Complete DiGeorge anomaly (cDGA), is a primary immunodeficiency characterized by congenital athymia, heart disease and hypoparathyroidism. Because there is no thymus, educated T cells cannot develop, which leads to susceptibility to infection. Infants with this disorder usually succumb to infection by 2 years of life.
Cultured postnatal allogeneic thymus transplantation is a promising therapy for treatment of the immune deficiency associated with cDGA [1, 2]. Thymus transplantation results in development of functioning T cells and survival [3–5] and presents the opportunity to investigate how a functional thymus microenvironment is reconstituted after transplantation.
Two major constituents of thymus are epithelium and thymocytes. Cortical and medullary thymic epithelial cells function in positive selection of thymocytes and in establishing tolerance of thymocytes to self antigens, respectively [6–11]. Cortical and medullary epithelia have distinct phenotypes. In normal human thymus, the medullary (and subcapsular-cortical) epithelial cells express cytokeratin 14 (CK14) [12]. Medullary epithelial cells also express epithelial cell adhesion molecule (EpCAM) [13] and autoimmune regulator (Aire), which is important in negative selection [14, 15]. Human cortical thymic epithelial cells express cortical dendritic reticulum antigen 2 (CDR2) [13, 16].
We hypothesized that a subpopulation of thymic epithelial cells in the cultured tissue are progenitor cells with capacity to differentiate into cortical and medullary epithelium after transplantation as prothymocytes migrate to the thymus and begin their maturation. Based on our hypothesis, we predicted that regenerating thymus tissue would have features distinct from both the mature thymus at the time of harvest from the donor and from the transplanted, cultured thymus tissue.
A logical extension of our hypothesis is that regeneration of thymus tissue would involve expression of genes characteristic of the developing thymus. A number of genes have been described which are important in thymic epithelial development. Foxn1 is a transcriptional activator [17–22] that controls, in part, the development of thymic epithelium. Differentiation of primitive precursor cells into subcapsular, cortical, and medullary epithelial cells of the postnatal murine thymus depends on activity of the Foxn1 gene [18]. In the murine embryonic thymus, Foxn1 is expressed in 80% of cytokeratin-positive epithelial cells [21]. We predicted that Foxn1 expression would be associated with reconstitution of the thymic allograft after transplantation in humans.
Other genes involved in murine embryonic thymus development include Paired box 1 (Pax1) [23], Pax9 [24], and Eyes absent 1 (Eya1) [25]. Pax1 is found by immunohistochemistry (IHC) throughout the thymic primordium and in scattered cells in the cortex of murine postnatal thymus [26]. Recently, murine adult medullary thymic epithelial cells (TEC) were found to express Pax1, Pax9 and Eya1 [27]. We predicted that biopsies of thymus tissue would express these genes.
In this study, comparison of freshly harvested donor thymus tissue and cultured thymus tissue prior to transplantation with biopsies of transplanted thymus tissue revealed patterns of cytokeratin expression and gene expression that were consistent with regeneration of thymic tissue from progenitor epithelial cells after thymus transplantation.
Materials and Methods
Research Subjects
Seven infants with cDGA transplanted with unrelated cultured postnatal thymus tissue are included in this report as well as 6 thymus donors whose thymuses were transplanted and 8 thymus donors whose thymuses were obtained for research only (as thymus was not needed for transplantation at that time the research tissue was obtained). All subjects and thymus donors were enrolled in protocols approved by the Duke Institutional Review Board (IRB). All transplantation protocols were reviewed by the Food and Drug Administration (FDA) and were conducted under an Investigational New Drug application. The parent(s) of cDGA subjects and the thymus donors provided informed consent in all cases. Some additional de-identified thymus tissue and thymocytes were used as controls for these research studies under an IRB-approved waiver of consent.
Flow cytometry/spectratyping
Standard techniques were used for 4-color flow cytometry of anti-coagulated blood samples [3]. Naive CD4 T cells were identified by gating on CD3 then CD4 and then analyzing these cells for co-expression of CD45RA and CD62L [28]. Analysis of CD4 T cell receptor variable beta (TCRBV) usage by flow cytometry was performed with the Beckman Coulter kit (IM3497) after year 2006 (for subjects, DIG309, DIG409, DIG410, DIG412, DIG413) and was performed with individual antibodies from Beckman Coulter prior to that time (for subjects DIG012 and DIG024). All T cell counts were calculated using the absolute lymphocyte count obtained from a complete blood count drawn at the time of the flow cytometry assay.
Spectratyping to assess T cell receptor diversity was performed as previously reported on isolated CD4 T cells [29, 30].
Thymus transplantation and allograft biopsies
Thymus transplantation and allograft biopsies were performed as described [5, 30–32]. For transplantation, thymus tissue discarded during cardiac surgery was collected. The thymus tissue was sliced and held in culture for 15 to 21 days prior to transplantation [3, 33, 34]. Variation in timing depended on completion of donor screening and availability of the operating room and surgeon. Thymus slices were inserted into the quadriceps muscle in an open procedure in the operating room [35]. The biopsy was an open procedure under general anesthesia done 2 to 3 months after transplantation [5, 35]. For each biopsy, 3 to 4 different tissue samples were obtained. Each of the 3 to 4 biopsy samples was divided into multiple pieces. One piece was placed in formalin for later embedding in paraffin. A second piece was placed in saline prior to embedding in OCT (Sakura Finetek U.S.A. Inc., CA) for frozen sections. In the last 5 biopsies, a third piece was immediately placed on dry ice for transport and later processing for RNA isolation.
Real-time quantitative PCR
Total RNA from biopsy specimens and donor thymus tissue was isolated by RNeasy lipid tissue mini kit (QIAGEN Inc. Valencia, CA). Single-stranded cDNA was synthesized by using the QuantiTect cDNA synthesis kit (QIAGEN Inc. Valencia, CA). The MyiQ single-color real-time PCR detection system (Bio-Rad Laboratories, Inc. Hercules, CA) was used for real-time PCR. Gene expression data were measured according to the ΔΔCt method normalized to 18S rRNA and glyceraldehyde-3-phosphate dehydrogenase (GAPDH) reference genes. Skeletal muscle RNA was purchased from Clontech (Mountain View, CA).
The following primers 5′ to 3′ were used [(F) and (R) indicate forward and reverse]: Aire (F) GACAAGTTTCAGGAGACG; Aire (R) GTAGTCCTTGAACAGCAC; Wnt10b (F) GAATGCGGCTCTGACAAG; Wnt10b (R) CGATCAGGACCTCCAGTG; Foxn1 (F) CCCCAGCCAGGACTATGC; Foxn1 (R) GCTATCATCCTTCAACTGTTCC; CK14 (F) CCTCTCCTCCTCCCAGTTC; CK14 (R) TGACCTTGGTGCGGATTTG; Pax1 (F) TTTCCTTGCTCCGACCTC; Pax1 (R) ACAGTAGAACCAGAGACAGAG; Pax9 (F) AAGCCAAGTACGGTCAGG; Pax9 (R) AAGGAGCCATGCTGGATGC; Eya1 (F) GTCTGAGTGGTAGTAGTGAATCC; Eya1 (R) CGTCGGCTGTCGTTGAAG.
The 25 μL PCR mixture consisted of 3 μL of 10 fold diluted cDNA solution, 12.5 μL of 2× iQ SYBR Green Supermix PCR buffer (Bio-Rad Laboratories, Inc.), 0.5 μL of 10 μM forward primer, 0.5 μL of 10 μM reverse primer, and 8.5 μL sterile water. The PCR conditions were set at 95°C for 3 minutes for first cycle. The second cycle started at 95°C for 10 seconds, and 52.6°C for Pax1, Pax9 and Eya1, or 57.5°C for Foxn1 and CK14 for 40 cycles. After finishing 40 PCR cycles, a melting curve analysis was performed using 80 cycles of 95°C for 1 minute, 55°C 1 minute, and 55°C to 94.5°C with the temperature increasing after cycle 2 by 0.5°C per cycle.
Controls for Real-time quantitative PCR
Control experiments showed that CK14 mRNA is not present in skeletal muscle (see Results section). Some biopsy specimens had no CK14 mRNA. In experiments not shown, we assayed CK14 negative biopsy samples for expression of CK5 and CK8 RNA. The samples negative for CK14 RNA did not contain CK5 or CK8 RNA. Thus, we conclude that samples negative for CK14 RNA did not contain thymus tissue. The RNA derived from those CK14− RNA samples was used as a negative control for the experiments below to show the level of gene expression in muscle, fat, fibrosis tissue and inflammatory cells at the surgical site. Finding of CK5+ and CK14+ RNA in biopsies defined the existence of thymus tissue in that sample.
Of note, in the human there isn’t a TEC restricted housekeeper gene similar to EpCAM which is present in all TEC in the murine embryonic day 12 thymic rudiment. Thus, we do not have a gene that can establish the precise amount of TEC present in a given sample.
Immunohistochemistry
Frozen and formalin-fixed paraffin-embedded sections of fresh and cultured thymus and allograft biopsy tissue were reacted with a panel of antibodies specific for Foxn1 (Novus Biologicals, Inc, Littleton, CO), CK14 (clone LL002, Thermo Fisher Scientific, Fremont, CA), CK10 (clone DE-K10, Thermo Fisher Scientific, Fremont, CA), EpCAM (clone HEA125, Abcam Inc., Cambridge, MA), pan-CK (polyclonal AE1/AE3, Dako, Carpinteria, CA), CD3 (polyclonal, Dako), CK5 (clone XM26, Biocare Medical LLC, Concord, CA), CD1a (clone O10, Beckman Coulter, Marseille, France) and Ki-67 (clone mib-1, Beckman Coulter) [36]. CDR2, an IgM anti-cortical epithelium antibody, was provided by Dr. Bruno Kyewski (Heidelberg Germany) [37]. CK14 and pan-CK were used to identify thymus tissue in the biopsy samples. CK10 and EpCAM were used to identify Hassall’s bodies and medullary thymic epithelial cells, respectively. CD1a and Ki-67 were used to identify cortical thymocytes. Histological evidence of thymopoiesis in biopsies was defined as the presence of a lacy pattern of CK+ thymic epithelial cells and the presence of CD3+CD1a+Ki-67+ cells (cortical thymocytes). Control thymus tissue from the day of harvest was stained at the time of every subject assay to assure that all antibodies were working appropriately. The Foxn1 antibody was tested for specificity by showing lack of reactivity with tonsil tissue (not shown).
Image measurement
Consecutive sections of biopsy tissue were cut. CK14 and panCK staining was performed. As the biopsy sections were small, the entire epithelial area (based on panCK staining) was included in each analysis. The area of CK14 was compared to the area of panCK. Adobe Photoshop (Adobe Systems Incorporated) and Image J (NIH) software were used to measure the areas of cultured thymus that were positive for panCK and CK14 by IHC. Photomicrographs were taken of frozen sections reacted with the antibodies. Photoshop was used to create a digital image of the pan CK and CK14 positive areas (based on diaminobenzidine (DAB) staining) without inclusion of the negative areas. Measurement of the selected surface area based on DAB staining was calculated by Image J software.
Statistical analysis
Potential differences in Foxn1 mRNA expression found in these thymus tissues and CK+ biopsy tissues were analyzed using a Normal Scores Test with a 2-sided significance level.
Results
T cell development after thymus transplantation
We evaluated the number of total T cells, T cell subsets and naïve T cells in PBMC in 7 subjects before and after transplantation. The development of CD3 T cells and naïve CD4 T cells after transplantation in the 7 subjects are illustrated (Fig. 1A). The time course of T cell development is similar to what we have previously reported with naïve T cells appearing between 3 and 7 months after transplantation. An example of the flow cytometry analysis showing development of CD62L and CD45RA double-positive naïve CD4+ T cells is presented for subject DIG413 (Fig. 1B). Similar data were obtained for the other subjects. The subjects developed polyclonal CD4 repertoires as assessed by spectratyping in 4 of the 7 subjects (two examples are shown in Fig 1C, the other 3 subjects were not assessed by spectrotyping) and flow cytometry in all subjects (Fig 1D). One subject (DIG024) had a CD4 amplification in TCRBV4 on post transplantation day 749 which was also found on day 1398. Regarding CD8 T cell development, we see lower numbers of CD8 T cells than in healthy children. We have not seen inverted CD4 to CD8 T cell ratios in our subjects. Of the 28 data points in our 7 subjects starting after one year post transplantation, all flow cytometry data show a CD4:CD8 ratio greater than 1.3. Of the 7 DiGeorge subjects included in this report, the genetic identity of post-transplantation T cells was tested in clinical laboratories in 7 subjects using molecular or cytogenetic analyses. All 7 subjects had only host T cells detected, consistent with our findings in the cDGA population overall [38]. The development of naïve T cells in conjunction with IHC of allograft biopsy samples showing thymopoiesis [5] led us to conclude that after culture and transplantation into these individuals, the donor thymus tissues were able to reconstitute thymopoiesis. These allograft biopsies and donor thymus tissues were thus included in this study of thymus development after transplantation.
Figure 1. T cell generation after thymus transplantation.

(A) The number of naïve CD4 and total CD3 T cells are shown in 7 subjects after transplantation. Subject ID numbers are included. The value of the last naïve CD4 data point of DIG410 (*, not shown) was 1836/mm3 at 9 months after transplantation. The value of the first CD3 data point of DIG413 (*, not shown) was 7264/mm3 at 21 days before transplantation. (B) Representative dot plots of CD4 T cells co-expressing CD62L and CD45RA in one of 7 subjects (DIG413) at 12 days before transplantation, day 70 (the day of biopsy), and 385 days after transplantation. The percentages of CD62L+CD45RA+ cells in the upper right quadrant are included in each panel. (C) CDR3 spectratyping profiles of CD4 T cells isolated from subjects DIG410 and DIG412 at 330 days and 388 days post thymus transplantation. (D) CD4 TCRBV repertoires were evaluated after transplantation by flow cytometry in 7 subjects. The time points post transplantation for the assays were 1476 days for DIG012, 749 days for DIG024, 379 days for DIG309, 466 days for DIG409, 783 days for DIG410, 388 days for DIG412, and 385 days for DIG413. The symbols for the thymus transplant recipients are the same as in Panel A. The two solid grey lines indicate the normal adult range (3 standard deviations (SD) above and below the mean).
CK14 and Aire mRNA expression in freshly harvested thymic tissues, cultured thymic tissues and biopsy specimens
CK14 and Aire are expressed predominantly by medullary TEC [12, 15]. We used real-time PCR to assess the expression of CK14 and Aire mRNA expression in 5 freshly harvested donor thymic tissues (Fig. 2A) and 9 cultured thymic tissues (Fig. 2B). The RNA expression in all samples was expressed relative to that of a single reference fresh thymus RNA control sample that was used in all experiments. Both CK14 and Aire mRNAs were detected in all freshly harvested donor thymic tissues and all cultured thymic tissues. Aire mRNA levels were very low in 2 of the samples. This cultured tissue suggests that Aire expression drops in cultured thymus tissue. It is likely that the loss of thymocytes in the culture period makes the CK14 and Aire RNA levels proportionately higher than if thymocyte RNA was present. Thus in cultured tissues, the relative higher levels of CK14 RNA do not indicate that TECs were producing more CK14 mRNA. On the other hand, the low levels of Aire mRNA expression in cultured tissues suggests a decrease in expression with culture, especially in light of the loss of thymocyte RNA in these samples.
Figure 2. Real-time PCR analysis of Aire and CK14 mRNA expression in fresh donor thymuses, cultured thymic tissues and allograft biopsies after thymus transplantation.

(A) Aire and CK14 mRNA expression was evaluated in fresh harvest day donor thymuses. (B) The levels of Aire and CK14 mRNA expression were evaluated in samples of cultured donor thymic tissues from 9 infants, labeled 1 to 9. The tissue of sample 1 was cultured for 19 days; tissues of sample 2, 3, 4, 16 days; the tissue of sample 5, for 15 days; tissues of sample 6 to 9, for 14 days. The average length of culture was 15.3 days. (Sample 4 was transplanted into DIG409.) (C) Aire and CK14 mRNA expression in allograft biopsies was assessed by real-time PCR. Biopsies were obtained from DIG413 at 70 days after transplantation; from DIG412, at 66 days after transplantation; from DIG410, at 84 days after transplantation; from DIG409, at 84 days after transplantation; and from DIG309, at 75 days after transplantation. The insert has a Y axis of 0 to 0.25 to allow visualization of Aire expression in the DIG413 biopsy. The same freshly harvested thymus RNA was used as a reference control for all PCR assays. The level of expression of that sample was set as 1. Skeletal (SK) muscle RNA was a negative control. Error bars show the mean +/− standard deviation of the RNA samples which were run in duplicate.
We next assessed the level of CK14 and Aire RNA levels in biopsy tissues. Biopsy RNA was available from 5 cDGA subjects. (Two of the 7 cDGA subjects underwent biopsies prior to the initiation of RNA studies.) In all of the biopsies, CK14 mRNA was detected at levels lower than that in the control thymus tissue (Fig. 2C). Comparing Panel A with Panel C, we were surprised that the expression of CK14 mRNA in biopsy tissue was so easy to detect since the biopsy tissues contained variable proportions of muscle, fat and allograft thymus tissue. This suggests that there is relatively more CK14 expression in the epithelium of the biopsies than in fresh tissue. This speculation is supported by immunohistochemistry data which follows.
In contrast to the robust expression of CK14 RNA in biopsy samples, the average percentage of Aire mRNA expression was 2% in biopsies relative to expression of Aire mRNA in control thymus (Fig. 2C). The low Aire mRNA expression levels in biopsies replete with cortical thymocytes suggest that it takes time for medullary epithelial cells to develop or to express Aire in the allograft.
IHC of freshly harvested thymus
In freshly harvested thymus (Fig. 3A–H), cortex was identified by IHC with reactivity of CDR2 (Fig. 3C) but not CK14 (Fig. 3B) on TEC and by reactivity of CD1a (Fig. 3G) and Ki-67 (Fig. 3H) on thymocytes. Medullary areas were characterized by reactivity of CK14 and EpCAM (Fig. 3D) on TEC. The thymocytes in medullary areas did not express Ki-67 or CD1a. (CD1a+ dendritic cells are seen scattered in the medulla).
Figure 3. Cytokeratin and T cell detection in freshly harvested thymus by IHC.

Thymus tissue from the thymus donor of DIG413 is presented as a representative thymus tissue. The harvest day thymus tissue was reacted with antibodies to (A) AE1/AE3, (B) CK14, (C) CDR2, (D) EpCAM, (E) CK5, (F) CD3, (G) CD1a, and (H) Ki-67. Positive reactivity is seen as a brown color in thymus tissue. Hassall’s bodies are indicated by arrows in panel A; the length of the bar is 500 μm. The “M” and “C” in panel B indicate the medullary and cortical areas, respectively. The bar in the low power insert in panel A is 1 mm. All panels have the same magnification.
IHC of cultured thymus tissues
Cultured thymus tissues were evaluated by IHC staining. A representative cultured tissue is shown in Figure 4. TEC were identified by reactivity with a pan CK antibody (Fig. 4A). Only a small subset of CK+ TECs expressed CK14 (Fig. 4B). Numerous Hassall bodies were present (arrows in Fig. 4C). Only necrotic, nonviable T cells were identified (not shown). Thus, cultured thymus tissue had evidence of medullary areas because of the presence of Hassall bodies and CK14, however, expression of CK14 had decreased. Thus the relatively high CK14 RNA level in cultured tissue (Fig. 2B) likely reflects the depletion of thymocytes.
Figure 4. CK10+ Hassall’s bodies, CK14+ and pan-CK+ epithelium in cultured thymus tissue.
Cultured thymus tissue, prior to transplantation into DIG413 is shown. The IHC was performed on frozen sections of tissue after 21 days of culture. (A) pan-CK, (B) CK14 and (C) CK10 antibodies were reacted with the tissue. Multiple Hassall’s bodies are indicated by the arrows. Original magnification ×10. The bar in (C) is 100μm.
IHC of biopsy specimens
We compared the pattern of reactivity in the freshly harvested thymus and the cultured thymus to that of thymus allograft biopsy specimens in 7 tissues. A representative IHC evaluation of allograft biopsies is illustrated in Figure 5. As described in the Methods section, for each of the allograft biopsies, one to four biopsy sections were examined. All sections of the biopsy in Figure 5 resembled thymic cortex as the thymocytes were predominantly CD3+CD1a+Ki-67+ (Fig. 5F, G, H), a phenotype characteristic of cortical thymocytes. Consistent with the cortical appearance of the thymocytes, most of the TECs expressed CDR2 (Fig. 5C). The epithelial cells also reacted with Pan-CK (AE1/AE3) and CK5 antibodies (Fig. 5A and E) which are typically found in cortex and medulla. No Hassall bodies, characteristic of medullary areas, were detected by antibodies AE1/AE3, CK14, EpCAM, and CK5 (Fig. 5, panels A, B, D and E as compared to Fig. 3, panels A, B, D, and E).
Figure 5. Cytokeratin and T cell detection in allograft biopsies by IHC.

Thymus tissue in the biopsy of the allograft of subject DIG413 was evaluated. The biopsy tissues were reacted with antibody to (A) AE1/AE3, (B) CK14, (C) CDR2, (D) EpCAM, (E) CK5, (F) CD3, (G) CD1a, and (H) Ki-67. An area showing early medullary development is circled in panels D and H. Positive reactivity is seen as a brown color in thymus tissue. The magnification and bar sizes are the same as in Figure 3.
Surprisingly, almost all TECs throughout the biopsy expressed CK14 which is characteristic of medullary TEC (Fig. 5B). Only one area in the biopsy (included in Figure 5 and indicated by the circle) had thymocytes that were Ki67−. Some of those thymocytes were CD1a−, characteristic of medullary thymocytes. A few epithelial cells stained with the medullary marker, EpCAM (Fig. 5D). This area, in contrast to normal medulla, contained some CD1a+ thymocytes. It also contained CDR2+ epithelium which is normally restricted to cortex.
In 5 subjects studied, the appearance of the biopsy was different from that of the freshly harvested tissue and the cultured tissue. Both the freshly harvested tissue (arrows in Fig. 3A) and the cultured tissue (arrows in Fig. 4C) had Hassall bodies. The biopsy tissues did not have Hassall bodies (Fig. 5A). CK14 expression in the freshly harvested tissue was limited to medulla and with scattered positive cells in cortex (Fig. 3B). The CK14 expression in cultured tissue (Fig. 4B) was much less than the pan CK expression (Fig. 4A) as assessed by measuring the surface area of the serial tissue sections that were reacted with the antibodies CK14 and pan CK. The mean ratio of the area reactive with CK14 to the area reactive with pan CK was 0.21 (standard deviation 0.12) for the 5 tissues studies. The 5 biopsies, which appeared to be essentially all cortex (Fig. 5), expressed CK14 throughout (Fig. 5B), a finding dramatically different from the findings in the freshly harvested tissue (Fig. 3B) and the cultured tissue (Fig. 4B) in which CK14 is not expressed in the cortex. We postulate that the TECs expressing CK14 in the cultured tissue might include precursor epithelial cells that, once placed in the recipient, proliferate and differentiate into the CK14+ TEC found in the biopsy.
We tested for the presence of proliferating epithelial cells in the biopsies using 2 and 3-color immunohistochemistry with antibodies for cytokeratin, CD3 and the Ki-67 nuclear proliferation marker. The staining patterns suggested that rare proliferating epithelial cells were present, however, it was not possible to unequivocally exclude the possibility that a cortical (Ki-67+) thymocyte was located precisely over the nucleus of the putative proliferating epithelial cell resulting in a false positive interpretation (data not shown). Unfortunately the biopsies are too small to allow us to tease apart the cells from the fresh tissue and examine them individually for the presence of Ki-67.
Development of medullary areas in allografts
In the DIG413 biopsy, there was one small area (circle) that had features of both medulla and cortex. The faint expression of EpCAM (Fig. 5D, circle) suggested that this area was beginning to form medulla. The small area showed two characteristics of medulla. First, this area had a few EpCAM+ TECs (Fig. 5D, circle) and secondly, the thymocytes did not express Ki-67 (Fig. 5H, circle). This small area also had two characteristics of cortex. First, CDR2 continued to be expressed on TEC (Fig. 5C) and secondly, most thymocytes expressed CD1a (Fig. 5G). Although there was not a mature medulla, the presence of epithelia expressing EpCAM and the lack of Ki-67 expression on thymocytes suggested that a medulla was forming.
We did not expect a small, immature medulla to express much Aire RNA. Our real time PCR studies showed very low, but detectable, Aire mRNA expression in 5 biopsies (the DIG413 biopsy was shown in Fig. 2C insert). This RNA finding is what we would have predicted from the IHC appearance of the tissue which did not have Hassall bodies or mature EpCAM+ medullary TECs (Fig. 5).
Normal CK14+ TEC and medulla with Hassall bodies in two previous biopsies
We had previously published four biopsies containing medullas with Hassall bodies [2, 30, 39, 40]. Frozen sections from two of these biopsies were available for analysis with the antibodies used in this paper. In these two biopsies (Fig. 6), cortical areas were identified by reactivity of cortical thymocytes with Ki-67 (Fig. 6, right panels) and CD1a (not shown). Medullary areas were identified by the absence of these thymocyte markers and the presence of CK10+ Hassall bodies (Fig 6, left panels). We found that CK14+ TECs were restricted to the medullary areas (middle panels, Fig. 6). The CK14+ TECs were not proliferating based on the absence of Ki-67 expression. Comparing these two biopsies with the biopsy in Figure 5 suggests that the small, immature medulla, with time, could develop into a mature medulla as seen in the two biopsies in Figure 6. These findings support our model that there may be epithelial progenitor cells in the cultured thymus that are able later to reconstitute all areas of the thymus.
Figure 6. CK14+ TECs are restricted to medullary areas in allograft biopsies displaying corticomedullary distinction.

Thymus allograft biopsies were evaluated in subject DIG024 (top panel) obtained 91 days after transplantation and DIG012 (bottom panel) obtained 218 days after transplantation. The biopsy tissues were reacted with antibody to CK10 (left panel), CK14 (middle panel), and Ki-67 (right panel). Positive reactivity is seen as a brown color in thymus tissue. The bar is 100 μm.
Foxn1 and CK14 co-expression in freshly harvested human thymus tissue and CK14+ allograft biopsies
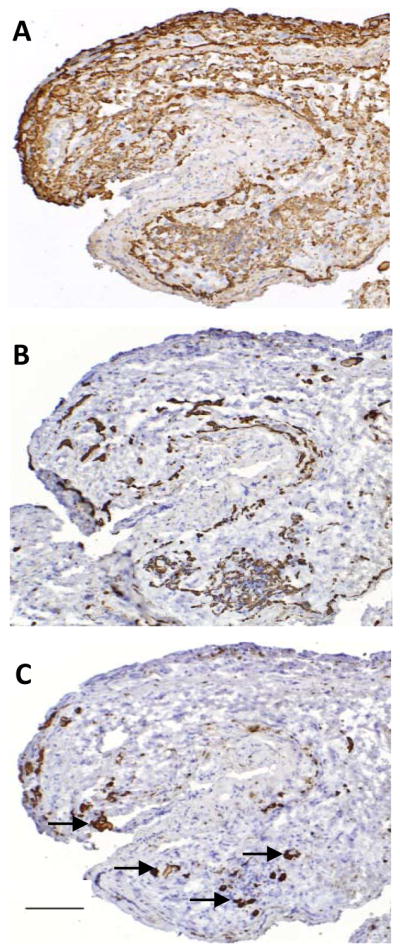
Because Foxn1 is required for the differentiation of murine TEC subtypes [41], we hypothesized that Foxn1 would be expressed in fresh postnatal donor thymus tissue and in thymus CK14+ allograft biopsies from recipients of thymus transplantation. We reacted donor thymus tissue and allograft biopsy tissue from DIG410 in two-color IHC with Foxn1 and CK14 antibodies (Fig. 7). In the biopsy sections, there were no Hassall bodies and all thymocytes expressed cortical markers (CD1a, Ki-67) (not shown) similar to the findings in Figure 5 (Panels A, B, E, G, and H). One area of biopsy reacted with EpCAM (Fig. 7A) suggesting that this area was developing into medulla. Foxn1 was found to be expressed in epithelial cells throughout the allograft biopsy (Fig. 7 Panels A and B). Double staining of Foxn1 and CK14 showed that a majority of Foxn1 was expressed in nuclei of CK14+ TECs in the biopsy (Fig. 7, Panels B and C). Foxn1 was also found in nuclei of the freshly harvested thymus donor medullary thymic epithelium (Figs. 7D, E, and F). Foxn1 co-localized with EpCAM (Fig. 7D) and CK14 (Fig. 7E and F). Foxn1 was also identified in cortical epithelium of freshly harvested thymus, see EpCAM− CK14− cortical TEC (Fig. 7D and E). Four additional biopsies were evaluated for Foxn1 expression by IHC and all four demonstrated Foxn1 expression. Thus, Foxn1 expression was associated with allograft development.
Figure 7. Foxn1 and CK14 protein expression in freshly harvested thymus and the thymus allograft biopsy from DIG410.

Biopsy sections are shown in the top panels; freshly harvested thymus sections are in the lower panels. The biopsy of allograft in subject DIG410 was obtained 84 days after transplantation. The tissue was reacted in panels A, B, D, and E with EpCAM (red), and in panels C and F with CK14 (red) and Foxn1 (brown) in two-color double staining IHC. Panels B and E are high power views of panels A and D respectively. Arrows in panels B and E show Foxn1+EpCAM+ TECs. Arrows in panels C and F show Foxn1+CK14+ TECs. The bar is 100 μm in panel D and 50 μm in panel F.
Freshly harvested donor thymus tissue, cultured donor thymus tissue, and CK5+CK14+ biopsy specimens from 5 donors and 5 transplant recipients, including DIG410 (shown in Fig. 7), were selected for measurement of Foxn1 mRNA levels. Negative controls included RNA from CK5−CK14− biopsy specimens (available for 4 subjects), thymocyte RNA, and human skeletal muscle RNA. As shown in Figure 8, Foxn1 mRNA expression was found in all freshly harvested donor thymus tissues (column 1 in each panel). The same control thymus RNA sample (column 7) was run in each experiment to allow for comparison among samples. The average Foxn1 expression in freshly harvested tissues was 72 percent of the control thymus RNA sample. Foxn1 levels significantly declined in the cultured thymus tissues after 15 to 20 days of culture. In Figure 8, the comparison of all 5 values for fresh donor tissue (column 1) to the 5 values in cultured tissue (column 2) yielded p = 0.0117. The average Foxn1 expression in CK+ biopsies was 1.15 fold higher than that of the control thymus RNA sample. These results suggest that Foxn1 RNA expression decreased with time in culture and was re-expressed in the allograft.
Figure 8. Real-time PCR detection of Foxn1 RNA in thymus tissue specimens of 5 transplant recipients.

In each panel the RNAs displayed were obtained from: 1) donor thymus on the day of harvest, 2) donor thymus after culture on the day of transplantation, 3) a biopsy specimen that also contained CK14 and CK5 RNA, 4) biopsy specimens that had no CK14 nor CK5 RNA (thus, this sample was muscle and fat from the surgical site without evidence of allograft), 5) commercial human skeletal muscle RNA, 6) thymocytes, and 7) a fresh thymus control sample. The same fresh thymus control RNA was run in every experiment to allow for comparisons between samples. The control thymus Foxn1 RNA level was set to 1. All RNA levels were normalized to 18S RNA and GAPDH. The “*” in the DIG412 panel indicated that CK-negative allograft biopsy material was not available for testing.
Since RNA levels do not always correlate with protein expression, we used IHC to assess the expression of Foxn1 expression in the freshly harvested thymus tissues, the cultured thymus tissues, and the biopsy tissues (Fig. 9). The 3 thymus tissues used in Figure 8, panel “DIG410”, donor tissue, cultured donor tissue, and biopsy (column 1, 2, 3, respectively) were reacted in IHC with Foxn1 antibody. Foxn1 was detected in nuclei of TEC in intact thymus (Fig. 9A). Only faint Foxn1 staining was seen in cultured tissue (Fig. 9B). There was strong staining of Foxn1 in the biopsy (Fig. 9C) which appeared to be predominantly cortex based on the phenotype of the thymocytes. These representative data show that Foxn1 is strongly expressed in freshly harvested human thymus tissue, is expressed at low levels in cultured thymus tissue, and is re-expressed in cultured allografts after transplantation. The Foxn1 protein staining (Fig. 9) was consistent with the real-time PCR data (Fig. 8). Thus, Foxn1 expression is found in biopsy TEC at higher levels than in cultured TEC, suggesting a possible role for Foxn1 in allograft development.
Figure 9. Foxn1 protein detection by IHC.

Foxn1 antibody was reacted with formalin-fixed paraffin-embedded tissue from A) freshly harvested thymus on day of harvest from a 9-day infant (later transplanted into DIG410), B) the 20-day cultured thymus which was later implanted into DIG410, and C) the biopsy from DIG410 obtained 82 days after transplantation. These three samples were sections of the tissues used for RNA preparation for Figure 8, Panel DIG410Bx, column 1, 2 and 3, respectively. Bar in main panel, 50 μm, insert bar, 200 μm.
Pax1, Pax9, and Eya1 expression in intact and cultured thymus and in allograft biopsy tissues
Murine studies have shown that the transcription factors Pax1, Pax9 and Eya1 are critical during early stages of thymus development [42]. We hypothesized that those factors might be expressed by human thymus and in the thymus allograft biopsies. We assessed the expression of Pax1, Pax9 and Eya1 in donor thymuses and biopsy specimens. Figure 10 shows that Pax1, Pax9 and Eya1 mRNAs are expressed in freshly harvested thymus tissue, cultured thymus tissue, and in thymus allograft biopsy tissue in 3 subjects. The mRNA expression of Pax1, Pax9, and Eya1 was very low in CK− biopsies, skeletal muscle, and thymocytes indicating that their presence in CK+ biopsy specimens was specific to thymus tissue in the allograft biopsies. Although present in the biopsy tissues, these RNAs did not show a consistent pattern (higher or lower) when compared to the cultured tissue or freshly harvested tissue. Thus, the importance of these RNAs in the allograft development is not known.
Figure 10. Pax1, Pax9, and Eya1 RNA expression in freshly harvested thymus and biopsies from allograft recipients.

For 3 subjects, RNAs from freshly harvested donor thymus, cultured donor thymus, a CK14+CK5+ positive biopsy sample, and a CK14−CK5− biopsy sample were evaluated by real-time PCR. In each panel the freshly harvested and cultured thymus was the thymus used in transplantation for the subject identified to the right of the panel. The same skeletal muscle, thymocyte, and thymus tissue control RNAs were included as in Figure 2 and 8. In each panel, the control thymus RNA expression is set at 1.0. Abbreviation: bx; biopsy.
Discussion
The data presented in this report are consistent with the hypothesis that suggest that thymic epithelial progenitors in postnatal cultured thymus tissue are responsible for development of functioning allograft after thymus transplantation in infants with complete DiGeorge anomaly. Five biopsies were the focus of research involving immunohistochemistry and real time PCR. Two biopsies collected prior to the initiation of this study were also evaluated by immunohistochemistry. The striking findings in the five recent biopsies evaluated in this research included the following: 1) most of the allograft epithelium expressed both cortical (CDR2) and medullary (CK14) markers, an epithelial phenotype not found in normal human postnatal thymus, 2) no Hassall bodies were identified in the biopsies despite the presence of Hassall bodies in all of the cultured tissues used for transplantation, and 3) areas of epithelium reactive with the medullary epithelial marker EpCAM1 were very small. To gain insight into how the allograft develops from the cultured thymus tissue after implantation into the recipient, we contrasted allograft biopsy findings with murine thymic epithelial progenitors, murine fetal thymus development, human fetal thymus development and human postnatal thymus reconstitution.
In five biopsies, CDR2+CK14+ epithelial cells were associated with thymocytes expressing cortical markers (Figure 5). CDR2+CK14+ double positive epithelial cells normally are not found in postnatal human thymus. CDR2 is normally expressed by cortical TEC and CK14 is normally expressed by medullary TEC. Similar to the TEC in our biopsies, TEC in murine embryonic day 12 thymus also express both cortical and medullary markers. [43] At this embryonic stage, all cytokeratin positive cells express both CK5 (a medullary TEC marker) and CK8 (a cortically TEC marker). These CK5+ CK8+ positive cells have the capacity to form both cortical and medullary epithelium.[43] The CDR2+CK14+ TEC in our biopsies may also have the capacity to form both cortical and medullary epithelia. As reviewed by Zhang et al[44], studies of mouse epithelial progenitor cells suggest that monoclonal antibodies MTS20 and/or MTS24 react with a population of cells that includes epithelial precursors [45–48] but equivalent antibodies are not available for human tissue.
We examined all previous biopsies from infants with complete DiGeorge anomaly to determine if those biopsies shared the phenotype of CK14+ epithelium associated with Ki-67+, CD1a+ “cortical” thymocytes. We identified an additional 12 biopsies that did not have mature cortex and medulla but did have thymocytes expressing Ki-67 and, in 11 of 12 cases, CD1a. In all 12 of these biopsies, CK14 was expressed by the epithelium (data not shown). These findings argue for the generalizability of our data from the initial 5 patients. Lastly the finding of widespread expression of CK14 protein expression in the biopsies is supported by the relatively high expression of CK14 RNA in the biopsies even though the biopsies contain muscle, fat and other cell types in addition to the allograft. This finding of CK14 RNA in the biopsies can be explained by the presence of CK14 throughout all epithelium in the biopsy whereas it is restricted to medullary areas in fresh thymus.
The expression of the medullary epithelial marker, CK14, but not EpCAM1, in the CDR2+CK14+ epithelium of the biopsies raised the question as to whether CK14 was a marker of epithelial progenitor cells. CK14 may be expressed in murine epithelial progenitor cells. In one report, Bleul et al [49] designed a CK14 promoter in a Cre/lox system so that enhanced yellow fluorescent protein would be expressed in a small fraction (<1%) of CK14 positive thymic epithelial cells.[49] By day 14 of life in double transgenic mice, small islands of yellow TECs were identified that were either cortical in phenotype or medullary in phenotype or both. This finding suggests that bi- and uni-potent progenitor cells exist in the thymus for development of cortical and medullary epithelial cells and that CK14 is expressed in these cells. It is possible that the population of CK14+ cells in the cultured thymus used for transplantation in our subjects may develop into CK14+CDR2+ epithelial cells found in the biopsies.
Two biopsies contained a very small area of EpCAM+ epithelium surrounded by CK14+CDR2+ epithelium (Fig. 5, panel D). The EpCAM+ epithelium was associated with thymocytes that had lost expression of Ki-67 (Figure 5H). A likely explanation for why the EpCAM+ area was so small is found in a report by Hikosaka et al. [50] Hikosaka et al. demonstrated that positively selected single positive (CD4+ or CD8+) thymocytes were necessary for expansion of medullary areas in murine thymus. The mechanism for this effect was shown to be the expression of RANK ligand (RANKL) by single positive (CD4+ or CD8+) thymocytes. RANKL binds RANK expressed by medullary TEC to expand medullary epithelial cellularity. [50] In the five biopsies without cortical medullary distinction, the thymocytes are likely double positive (CD4+CD8+) since they express Ki-67 and CD1a. (Cortical thymocytes are CD4+CD8+Ki67+CD1a+.) We believe that the EpCAM+ area of medullary epithelium as in Fig. 5 was small because there had been insufficient formation of single positive thymocytes at the time of the biopsy; there was insufficient stimulation of the medullary TEC by the single positive thymocytes to cause an increase in medullary epithelial cellularity.
The CDR2+CK14 + phenotype of epithelium in five biopsies is not found in any stages described in human fetal thymus ontogeny. The earliest stage of human fetal ontogeny described to date is the 7 week fetus.[51, 52] The epithelium at this embryonic stage expresses two medullary markers, A2B5 (GS1c ganglioside) [53] and TE4 (which colocalizes with E-cadherin) [51, 52, 54] but not the cortical epithelial marker TE3.[52] At 7 weeks of fetal life, no thymocytes are found in the thymus and there is no corticomedullary distinction. By 12 weeks gestation, the human fetal thymus contains thymocytes and has distinct cortical and medullary areas. [51, 52] The epithelial phenotypes in thymus cortex and medulla in the 12 week human fetus express different markers. These findings in the 12 week fetal human thymus are also found in the two biopsies shown in Figure 6.
All cultured thymus tissue contained Hassall bodies, but the 5 allograft biopsies without corticomedullary distinction had no detectable Hassall bodies. Thus, transplanted Hassall bodies are likely degraded after allograft implantation In human fetal life, Hassall bodies appear beginning at week 15.[51, 52] The appearance of Hassall bodies occurs in fetal life only after distinct cortical and medullary regions have developed. Similarly in biopsies without corticomedullary distinction, there are no Hassall bodies. As shown in two additional thymus biopsies (Fig. 6), with time, distinct cortical and medullary areas do form with Hassall bodies present in the medulla of the allografts. Although it is difficult to stage these different biopsy tissues as a definite developmental progression, these data suggest that the formation of the cortical and medullary areas represent transplanted precursor epithelial cells that have fully differentiated into cortex and medulla.
It is possible that only the precursor epithelial cells in the cultured thymus tissue survive after transplantation. These precursors may expand over the matrix formed by the transplanted slices of tissue. An alternative explanation is that many of the epithelial cells in the cultured thymus can dedifferentiate into CDR2+CK14+ epithelium. These cells, with stimulation from thymocytes, may then redifferentiate into separate cortical and medullary areas.
Work in the mouse by Popa et al [55] supports the first hypothesis that only precursor epithelial cells survive after thymus transplantation. The model used by Popa et al [55] involves regeneration of mouse thymus that has been depleted of thymocytes by irradiation or steroid therapy. These investigators focused on the rare CK5+CK8+ epithelial cells normally found at the cortical medullary junction in murine thymus. (CK5 is a medullary epithelial marker and CK8 is a cortical epithelial marker.) With stress, the numbers of cells with this phenotype increased 20- to 30-fold over 72 hours. These CK5+CK8+ cells were found predominantly in the cortex and subcapsular cortex presumably having proliferated and migrated to these locations. The finding of CK5+ cells reacting with Ki-67 demonstrated that epithelial cells were dividing. Thus, the work of Popa et al [55] shows that mature thymus with stress can lead to expansion of double positive epithelial cells over 72 hours. The CK5+CK8+ epithelial cells are thought to be progenitors that develop into distinct cortical and medullary areas. Our cultured tissue system is quite different from the murine studies of Popa since our thymus tissue is cultured for 2 to 3 weeks in vitro without any stem cells migrating to the tissue to form thymocytes. The difference in the length of the stress and thymocyte depletion may be the reason that we do not see proliferating epithelial cells in the cultured tissue nor in the biopsies.
We didn’t expect to see Aire expression in allograft biopsies that did not contain mature medullary areas. Unexpectedly we found low levels of Aire RNA expression in these biopsies. The murine studies of Hikosaka et al [50], mentioned above, gave us a clue as to the possible reason for our detecting Aire RNA in tissue that did not contain mature medullary areas. The biopsies in our patients did not contain thymocytes with the phenotype of single positive thymocytes (CD1a−Ki67−); most were CD1a+Ki67+, the phenotype of double positive thymocytes. The medullary areas likely could not expand due to lack of single positive thymocytes as describe by Hikosaka et al. [50] However, the few medullary epithelial cells present do express Aire. Similar low levels of Aire were found by Cavadini P et al [56] in studies of thymuses of 3 patients with Omenn syndrome or severe combined immunodeficiency (SCID). The patients studied had mutations in Recombinase activing gene (RAG) genes. In all 3 cases the thymus tissue studied was found to be lymphocyte depleted, lacking in cortical medullary distinction, and having low Aire expression. We expect that Aire levels will be higher in biopsy samples that include mature medullary areas such as the biopsies in Figure 6 but we did not obtain RNA from those biopsies.
Mutations in the Aire gene result in the disease autoimmune polyendocrinopathy enteropathy candidiasis ectodermal dystrophy (APECED).[57] Lack of Aire expression in patients with APECED leads to many autoimmune phenomena including hypoparathyroidism, adrenocortical failure, hypothyroidism, pernicious anemia, insulin dependent diabetes, gonadal failure, hepatitis, vitiligo, alopecia, dystrophy of dental enamel, nails and tympanic membranes.[58] Of 60 infants transplanted with thymus tissue, we have seen 14 cases of hypothyroidism, one of which also developed hypoparathyroidism, one case of alopecia, and one case of hepatitis.[59] These autoimmune manifestations may also appear in partial DiGeorge anomaly.[60] It is possible that low levels of Aire contribute to these problems.
Foxn1 distribution in human thymus tissues has not been investigated. Foxn1 has been shown to be important for differentiation of thymic epithelium as evidenced by the athymia and immune deficiency in nude mice, nude rats, and Foxn1 - deficient humans who have mutations of Foxn1 gene. [18, 61], [62] In mice, Foxn1 is expressed by EpCAMhigh medullary TEC [27]. We identified Foxn1 in both cortex and medulla of freshly harvested postnatal human thymus tissue by IHC (Fig. 7D, E, F). Foxn1 expression was identified in CK14+ TEC throughout biopsy tissues from cDGA patients after thymus transplantation (Fig. 7A, B, C). Our data showing Foxn1 in the biopsies is consistent with the importance of this molecule.
The study of Foxn1 RNA expression (Fig. 8) showed similar or higher levels of Foxn1 RNA in 4 of 5 biopsies compared with RNA levels in normal donor thymus tissues. This relatively high Foxn1 expression in the biopsies was remarkable because TECs account for a variable proportion of each biopsy specimen based on IHC. The presence and levels of Foxn1 RNA in the biopsies suggest that Foxn1 expression by TEC in the allograft is up-regulated after the cultured tissue is implanted and the thymus epithelium begins to interact with circulating stem cells. The expression of Foxn1 and CK14 throughout biopsy thymus tissues by IHC (Fig. 7A, B, C) was consistent with our findings of CK14 and Foxn1 RNA in biopsy tissues by real time PCR. Since Foxn1 RNA and protein expression is low in cultured thymus tissue, Foxn1 is probably not a marker of TEC precursors.
We report here for the first time that Pax1, Pax9, and Eya1 are expressed in human postnatal thymus tissue. Pax1 and Pax9 have been reported to be expressed by murine TEC and are required during T cell development in embryonic thymus [24, 26, 63]; Eya1 has been shown to be necessary for normal thymus organogenesis in study of _Eya1_-null mice [25]. These three genes have been reported to be expressed earlier than Foxn1 in murine thymus and thus should not be affected by Foxn1 expression [42]. We found that Pax1, Pax9, and Eya1 RNAs were expressed in human donor postnatal thymus, thymus tissue after culture, and allograft biopsies. The presence of these RNAs in cultured thymus tissue suggests that these molecules are not _Foxn1_-dependent since Foxn1 levels are very low in cultured thymus tissues. Pax1, Pax9 and Eya1 appeared to be specifically expressed by TEC since their RNAs were found only at very low levels in CK5−CK14− biopsies, skeletal muscle, and thymocyte RNA samples. Additional studies will be required to determine the role of these genes in thymus allograft development.
One additional question that we posed was whether the appearance of the biopsy could predict final T cell numbers. In the murine system, Jenkinson et al [64] has shown that the number of thymic epithelial progenitors strongly affects double negative thymocyte numbers in the embryo but has only a weak influence on the double positive thymocyte numbers in the adult. If the double positive thymocyte numbers are not affected by the number of thymic epithelial progenitors, it is hard to imagine that the number of circulating naïve T cells after thymus transplantation could be predicted by the number of epithelial progenitor cells transferred. For the 7 subjects in this study, naïve CD4 T cells were first detected in peripheral blood 3–7 months after transplantation, 1–4 months after 6 of the biopsies were obtained in this study. We showed that the time course of naïve CD4 T cell development in DIG012 and DIG024 (Fig. 1A) who had fully developed medullary areas with mature Hassall’s bodies (Fig. 6) was similar to the time course of naïve T cell development in the other 5 subjects who had thymus biopsies containing CK14+CDR2+ epithelium. We cannot explain why naïve T cells did not develop earlier in DIG024 than in the 4 subjects biopsied at 2 months who did not have mature cortical and medullary areas. Note, the biopsy in DIG012 was obtained at 7 months so it is possible that at 2 months after transplantation, the allograft had not yet developed corticomedullary distinction.
It is possible that there were sampling artifacts in this study. For example, some allograft biopsy tissues in the 5 subjects with only CK14+CDR2+ cortical areas may have had a normal cortical epithelial phenotype (CK14−CDR2+) in other sections but these areas simply were not sampled [5]. It is possible that sampling artifact is responsible for the early medullary area (Fig. 5) having CK14+CDR2+ epithelium. However, the presence in allograft biopsies of CK14+ CDR2+ TEC, a phenotype not found in normal thymus, is strongly supported by the multiple biopsies evaluated in this report.
In summary, our data are consistent with a model in which some thymic epithelial cells, possibly expressing CK14, in the cultured thymus develop into CK14+CDR2+ epithelial cells that act as thymic epithelial progenitors for the reconstitution of the thymus allograft after transplantation. The high levels of Foxn1 in the allografts likely reflect the important role of Foxn1 in reconstitution of the thymus after transplantation.
Research Highlights
- Thymic allograft biopsies were evaluated after thymus transplantation.
- Thymic epithelial cells unexpectedly express both cortical and medullary markers.
- Thymic tissue may regenerate from precursor epithelial cells.
- Foxn1 is highly expressed in thymus epithelial cells in the allograft biopsies.
Acknowledgments
We thank Drs. Bruno Kyewski (German Cancer Research Center, Heidelberg, Germany), and Motonari Kondo, and Laura P. Hale (Duke University Medical Center) for their critical reviews of this manuscript, and Donna Niedzwiecki for statistical assistance. We thank Chia-San Hsieh, Julie Smith, Marilyn Alexieff and Jennifer Lonon for assistance with flow cytometry. We acknowledge assistance of the Duke Comprehensive Cancer Center (CCC) flow cytometry facility. This work was supported by NIH grant RO1 AI 47040 and grant FD-R-002606 from the FDA Office of Orphan Product Development. MLM is member of Duke Comprehensive Cancer Center.
Footnotes
Publisher's Disclaimer: This is a PDF file of an unedited manuscript that has been accepted for publication. As a service to our customers we are providing this early version of the manuscript. The manuscript will undergo copyediting, typesetting, and review of the resulting proof before it is published in its final citable form. Please note that during the production process errors may be discovered which could affect the content, and all legal disclaimers that apply to the journal pertain.
References
- 1.Hong R. The DiGeorge anomaly. Immunodefic Rev. 1991;3:1–14. [PubMed] [Google Scholar]
- 2.Markert ML, Boeck A, Hale LP, Kloster AL, McLaughlin TM, Batchvarova MN, Douek DC, Koup RA, Kostyu DD, Ward FE, Rice HE, Mahaffey SM, Schiff SE, Buckley RH, Haynes BF. Transplantation of thymus tissue in complete DiGeorge syndrome. N Engl J Med. 1999;341:1180–1189. doi: 10.1056/NEJM199910143411603. [DOI] [PubMed] [Google Scholar]
- 3.Markert ML, Devlin BH, Alexieff MJ, Li J, McCarthy EA, Gupton SE, Chinn IK, Hale LP, Kepler TB, He M, Sarzotti M, Skinner MA, Rice HE, Hoehner JC. Review of 54 patients with complete DiGeorge anomaly enrolled in protocols for thymus transplantation: outcome of 44 consecutive transplants. Blood. 2007;109:4539–4547. doi: 10.1182/blood-2006-10-048652. [DOI] [PMC free article] [PubMed] [Google Scholar]
- 4.Markert ML, Kostyu DD, Ward FE, McLaughlin TM, Watson TJ, Buckley RH, Schiff SE, Ungerleider RM, Gaynor JW, Oldham KT, Mahaffey SM, Ballow M, Driscoll DA, Hale LP, Haynes BF. Successful formation of a chimeric human thymus allograft following transplantation of cultured postnatal human thymus. J Immunol. 1997;158:998–1005. [PubMed] [Google Scholar]
- 5.Markert ML, Li J, Devlin BH, Hoehner JC, Rice HE, Skinner MA, Li YJ, Hale LP. Use of allograft biopsies to assess thymopoiesis after thymus transplantation. J Immunol. 2008;180:6354–6364. doi: 10.4049/jimmunol.180.9.6354. [DOI] [PubMed] [Google Scholar]
- 6.Sprent J, Surh CD. Knowing one’s self: central tolerance revisited. Nat Immunol. 2003;4:303–304. doi: 10.1038/ni0403-303. [DOI] [PubMed] [Google Scholar]
- 7.Zinkernagel RM, Althage A, Waterfield E, Kindred B, Welsh RM, Callahan G, Pincetl P. Restriction specificities, alloreactivity, and allotolerance expressed by T cells from nude mice reconstituted with H-2-compatible or -incompatible thymus grafts. J Exp Med. 1980;151:376–399. doi: 10.1084/jem.151.2.376. [DOI] [PMC free article] [PubMed] [Google Scholar]
- 8.Goldrath AW, Bevan MJ. Selecting and maintaining a diverse T-cell repertoire. Nature. 1999;402:255–262. doi: 10.1038/46218. [DOI] [PubMed] [Google Scholar]
- 9.Starr TK, Jameson SC, Hogquist KA. Positive and negative selection of T cells. Annu Rev Immunol. 2003;21:139–176. doi: 10.1146/annurev.immunol.21.120601.141107. [DOI] [PubMed] [Google Scholar]
- 10.Manley NR. Thymus organogenesis and molecular mechanisms of thymic epithelial cell differentiation. Semin Immunol. 2000;12:421–428. doi: 10.1006/smim.2000.0263. [DOI] [PubMed] [Google Scholar]
- 11.Rodewald HR, Kretzschmar K, Swat W, Takeda S. Intrathymically expressed c-kit ligand (stem cell factor) is a major factor driving expansion of very immature thymocytes in vivo. Immunity. 1995;3:313–319. doi: 10.1016/1074-7613(95)90116-7. [DOI] [PubMed] [Google Scholar]
- 12.Kuo T. Cytokeratin profiles of the thymus and thymomas: histogenetic correlations and proposal for a histological classification of thymomas. Histopathology. 2000;36:403–414. doi: 10.1046/j.1365-2559.2000.00846.x. [DOI] [PubMed] [Google Scholar]
- 13.Gotter J, Brors B, Hergenhahn M, Kyewski B. Medullary epithelial cells of the human thymus express a highly diverse selection of tissue-specific genes colocalized in chromosomal clusters. J Exp Med. 2004;199:155–166. doi: 10.1084/jem.20031677. [DOI] [PMC free article] [PubMed] [Google Scholar]
- 14.Mathis D, Benoist C. Aire. Annu Rev Immunol. 2009;27:287–312. doi: 10.1146/annurev.immunol.25.022106.141532. [DOI] [PubMed] [Google Scholar]
- 15.Yano M, Kuroda N, Han H, Meguro-Horike M, Nishikawa Y, Kiyonari H, Maemura K, Yanagawa Y, Obata K, Takahashi S, Ikawa T, Satoh R, Kawamoto H, Mouri Y, Matsumoto M. Aire controls the differentiation program of thymic epithelial cells in the medulla for the establishment of self-tolerance. J Exp Med. 2008;205:2827–2838. doi: 10.1084/jem.20080046. [DOI] [PMC free article] [PubMed] [Google Scholar]
- 16.Blackburn CC, Manley NR, Palmer DB, Boyd RL, Anderson G, Ritter MA. One for all and all for one: thymic epithelial stem cells and regeneration. Trends Immunol. 2002;23:391–395. doi: 10.1016/s1471-4906(02)02265-2. [DOI] [PubMed] [Google Scholar]
- 17.Blackburn CC, Augustine CL, Li R, Harvey RP, Malin MA, Boyd RL, Miller JF, Morahan G. The nu gene acts cell-autonomously and is required for differentiation of thymic epithelial progenitors. Proc Natl Acad Sci U S A. 1996;93:5742–5746. doi: 10.1073/pnas.93.12.5742. [DOI] [PMC free article] [PubMed] [Google Scholar]
- 18.Nehls M, Kyewski B, Messerle M, Waldschutz R, Schuddekopf K, Smith AJ, Boehm T. Two genetically separable steps in the differentiation of thymic epithelium. Science. 1996;272:886–889. doi: 10.1126/science.272.5263.886. [DOI] [PubMed] [Google Scholar]
- 19.Chin RK, Lo JC, Kim O, Blink SE, Christiansen PA, Peterson P, Wang Y, Ware C, Fu YX. Lymphotoxin pathway directs thymic Aire expression. Nat Immunol. 2003;4:1121–1127. doi: 10.1038/ni982. [DOI] [PubMed] [Google Scholar]
- 20.Xiao S, Su DM, Manley NR. Atypical memory phenotype T cells with low homeostatic potential and impaired TCR signaling and regulatory T cell function in Foxn1Delta/Delta mutant mice. J Immunol. 2007;179:8153–8163. doi: 10.4049/jimmunol.179.12.8153. [DOI] [PubMed] [Google Scholar]
- 21.Itoi M, Tsukamoto N, Amagai T. Expression of Dll4 and CCL25 in Foxn1-negative epithelial cells in the post-natal thymus. Int Immunol. 2007;19:127–132. doi: 10.1093/intimm/dxl129. [DOI] [PubMed] [Google Scholar]
- 22.Coffer PJ, Burgering BM. Forkhead-box transcription factors and their role in the immune system. Nat Rev Immunol. 2004;4:889–899. doi: 10.1038/nri1488. [DOI] [PubMed] [Google Scholar]
- 23.Callan MF, Fazou C, Yang H, Rostron T, Poon K, Hatton C, McMichael AJ. CD8(+) T-cell selection, function, and death in the primary immune response in vivo. J Clin Invest. 2000;106:1251–1261. doi: 10.1172/JCI10590. [DOI] [PMC free article] [PubMed] [Google Scholar]
- 24.Hetzer-Egger C, Schorpp M, Haas-Assenbaum A, Balling R, Peters H, Boehm T. Thymopoiesis requires Pax9 function in thymic epithelial cells. Eur J Immunol. 2002;32:1175–1181. doi: 10.1002/1521-4141(200204)32:4<1175::AID-IMMU1175>3.0.CO;2-U. [DOI] [PubMed] [Google Scholar]
- 25.Xu PX, Zheng W, Laclef C, Maire P, Maas RL, Peters H, Xu X. Eya1 is required for the morphogenesis of mammalian thymus, parathyroid and thyroid. Development. 2002;129:3033–3044. doi: 10.1242/dev.129.13.3033. [DOI] [PMC free article] [PubMed] [Google Scholar]
- 26.Wallin J, Eibel H, Neubuser A, Wilting J, Koseki H, Balling R. Pax1 is expressed during development of the thymus epithelium and is required for normal T-cell maturation. Development. 1996;122:23–30. doi: 10.1242/dev.122.1.23. [DOI] [PubMed] [Google Scholar]
- 27.Gillard GO, Farr AG. Features of medullary thymic epithelium implicate postnatal development in maintaining epithelial heterogeneity and tissue-restricted antigen expression. J Immunol. 2006;176:5815–5824. doi: 10.4049/jimmunol.176.10.5815. [DOI] [PubMed] [Google Scholar]
- 28.Picker LJ, Treer JR, Ferguson-Darnell B, Collins PA, Buck D, Terstappen LW. Control of lymphocyte recirculation in man. I. Differential regulation of the peripheral lymph node homing receptor L-selectin on T cells during the virgin to memory cell transition. J Immunol. 1993;150:1105–1121. [PubMed] [Google Scholar]
- 29.Markert ML, Sarzotti M, Ozaki DA, Sempowski GD, Rhein ME, Hale LP, Le Deist F, Alexieff MJ, Li J, Hauser ER, Haynes BF, Rice HE, Skinner MA, Mahaffey SM, Jaggers J, Stein LD, Mill MR. Thymus transplantation in complete DiGeorge syndrome: immunologic and safety evaluations in 12 patients. Blood. 2003;102:1121–1130. doi: 10.1182/blood-2002-08-2545. [DOI] [PubMed] [Google Scholar]
- 30.Markert ML, Alexieff MJ, Li J, Sarzotti M, Ozaki DA, Devlin BH, Sedlak DA, Sempowski GD, Hale LP, Rice HE, Mahaffey SM, Skinner MA. Postnatal thymus transplantation with immunosuppression as treatment for DiGeorge syndrome. Blood. 2004;104:2574–2581. doi: 10.1182/blood-2003-08-2984. [DOI] [PubMed] [Google Scholar]
- 31.Hudson LL, Louise Markert M, Devlin BH, Haynes BF, Sempowski GD. Human T cell reconstitution in DiGeorge syndrome and HIV-1 infection. Semin Immunol. 2007;19:297–309. doi: 10.1016/j.smim.2007.10.002. [DOI] [PMC free article] [PubMed] [Google Scholar]
- 32.Davis CM, McLaughlin TM, Watson TJ, Buckley RH, Schiff SE, Hale LP, Haynes BF, Markert ML. Normalization of the peripheral blood T cell receptor V beta repertoire after cultured postnatal human thymic transplantation in DiGeorge syndrome. J Clin Immunol. 1997;17:167–175. doi: 10.1023/a:1027382600143. [DOI] [PubMed] [Google Scholar]
- 33.Hong R, Moore AL. Organ culture for thymus transplantation. Transplantation. 1996;61:444–448. doi: 10.1097/00007890-199602150-00023. [DOI] [PubMed] [Google Scholar]
- 34.Markert ML, Devlin BH, Chinn IK, McCarthy EA, Li YJ. Factors affecting success of thymus transplantation for complete DiGeorge anomaly. Am J Transplant. 2008;8:1729–1736. doi: 10.1111/j.1600-6143.2008.02301.x. [DOI] [PMC free article] [PubMed] [Google Scholar]
- 35.Rice HE, Skinner MA, Mahaffey SM, Oldham KT, Ing RJ, Hale LP, Markert ML. Thymic transplantation for complete DiGeorge syndrome: medical and surgical considerations. J Pediatr Surg. 2004;39:1607–1615. doi: 10.1016/j.jpedsurg.2004.07.020. [DOI] [PubMed] [Google Scholar]
- 36.Key G, Becker MH, Baron B, Duchrow M, Schluter C, Flad HD, Gerdes J. New Ki-67-equivalent murine monoclonal antibodies (MIB 1–3) generated against bacterially expressed parts of the Ki-67 cDNA containing three 62 base pair repetitive elements encoding for the Ki-67 epitope. Lab Invest. 1993;68:629–636. [PubMed] [Google Scholar]
- 37.Rouse RV, Bolin LM, Bender JR, Kyewski BA. Monoclonal antibodies reactive with subsets of mouse and human thymic epithelial cells. J Histochem Cytochem. 1988;36:1511–1517. doi: 10.1177/36.12.2461413. [DOI] [PubMed] [Google Scholar]
- 38.Markert ML, Devlin BH, McCarthy EA. Thymus transplantation. Clin Immunol. 2010 doi: 10.1016/j.clim.2010.02.007. in press. [DOI] [PMC free article] [PubMed] [Google Scholar]
- 39.Rice HE, Skinner MA, Mahaffey SM, Oldham KT, Ing RJ, Hale LP, Markert ML. Thymic transplantation for complete DiGeorge syndrome: medical and surgical considerations. J Pediatr Surg. 2004;39:1607–1615. doi: 10.1016/j.jpedsurg.2004.07.020. [DOI] [PubMed] [Google Scholar]
- 40.Markert ML, Li J, Devlin BH, Hoehner JC, Rice HE, Skinner MA, Li YJ, Hale LP. Use of allograft biopsies to assess thymopoiesis after thymus transplantation. J Immunol. 2008;180:6354–6364. doi: 10.4049/jimmunol.180.9.6354. [DOI] [PubMed] [Google Scholar]
- 41.Su DM, Navarre S, Oh WJ, Condie BG, Manley NR. A domain of Foxn1 required for crosstalk-dependent thymic epithelial cell differentiation. Nat Immunol. 2003;4:1128–1135. doi: 10.1038/ni983. [DOI] [PubMed] [Google Scholar]
- 42.Blackburn CC, Manley NR. Developing a new paradigm for thymus organogenesis. Nat Rev Immunol. 2004;4:278–289. doi: 10.1038/nri1331. [DOI] [PubMed] [Google Scholar]
- 43.Rossi SW, Jenkinson WE, Anderson G, Jenkinson EJ. Clonal analysis reveals a common progenitor for thymic cortical and medullary epithelium. Nature. 2006;441:988–991. doi: 10.1038/nature04813. [DOI] [PubMed] [Google Scholar]
- 44.Zhang L, Sun L, Zhao Y. Thymic epithelial progenitor cells and thymus regeneration: an update. Cell Res. 2007;17:50–55. doi: 10.1038/sj.cr.7310114. [DOI] [PubMed] [Google Scholar]
- 45.Rossi SW, Chidgey AP, Parnell SM, Jenkinson WE, Scott HS, Boyd RL, Jenkinson EJ, Anderson G. Redefining epithelial progenitor potential in the developing thymus. Eur J Immunol. 2007;37:2411–2418. doi: 10.1002/eji.200737275. [DOI] [PubMed] [Google Scholar]
- 46.Bennett AR, Farley A, Blair NF, Gordon J, Sharp L, Blackburn CC. Identification and characterization of thymic epithelial progenitor cells. Immunity. 2002;16:803–814. doi: 10.1016/s1074-7613(02)00321-7. [DOI] [PubMed] [Google Scholar]
- 47.Gill J, Malin M, Hollander GA, Boyd R. Generation of a complete thymic microenvironment by MTS24(+) thymic epithelial cells. Nat Immunol. 2002;3:635–642. doi: 10.1038/ni812. [DOI] [PubMed] [Google Scholar]
- 48.Nijhof JG, Braun KM, Giangreco A, van Pelt C, Kawamoto H, Boyd RL, Willemze R, Mullenders LH, Watt FM, de Gruijl FR, van Ewijk W. The cell-surface marker MTS24 identifies a novel population of follicular keratinocytes with characteristics of progenitor cells. Development (Cambridge, England) 2006;133:3027–3037. doi: 10.1242/dev.02443. [DOI] [PubMed] [Google Scholar]
- 49.Bleul CC, Corbeaux T, Reuter A, Fisch P, Monting JS, Boehm T. Formation of a functional thymus initiated by a postnatal epithelial progenitor cell. Nature. 2006;441:992–996. doi: 10.1038/nature04850. [DOI] [PubMed] [Google Scholar]
- 50.Hikosaka Y, Nitta T, Ohigashi I, Yano K, Ishimaru N, Hayashi Y, Matsumoto M, Matsuo K, Penninger JM, Takayanagi H, Yokota Y, Yamada H, Yoshikai Y, Inoue J, Akiyama T, Takahama Y. The cytokine RANKL produced by positively selected thymocytes fosters medullary thymic epithelial cells that express autoimmune regulator. Immunity. 2008;29:438–450. doi: 10.1016/j.immuni.2008.06.018. [DOI] [PubMed] [Google Scholar]
- 51.Haynes BF, Scearce RM, Lobach DF, Hensley LL. Phenotypic characterization and ontogeny of mesodermal-derived and endocrine epithelial components of the human thymic microenvironment. The Journal of experimental medicine. 1984;159:1149–1168. doi: 10.1084/jem.159.4.1149. [DOI] [PMC free article] [PubMed] [Google Scholar]
- 52.Lobach DF, Haynes BF. Ontogeny of the human thymus during fetal development. J Clin Immunol. 1987;7:81–97. doi: 10.1007/BF00916002. [DOI] [PubMed] [Google Scholar]
- 53.Saito M, Kitamura H, Sugiyama K. A novel heptasialosyl c-series ganglioside in embryonic chicken brain: its structure and stage-specific expression. Biochimica et biophysica acta. 2002;1571:18–26. doi: 10.1016/s0304-4165(02)00201-5. [DOI] [PubMed] [Google Scholar]
- 54.Haynes BF, Shimizu K, Eisenbarth GS. Identification of human and rodent thymic epithelium using tetanus toxin and monoclonal antibody A2B5. The Journal of clinical investigation. 1983;71:9–14. doi: 10.1172/JCI110755. [DOI] [PMC free article] [PubMed] [Google Scholar]
- 55.Popa I, Zubkova I, Medvedovic M, Romantseva T, Mostowski H, Boyd R, Zaitseva M. Regeneration of the adult thymus is preceded by the expansion of K5+K8+ epithelial cell progenitors and by increased expression of Trp63, cMyc and Tcf3 transcription factors in the thymic stroma. Int Immunol. 2007;19:1249–1260. doi: 10.1093/intimm/dxm092. [DOI] [PubMed] [Google Scholar]
- 56.Cavadini P, Vermi W, Facchetti F, Fontana S, Nagafuchi S, Mazzolari E, Sediva A, Marrella V, Villa A, Fischer A, Notarangelo LD, Badolato R. AIRE deficiency in thymus of 2 patients with Omenn syndrome. The Journal of clinical investigation. 2005;115:728–732. doi: 10.1172/JCI23087. [DOI] [PMC free article] [PubMed] [Google Scholar]
- 57.An autoimmune disease, APECED, caused by mutations in a novel gene featuring two PHD-type zinc-finger domains. Nature genetics. 1997;17:399–403. [Google Scholar]
- 58.Ahonen P, Myllarniemi S, Sipila I, Perheentupa J. Clinical variation of autoimmune polyendocrinopathy-candidiasis-ectodermal dystrophy (APECED) in a series of 68 patients. The New England journal of medicine. 1990;322:1829–1836. doi: 10.1056/NEJM199006283222601. [DOI] [PubMed] [Google Scholar]
- 59.Markert ML, Devlin BH, McCarthy EA. Thymus transplantation. Clinical immunology (Orlando, Fla) 135:236–246. doi: 10.1016/j.clim.2010.02.007. [DOI] [PMC free article] [PubMed] [Google Scholar]
- 60.McLean-Tooke A, Spickett GP, Gennery AR. Immunodeficiency and autoimmunity in 22q11.2 deletion syndrome. Scand J Immunol. 2007;66:1–7. doi: 10.1111/j.1365-3083.2007.01949.x. [DOI] [PubMed] [Google Scholar]
- 61.Nehls M, Pfeifer D, Schorpp M, Hedrich H, Boehm T. New member of the winged-helix protein family disrupted in mouse and rat nude mutations. Nature. 1994;372:103–107. doi: 10.1038/372103a0. [DOI] [PubMed] [Google Scholar]
- 62.Pignata C, Gaetaniello L, Masci AM, Frank J, Christiano A, Matrecano E, Racioppi L. Human equivalent of the mouse Nude/SCID phenotype: long-term evaluation of immunologic reconstitution after bone marrow transplantation. Blood. 2001;97:880–885. doi: 10.1182/blood.v97.4.880. [DOI] [PubMed] [Google Scholar]
- 63.Su DM, Manley NR. Hoxa3 and pax1 transcription factors regulate the ability of fetal thymic epithelial cells to promote thymocyte development. J Immunol. 2000;164:5753–5760. doi: 10.4049/jimmunol.164.11.5753. [DOI] [PubMed] [Google Scholar]
- 64.Jenkinson WE, Bacon A, White AJ, Anderson G, Jenkinson EJ. An epithelial progenitor pool regulates thymus growth. J Immunol. 2008;181:6101–6108. doi: 10.4049/jimmunol.181.9.6101. [DOI] [PubMed] [Google Scholar]