Precommitment low-level Neurog3 expression defines a long-lived mitotic endocrine-biased progenitor pool that drives production of endocrine-committed cells (original) (raw)
Bechard et al. show that a cell population defined as Neurog3 transcriptionally active and Sox9+ and often containing nonimmunodetectable Neurog3 protein has a relatively high mitotic index and prolonged epithelial residency. They propose that this endocrine-biased mitotic progenitor state is functionally separated from a pro-ductal pool and endows them with long-term capacity to make endocrine fate-directed progeny.
Keywords: Neurog3, progenitor, endocrine-biased, mitotic
Abstract
The current model for endocrine cell specification in the pancreas invokes high-level production of the transcription factor Neurogenin 3 (Neurog3) in Sox9+ bipotent epithelial cells as the trigger for endocrine commitment, cell cycle exit, and rapid delamination toward proto-islet clusters. This model posits a transient Neurog3 expression state and short epithelial residence period. We show, however, that a _Neurog3_TA.LO cell population, defined as Neurog3 transcriptionally active and Sox9+ and often containing nonimmunodetectable Neurog3 protein, has a relatively high mitotic index and prolonged epithelial residency. We propose that this endocrine-biased mitotic progenitor state is functionally separated from a pro-ductal pool and endows them with long-term capacity to make endocrine fate-directed progeny. A novel BAC transgenic Neurog3 reporter detected two types of mitotic behavior in Sox9+ _Neurog3_TA.LO progenitors, associated with progenitor pool maintenance or derivation of endocrine-committed Neurog3HI cells, respectively. Moreover, limiting Neurog3 expression dramatically increased the proportional representation of Sox9+ _Neurog3_TA.LO progenitors, with a doubling of its mitotic index relative to normal Neurog3 expression, suggesting that low Neurog3 expression is a defining feature of this cycling endocrine-biased state. We propose that Sox9+ _Neurog3_TA.LO endocrine-biased progenitors feed production of Neurog3HI endocrine-committed cells during pancreas organogenesis.
During mammalian organogenesis, lineage specification and commitment involve passage through distinct progenitor/precursor states that rely on different combinations and levels of transcription factors (Wilkinson et al. 2013; Cano et al. 2014). In the current model of pancreatic endocrine cell formation, Neurogenin3 (Neurog3) expression in the epithelium rapidly progresses to a high-level production of protein (Neurog3HI) that leads to endocrine fate commitment, cell cycle exit, and delamination toward proto-islet clusters. Meta-analysis of published literature (see below), however, is suggestive of a broader pattern of lower-level Neurog3 expression across the epithelium that is substantially more prevalent than the actively delaminating endocrine-committed Neurog3HI population. The present study is focused on determining whether this low-_Neurog3_-expressing subpopulation represents the early-phase expression in post-mitotic cells on their way to becoming Neurog3HI cells or endocrine fate-biased but uncommitted mitotic cells that have self-maintaining progenitor characteristics.
Pancreas organogenesis is divided into a primary transition and secondary transition (Pan and Wright 2011). During the primary transition (embryonic day 9.5 [E9.5] to E12.5), multipotent progenitor cells undergo apical polarization, forming microlumens that then coalesce to generate an epithelial plexus. Within this epithelial plexus, progenitor cells (around E12.5) segregate into “tip” and “trunk” domains. In the short-term, tip domains transiently retain their multipotency to form acinar, duct, and endocrine lineages before transitioning to a proacinar state. The trunk domain, a primary component of the epithelial plexus, consists of a pool of duct/endocrine bipotential Sox9+ Hnf1b+ Nkx6.1+ cells (Seymour et al. 2007; Solar et al. 2009). Recently, we reported that distinct modes of epithelial morphogenesis in the peripheral versus core regions of the developing pancreas work in concert to generate the final “epithelial tree” of the mature pancreas (Bankaitis et al. 2015). In the core, the epithelial plexus remodels into mature ductal tissues via growth and expansion (E12.5–E15.5) followed by plexus-to-duct transformation (E16.5–E18.5) (Bankaitis et al. 2015). Although the plexus is progressively lost, remodeling into “mature” ducts and ductal branches, it is present during all stages of the secondary transition. Even at late gestation, plexus-state epithelium generates as many endocrine cells as earlier in the secondary transition, suggesting that the plexus represents a primary endocrine progenitor niche (Bankaitis et al. 2015). Within the trunk plexus-state epithelium, the transcription factor Neurog3 is a key trigger factor for endocrine lineage commitment. Expressed in a subset of the Sox9+ duct/endocrine bipotent progenitors, high Neurog3 protein levels activate the expression of general proendocrine transcription factor genes (NeuroD1, Insm1A, and Isl1) followed by those for endocrine lineage-specific factors (Pax4, Nkx2.2, and Arx). _Neurog3_NULL mice show a vast deficiency in endocrine cell production and a near absence at birth (Gradwohl et al. 2000; Johansson et al. 2007). An inducible Neurog3 overexpression system showed an endoderm-autonomous competence for Neurog3HI cells to produce mostly α (glucagon-producing) cells in early pancreas organogenesis (E8.75–E12.5), with the ability to produce β cells (and other endocrine cells in lesser number) arising in the secondary transition (Johansson et al. 2007). A large-scale clonal analysis demonstrated that the majority of Neurog3HI cells each represents a unipotent precursor of a single hormone-expressing endocrine cell type (Desgraz and Herrera 2009); for example, insulin or glucagon. These studies show that the epithelial competence to produce the various endocrine hormone-secreting cells switches over time and that Neurog3 is necessary and sufficient for endocrine lineage commitment.
The transition from Neurog3 activation to an endocrine-committed Neurog3HI state is thought to occur rapidly, predicting a low epithelial residency period for _Neurog3-expressing cells. Our closer examination of the primary data in several studies, however, revealed evidence that could be interpreted as opposing this view. First, low-level Neurog3 expression within the secondary transition pancreatic epithelium seems widespread. Either Neurog3_BAC.Cre;R26R lineage tracing or a _Neurog3_EGFP/+ knock-in reporter detects a large number of intraepithelial cells that potentially represent cells in a _Neurog3-_expressing pre-endocrine-committed state (Zhang et al. 2009; Wang et al. 2010; Bankaitis et al. 2015). In the study by Villasenor et al. (2008), Neurog3 mRNA detection also suggests a _Neurog3-_expressing epithelial population that is broader than that visualized by Neurog3 immunodetection. Furthermore, in situ RNA hybridization with a cocktail of endocrine-specific probes, including Neurog3, showed a substantial occupancy of the epithelial trunk domain by putative endocrine progenitors or precursors (Zhou et al. 2007). Multiple studies report a small but significant number of nonendocrine cells as generated from _Neurog3-_expressing epithelial cells, suggesting that, in a minority of cases, activating Neurog3 expression does not unequivocally instruct endocrine commitment (Schonhoff et al. 2004; Wang et al. 2010). We propose that these studies suggest an intraepithelial subpopulation of _Neurog3-_expressing cells of significant interest in that it might represent a distinct, possibly mitotic, endocrine-biased progenitor state localized to or highly enriched within plexus-state epithelium, which feeds production of endocrine-committed cells during the secondary transition.
These studies prompted our investigation of this endocrine-biased _Neurog3_-expressing epithelial population, focusing on the hypothesis that it does represent a mitotic feeder population. Moreover, we also report a novel Neurog3 BAC transgenic reporter sensitive enough to mark low-level _Neurog3_-expressing cells, allowing a deeper analysis of endocrine specification and commitment. We present several lines of evidence that _Sox9_-expressing, Neurog3 transcriptionally active (_Neurog3_TA) cells with low or even immunologically undetectable Neurog3 protein (referred to here as _Neurog3_TA.LO cells) in fact do represent a mitotic progenitor state that is distinguishable from endocrine-committed Neurog3HI cells and Sox9+ _Neurog3_− pro-duct progenitors. Our real-time analysis shows that Sox9+ _Neurog3_TA.LO progenitors undergo divisions that either maintain the _Neurog3_TA.LO progenitor pool or generate endocrine-committed Neurog3HI cells. Furthermore, genetically limiting Neurog3 expression increased the proliferation and significantly expanded the proportional representation of the Sox9+ _Neurog3_TA.LO population. Our findings support a new model in which endocrine specification is driven by this novel Sox9+ _Neurog3_TA.LO endocrine-biased progenitor pool, significantly advancing our understanding of endocrine cell ontogeny. We discuss potential parallels with the Neurog2-based regulation of the neural progenitor state versus neural specification. We propose that identifying the _Neurog3_TA.LO condition should focus attention on this state as being where intercellular signaling and intrinsic gene regulatory networks converge to regulate Neurog3 expression, control the balance between progenitor maintenance and endocrine specification/commitment, and perhaps identify an early intraepithelial stage at which hormone-specific lineage allocation might occur.
Results
Mitotic Sox9+ Neurog3 protein-low cells are maintained throughout the secondary transition
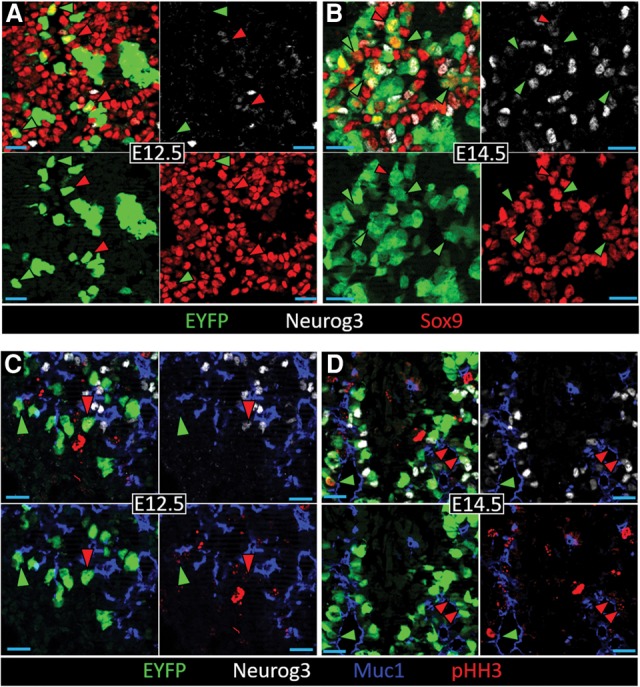
To study the initial phases of Neurog3 expression, we examined Neurog3 protein levels in cells located within or outside the epithelium at E12.5, E14.5, and E16.5. Using Sox9 and Muc1 to mark epithelial cells and their lumenal surface, respectively, we observed two discernable states of Neurog3 expression: a Neurog3 protein-low (Neurog3pLO) Sox9+ Muc1+ state and a Neurog3 protein-high (Neurog3pHI) state that is largely Sox9− and Muc1− (Fig. 1A,B). Because we describe several distinct _Neurog3_-positive populations, for clarity, we list the nomenclature used for each and the associated cell state in Supplemental Table S1. Comparing the Neurog3 immunofluorescence signal intensities showed that Neurog3 protein levels in epithelial Sox9+ Muc1+ Neurog3 protein-positive (Neurog3Protein+) cells were fivefold lower than Neurog3 protein levels in delaminated Sox9− Muc1− Neurog3Protein+ cells at E12.5 and threefold lower for the same comparison at E14.5 (Fig. 1C). Although an avidin–biotin amplification method was used to detect Neurog3, similar results were observed with nonamplifying indirect immunofluorescence (data not shown). The certainty of the Neurog3 low-level protein signal was determined by side-by-side comparison of wild-type and _Neurog3_null tissue (with no signal observed in null tissue) (Supplemental Fig. S1, A vs. B) and location over DAPI+ nuclei. To evaluate the possible progenitor to precursor relationship between the Sox9+ Neurog3pLO and Sox9− Neurog3pHI populations, respectively, their proportional representations with respect to each other were quantified at E12.5, E14.5, and E16.5 (Fig. 1D). One would expect the number of Neurog3pLO relative to Neurog3pHI cells to be largely equal during the secondary transition if Sox9+ Neurog3pLO cells represented the early-stage upsweep of expression during the rapid progression from Neurog3 activation to Neurog3pHI in each endocrine-committing cell. At E12.5, however, Sox9+ Neurog3pLO cells outnumbered Neurog3pHI cells by a small but significant margin (Fig. 1D), while stages after E12.5 exhibited a shift in favor of Sox9− Neurog3pHI and away from Sox9+ Neurog3pLO cells (Fig. 1D). These data are consistent with Sox9+ Neurog3pLO cells functioning as a progenitor pool that gives rise to Neurog3pHI endocrine precursors. To determine whether the Sox9+ Neurog3pLO population varied during the secondary transition, their number as a proportion of the entire Sox9+ epithelium was quantified between E12.5 and E16.5. Despite a decrease from E12.5 to E14.5, the Sox9+ Neurog3pLO population remained at a similar level between E14.5 and E16.5 (Supplemental Fig. S2). Although the numbers of Sox9+ Neurog3pLO cells seem quite low if scored relative to the entire epithelium, their representation is likely much higher within the central epithelial plexus (further supporting evidence is presented below), in which the majority of Neurog3+ cells reside and which produces endocrine cells with a relatively constant yield between E14.5 and E16.5 (Bankaitis et al. 2015). Because we suspected that the Sox9+ Neurog3pLO pool functions as a cycling progenitor population, we tested its proliferative index relative to endocrine-committed Neurog3pHI cells. Detecting phospho-histone H3 (pHH3) to mark cell cycle M phase, over DAPI+ nuclei, substantial numbers of intraepithelial pHH3+ Neurog3pLO cells were found at E12.5 and E14.5 (Fig. 1E–H). Although, above, we used Sox9 to mark intraepithelial cells, the fact that both Sox9 and pHH3 antibodies were raised in rabbits prompted the use of Muc1 (an apical surface marker) and DAPI to identify epithelial cells with a definitive apical lumen-contacting surface. Quantification revealed 11.5% ± 1.7% of Muc1+ Neurog3pLO cells as pHH3+ at E12.5 versus 7.6% ± 1.8% at E14.5 (Fig. 1I). Consistent with previous studies (Gu et al. 2002; Desgraz and Herrera 2009), Sox9− Neurog3pHI cells had very few pHH3+ cells and thus were largely post-mitotic (Fig. 1I). Quantifying immunofluorescence signal intensities in Muc1+ Neurog3Protein+ pHH3+ cells versus Muc1− Neurog3Protein+ pHH3− cells at E12.5 and E14.5 confirmed that intraepithelial pHH3+ Neurog3Protein+ cells were in the Neurog3pLO state (Fig. 1J). These data together support the idea that the intraepithelial Neurog3pLO condition is an appreciably mitotic progenitor state that, as a population, perdures during the secondary transition. We postulate that the greater number and mitotic index of intraepithelial Neurog3pLO cells at E12.5 (Fig. 1D,I) are possibly connected to the expansion of the plexus niche as the pancreatic epithelium enters the secondary transition period (Bankaitis et al. 2015).
Figure 1.

The Neurog3Protein+ population is comprised of mitotic Neurog3pLO and post-mitotic Neurog3pHI cells. E12.5 (A) and E14.5 (B) pancreatic epithelium showing Muc1, Sox9, and Neurog3. White and red arrowheads indicate Sox9+ Muc1+ Neurog3pLO cells and Sox9− Muc1− Neurog3pHI, respectively. (C) Average fluorescence intensity of nuclear Neurog3 signal in Sox9+ Neurog3Protein+ versus Sox9− Neurog3Protein+ cells. n = 9 cryosections; N = 3 pancreata at E12.5 and E14.5. (*) P = 2 × 10⁻⁵; (**) P = 0.0002. (D) Percentage of Sox9+ Neurog3pLO versus Sox9− Neurog3pHI cells at E12.5 (n = 1114; N = 3), E14.5 (n = 3797; N = 3), and E16.5 (n = 4374; N = 3). (*) P = 0.0895; (**) P = 3 × 10⁻⁵; (***) P = 0.0001. E12.5 (E,G) and E14.5 (F,H) pancreatic epithelium showing pHH3, Neurog3, Muc1, and DAPI or pHH3, Neurog3, and E-cadherin. Red arrowheads indicate intraepithelial pHH3+ Neurog3pLO cells. (I) Mitotic index of Muc1+ Neurog3pLO cells versus Muc1− Neurog3pHI cells at E12.5 (n = 1546) and E14.5 (n = 10080). (J) Average fluorescence intensity of nuclear Neurog3 signal in Muc1+ Neurog3Protein+ pHH3+ cells versus Muc1− Neurog3Protein+ pHH3− cells at E12.5 and E14.5, calculated as in C. Data are mean ± SEM. (*) P = 0.0005; (**) P = 0.0087.
Neurog3 transcriptional activity marks a mitotic Sox9+ Neurog3+ endocrine progenitor population
As discussed above, previous reports showed Neurog3 mRNA expression to be broader than Neurog3 protein and to include intraepithelial cells. To investigate intraepithelial _Neurog3_-expressing cells further, we used the _Neurog3_BAC.Cre transgene (Schonhoff et al. 2004) to drive _R26R_EYFP recombination to mark _Neurog3_TA cells. Analysis at E14.5 revealed a heterogeneous pattern of EYFP-labeled Sox9+ _Neurog3_TA cells marked for having entered a _Neurog3_-expressing state (Supplemental Fig. S3). In peripheral regions of the pancreas, the proportion of EYFP-labeled Sox9+ _Neurog3_TA intraepithelial cells was as low as 5%–8%, while in central plexus-state regions, the proportional representation was locally as high as 54% (Supplemental Fig. S3). These results are consistent with previous work showing that _Neurog3_-expressing cells are mostly derived from the central plexus state and much less from peripheral regions comprising mostly duct and ductal branches (Bankaitis et al. 2015). Quantification of central plexus regions showed an overall proportional representation of 24% ± 2.4% (N = 5) for EYFP-labeled Sox9+ _Neurog3_TA cells among all Sox9+ cells. Endocrine commitment is thought to occur rapidly after Neurog3 activation, triggering Sox9 down-regulation, Neurog3 up-regulation, and epithelial delamination. However, within the Sox9+ EYFP-labeled _Neurog3_TA population, we consistently identified a number of scattered cells with a higher EYFP signal (Supplemental Fig. S3). We speculate that, following activation of Neurog3 expression, some Sox9+ _Neurog3_TA cells remain intraepithelial for a prolonged period before moving to commitment delamination and thus accumulate more EYFP. Notably, the majority of EYFP-labeled Sox9+ _Neurog3_TA cells within these plexus regions were clustered and not fully interspersed with EYFP-negative cells. We propose that it is highly unlikely that all of these clustered cells are concurrently transitioning to the _Neurog3_HI state. This observation thus supports the notion that low-level Neurog3 activation in Sox9+ cells, combined with a substantial residence period, leads to a sizeable intraepithelial representation of this cell population. It should be remembered that there is eventually only a tiny final contribution of EYFP-labeled _Neurog3_BAC.Cre traced cells to mature duct fates (∼1%) (Schonhoff et al. 2004), meaning that essentially all of these “transiently intraepithelial” cells do eventually progress to endocrine commitment.
Within these EYFP-labeled Sox9+ _Neurog3_TA cells, in addition to some containing detectable but low-level Neurog3 protein (_Neurog3_TA.pLO), many more had none detectable (_Neurog3_TA.pUD) (Fig. 2A,B; Supplemental Table S1). The proliferation marker pHH3 revealed numerous mitotic intraepithelial _Neurog3_TA.pLO (defined here as Muc1+ lumen-contacting) (presumably equivalent to those in Fig. 1E–H) as well as _Neurog3_TA.pUD cells (Fig. 2C,D). These data, along with the knowledge that nearly all (∼96%) _Neurog3_-based lineage-labeled cells ultimately adopt the endocrine lineage (Schonhoff et al. 2004; Zhang et al. 2009), indicate that the Sox9+ _Neurog3_TA.pUD and Sox9+ _Neurog3_TA.pLO populations together—collectively referred to here as the Sox9+ _Neurog3_TA.LO population (Supplemental Table S1)—represent a mitotic endocrine-biased progenitor pool. The evidence from pHH3+ quantification is strengthened below in real-time tracing of this population with a new Neurog3 reporter. In addition, comparing Sox9+ _Neurog3_TA.LO progenitor numbers relative to Sox9− lineage-labeled _Neurog3_pHI (referred to here as _Neurog3_TA.HI) endocrine-committed cells revealed a shift toward _Neurog3_TA.HI cells at E14.5 versus E12.5 (Supplemental Fig. S4), the same pattern as seen in Figure 1D. In sum, we propose that tracking Neurog3 transcriptional activity marks the true intraepithelial _Neurog3_LO mitotic progenitor state that is responsible for deriving endocrine-committed Neurog3HI cells.
Figure 2.
_Neurog3_TA Sox9+ cells, comprising _Neurog3_TA.pLO and _Neurog3_TA.pUD cells, represent a mitotic _Neurog3_TA.LO endocrine-biased progenitor pool. E12.5 (A,C) and E14.5 (B,D) pancreatic epithelium showing EYFP, Neurog3, and Sox9 or EYFP, Neurog3, Muc1, and pHH3. (A,B) Red and green arrowheads indicate Sox9+ EYFP+ _Neurog3_TA.pLO cells and Sox9+ EYFP+ _Neurog3_TA.pUD cells, respectively. (C,D) Red and green arrowheads indicate pHH3+ Muc1+ _Neurog3_TA.pLO and pHH3+ Muc1+ _Neurog3_TA.pUD cells, respectively.
Tracking mitotic _Neurog3_TA.LO progenitors via a novel Neurog3 BAC transgenic reporter
Although the indelible marking of _Neurog3_-expressing cells by the Neurog3_BAC.Cre;R26R_EYFP system is useful for lineage tracing studies, the cumulative nature of this labeling system potentially loses critical aspects of dynamic gene expression. We therefore generated a new, sensitive _Neurog3_-driven H2BmCherry-peptide-2A-GFPGPI BAC transgenic reporter mouse (_Neurog3_RG1) that uses a peptide 2A breaker for simultaneous marking of the chromatin (histone H2BmCherry fusion [“R”]) and plasma membrane (glycosylphosphatidylinositol [GPI]-EGFP fusion [“G”]) of _Neurog3_-expressing cells (Supplemental Fig. S5A). The design of the _Neurog3_RG1 reporter as a BAC transgenic followed several criteria outlined in the Supplemental Material and avoided any negative impact on progenitor behavior caused by engineering the native Neurog3 locus (Wang et al. 2010). Examination of gross tissue morphology and scoring cell type proportional representations—especially focusing on nascent and hormone-expressing endocrine cells over various phases of pancreatogenesis—revealed no abnormal phenotype in _Neurog3_RG1 reporter mice (Supplemental Fig. S5B–E). Glucose levels of ad libitum fed _Neurog3_RG1 mice were similar to wild-type littermates (Supplemental Table S2). The numbers of Sox9+ Neurog3pLO cells and Sox9− Neurog3pHI cells at E12.5 and E14.5 were also unchanged in _Neurog3_RG1 transgenic mice relative to wild type (Supplemental Table S2). Rigorous quantification revealed that the majority of Neurog3Protein+ cells (low and high Neurog3+ cells together) coexpressed the _Neurog3_RG1 reporter (60% ± 3.2% at E12.5 and 70% ± 7.7% at E14.5) (Supplemental Table S2). Although all _Neurog3_RG1+ Neurog3pHI cells showed both mCherry and EGFP signals, the more rapid maturation time of mCherry (∼15 min) (Shaner et al. 2005) caused a portion of intraepithelial _Neurog3_RG1+ Neurog3pLO cells to be only mCherry+ (Supplemental Fig. S5B–D); we presume that these cells would later have become red/green dual-fluorescent. Neurog3 expression normally decreases following hormone expression, but the H2BmCherry longevity and, to a much lesser extent, GFPGPI caused red/green labeling in some hormone-expressing endocrine cells and an enduring red signal in cells contained within islet clusters (Supplemental Fig. S5D,E). Similar to earlier findings (Fig. 2), at both E12.5 and E14.5, _Neurog3_RG1 transcription reporting marked Sox9+ _Neurog3_pUD as well as _Neurog3_pLO cells (Figs. 3A,B, 6A), with a significant number of the overall _Neurog3_TA.LO population being pHH3+ (Fig. 3C,D). Additionally, the number of Sox9+ _Neurog3_RG1+ _Neurog3_TA.LO cells relative to Sox9− _Neurog3_RG1+ _Neurog3_TA.HI cells showed a shift in favor of endocrine commitment at E14.5 versus E12.5 (Fig. 3E), similar to the _Neurog3_Cre-based lineage tracing result (Supplemental Fig. S4). The higher proportion of Sox9+ _Neurog3_TA.LO cells relative to Sox9− _Neurog3_TA.HI cells (Supplemental Fig. S4 vs. Fig. 3E) likely represents the cumulative labeling over a substantial time period within which Cre activates the binary R26R reporter, whereas the “snapshot” analysis via the _Neurog3_RG1 reporter might detect only a subset in which the fluorescence is detectable at the time of analysis. These data validate the _Neurog3_RG1 mouse line as a passive reporter that correctly marks the various states of Neurog3 expression in the intraepithelial and delaminated stages of endocrine ontogeny.
Figure 3.
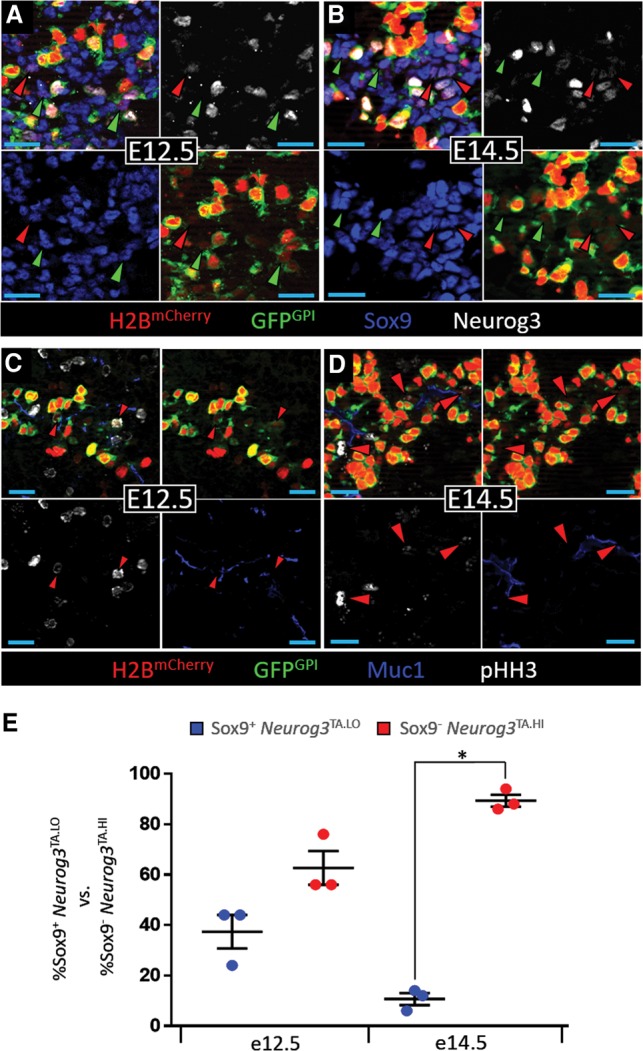
The _Neurog3_RG1 transgenic reporter marks the mitotic _Neurog3_TA.LO progenitor population. E12.5 (A,C) and E14.5 (B,D) pancreatic epithelium showing H2BmCherry, GFPGPI, Sox9, and Neurog3 or H2BmCherry, GFPGPI, Muc1, and pHH3. (A,B) Red and green arrowheads indicate Sox9+ _Neurog3_TA.pLO and Sox9+ _Neurog3_TA.pUD cells (seen by low H2BmCherry signal from _Neurog3_RG1), respectively. (C,D) Red arrowheads indicate Muc1+ _Neurog3_RG1+ pHH3+ _Neurog3_TA.LO cells. (E) The percentage of _Neurog3_RG1+ Sox9+ _Neurog3_TA.LO versus _Neurog3_RG1+ Sox9− _Neurog3_TA.HI cells at E12.5 (n = 585; N = 3) and E14.5 (n = 6334; N = 3). Data are mean ± SEM. (*) P = 1 × 10⁵.
Figure 6.

Limiting Neurog3 expression expands the _Neurog3_TA.LO population at the expense of _Neurog3_TA.HI cells. (A) The percentage of Sox9+ _Neurog3_TA.pLO versus Sox9+ _Neurog3_TA.pUD cells in wild-type (_Neurog3_RG1) (see Fig. 3E for n), _Neurog3_EGFP/+ (E12.5, n = 168, N = 3; E14.5, n = 2425, N = 3), and _Neurog3_EGFP/FL (E12.5, n = 1237, N = 3; E14.5, n = 5818, N = 3) pancreata. (*) P = 0.0523; (**) P = 0.00067; (***) P = 8.3 × 10⁻⁵; (****) P = 4 × 10⁻⁶; (*****) P = 2.5 × 10⁻⁵. (B) The percentage of Sox9+ _Neurog3_TA.LO versus Sox9− _Neurog3_TA.HI cells in _Neurog3_EGFP/+ and _Neurog3_EGFP/FL (see A for n) pancreata. (*) P = 8 × 10⁻⁵; (**) P = 8 × 10⁻⁸; (***) P = 2.4 × 10⁻⁷. (C) The percentage of Sox9+ cells that are _Neurog3_TA.LO in wild-type (_Neurog3_RG1) (E12.5, n = 4497, N = 3; E14.5, n = 11930, N = 4), _Neurog3_EGFP/+ (E12.5, n = 4718; E14.5, n = 15903), and _Neurog3_EGFP/FL (E12.5, n = 4656; E14.5, n = 15671) pancreata. (*) P = 0.00015; (**) P = 0.0009; (***) P = 0.0022; (****) P = 2 × 10⁻⁷; (*****) P = 1 × 10⁻⁶. Data are mean ± SEM.
Comparison of _Neurog3_TA.LO progenitors with endocrine-committed cells captured via _Neurog3_RG1 reporting
The _Neurog3_RG1 reporter was immediately valuable in revealing, at relatively high resolution, not only the behavior of intraepithelial _Neurog3_TA.LO progenitors by time-lapse imaging but also the derivation and delamination of endocrine-committed _Neurog3_TA.HI cells. During an initial analysis, we observed a previously unknown feature of delaminating _Neurog3_TA.HI cells (Supplemental Fig. S6A). Specifically, _Neurog3_TA.HI cells entering delamination showed an early apical membrane narrowing, but later, when most of the cell body had become displaced from the main epithelial layer, there was a pervasive narrow tether-like connection to an almost punctate apical contact at the lumen (Supplemental Fig. S6). Time-lapse imaging of E14.5 _Neurog3_RG1+ explants showed that the process of delamination, from initial apical narrowing of a _Neurog3_TA.HI cell to its epithelial detachment, lasted upward of 16 h, with a majority of this period spent in the tethered state (Supplemental Fig. S6B,D; Supplemental Movie 1). Quantification of delaminating _Neurog3_RG1-HI cells showed that 100% involved apically connected lumenal tethers (CVE Wright, ME Bechard, and E Bankaitis, in prep.; data not shown). The prolonged lumenal contact during delamination of _Neurog3_TA.HI cells means that both they and Sox9+ _Neurog3_TA.LO cells were Muc1+ (Supplemental Fig. S6C). Combining Muc1 positivity with _Neurog3_RG1 reporter expression thus provided an opportunity to flow-sort and separate intraepithelial progenitors (Muc1+ _Neurog3_RG1-LO) (Supplemental Table S1) and actively delaminating cells (Muc1+ _Neurog3_RG1-HI) (Supplemental Table S1) to characterize their progenitor–precursor relationship. To accomplish this, _Neurog3_RG1+ E12.5 and E14.5 explants were flow-sorted first for Muc1 positivity and then according to low or high _Neurog3_RG1 fluorescence (Supplemental Fig. S7A). Analysis via quantitative RT–PCR (qRT–PCR) showed that sorted _Neurog3_RG1-HI cells from E12.5 and E14.5 pancreata, in addition to negligible Sox9 expression, were highly enriched for Neurog3, glucagon, insulin (but in E14.5 samples only), Pax6, and NeuroD1 (Supplemental Figs. S7B, S8). _Neurog3_RG1-HI cells were highly enriched for Cdkn1a (Supplemental Fig. S8), which promotes cell cycle exit and is a known target of Neurog3 (Miyatsuka et al. 2011). Recently, Hnf1b was shown to be a critical positive regulator of Neurog3 expression (De Vas et al. 2015). Our analysis, however, shows higher Hnf1b expression in _Neurog3_TA.HI cells versus _Neurog3_TA.LO cells (Supplemental Fig. S8), which could indicate a role in activating Neurog3 expression during the early _Neurog3_TA.LO-to-_Neurog3_TA.HI transition. These data are consistent with actively delaminating Muc1+ _Neurog3_RG1-HI cells being post-mitotic, undergoing endocrine commitment toward the hormone-expressing condition. In contrast, sorted _Neurog3_RG1-LO cells had significantly lower Neurog3 expression and negligible glucagon, Pax6, or NeuroD1 expression, with significant enrichment in Sox9, Hes1, and Hnf6 (Supplemental Figs. S7B, S8). Consistent with their mitotic nature, cyclin-dependent kinase 6 (Cdk6; a positive cell cycle regulator) was enriched in _Neurog3_RG1-LO cells (Supplemental Fig. S8). Because Sox9, Hes1, and Hnf6 are accepted progenitor-state markers within the bipotent population of the trunk epithelium, these data fit with the Sox9+ _Neurog3_TA.LO population being at or close to a progenitor state.
Real-time analysis of mitotic _Neurog3_TA.LO cells
To investigate further our proposal that Sox9+ _Neurog3_TA.LO cells give rise to both _Neurog3_TA.LO progenitors and endocrine-committing post-mitotic _Neurog3_TA.HI precursors, E12.5 _Neurog3_RG1 explants were subjected to time-lapse imaging focusing on intraepithelial low-level fluorescing cells. Dividing _Neurog3_TA.LO cells and their progeny were followed for ∼12–24 h (Supplemental Table S3); imaging was restricted to ∼24 h because the end of this period started to show presumably phototoxic effects on tissue growth and cell survival, a known consequence of confocal laser exposure (Stephens and Allan 2003). The size of the pancreatic explants (∼50–100 µm thick) and substantial light scattering in deep-tissue imaging served to limit our analysis to ∼30 µm closest to the microscope objective (Supplemental Table S3). Within this depth, we observed an average of three intraepithelial _Neurog3_RG1-LO mitotic events per explant—a total of 15 over five real-time imaging runs (Supplemental Table S3). Although an apical marker was absent during our real-time analysis, a _Neurog3_TA.LO cell was assigned as intraepithelial by the extent of its apical surface, the lack of the narrow tether seen on delaminating _Neurog3_RG1-HI cells, and nuclear proximity to the lumen (Fig. 4A,B). Several factors likely contributed to observing what is probably a subset of the true number of Sox9+ _Neurog3_TA.LO cell divisions occurring within the pancreatic epithelium in vivo. First, the relatively high number of _Neurog3_RG1+ cells and high fluorescence in _Neurog3_RG1-HI cells in the E12.5–E13.5 period meant that divisions were clearly discernible only in regions less densely populated by _Neurog3_RG1+ cells. Second, the pancreatic epithelium is approximately fourfold less mitotically active under ex vivo culture conditions (Puri and Hebrok 2007; Kim et al. 2015). To determine whether the observed division events produced _Neurog3_TA.LO cells or _Neurog3_TA.HI cells, the level of H2BmCherry fluorescence intensity in the nucleus of an intraepithelial _Neurog3_RG1-LO cell was quantified first at the initial appearance of mitotic chromosomes (Supplemental Table S3). Although details of H2BmCherry fluorescence are reported for this analysis, the GFPGPI fluorescence intensity provided matching information. Next, the fluorescence intensity of _Neurog3_RG1-expressing daughters was quantified ∼3–6 h after division, with fluorescence intensity quantification beyond 6 h being dependent on how long the daughter cells were tracked before video termination or whether they moved out of view (Supplemental Table S3). _Neurog3_RG1+ daughter cells were determined to have initiated delamination if they increased the _Neurog3_RG1 fluorescence intensity or showed basal-ward displacement of their nucleus/cell body or other signs of delamination, such as basally directed membrane-protrusive behavior, formation of the lumenal tether, and greatly narrowed apical contact. By these parameters, two division categories were observed. In the first, a _Neurog3_RG1-LO cell produced two daughters, each increasing _Neurog3_RG1 reporter fluorescence intensity by an average of ∼2.5-fold and simultaneously exhibiting signs of delamination (Fig. 4A; Supplemental Table S3; Supplemental Movie 2). This division was a symmetric division terminal differentiation event in which both daughters moved toward endocrine commitment, with the transition from _Neurog3_TA.LO to _Neurog3_TA.HI (as marked by the _Neurog3_RG1 reporter) taking ∼3–6 h. In the second type of division, a _Neurog3_RG1-LO cell produced two daughters that did not increase _Neurog3_RG1 reporter fluorescence intensity, exhibited no filopodial exploratory behavior at the basal surface or other signs of delamination, and remained in an intraepithelial location (Fig. 4B; Supplemental Table S3; Fig. 4B; Supplemental Movie 3). This type of division was classified as symmetric division progenitor maintenance: a _Neurog3_TA.LO progenitor producing daughters that both remained in the _Neurog3_TA.LO progenitor state. Intraepithelial Sox9+ _Neurog3_TA.LO progenitors are thus able to undergo divisions that either produce more progenitors or give rise to more differentiated progeny. Of the observable mitotic events scorable during these movies, all occurred in _Neurog3_TA.LO (_Neurog3_RG-LO) cells; no _Neurog3_RG-HI divisions were observed. There was an overall 53%:47% split between progenitor maintenance and symmetric terminal differentiation divisions, and no asymmetric cell divisions were observed, forming one _Neurog3_TA.LO and one _Neurog3_TA.HI cell. We consider these data to be in accordance with the incipient building up of the endocrine-biased progenitor pool during the rapid plexus expansion occurring at this stage of pancreas organogenesis.
Figure 4.
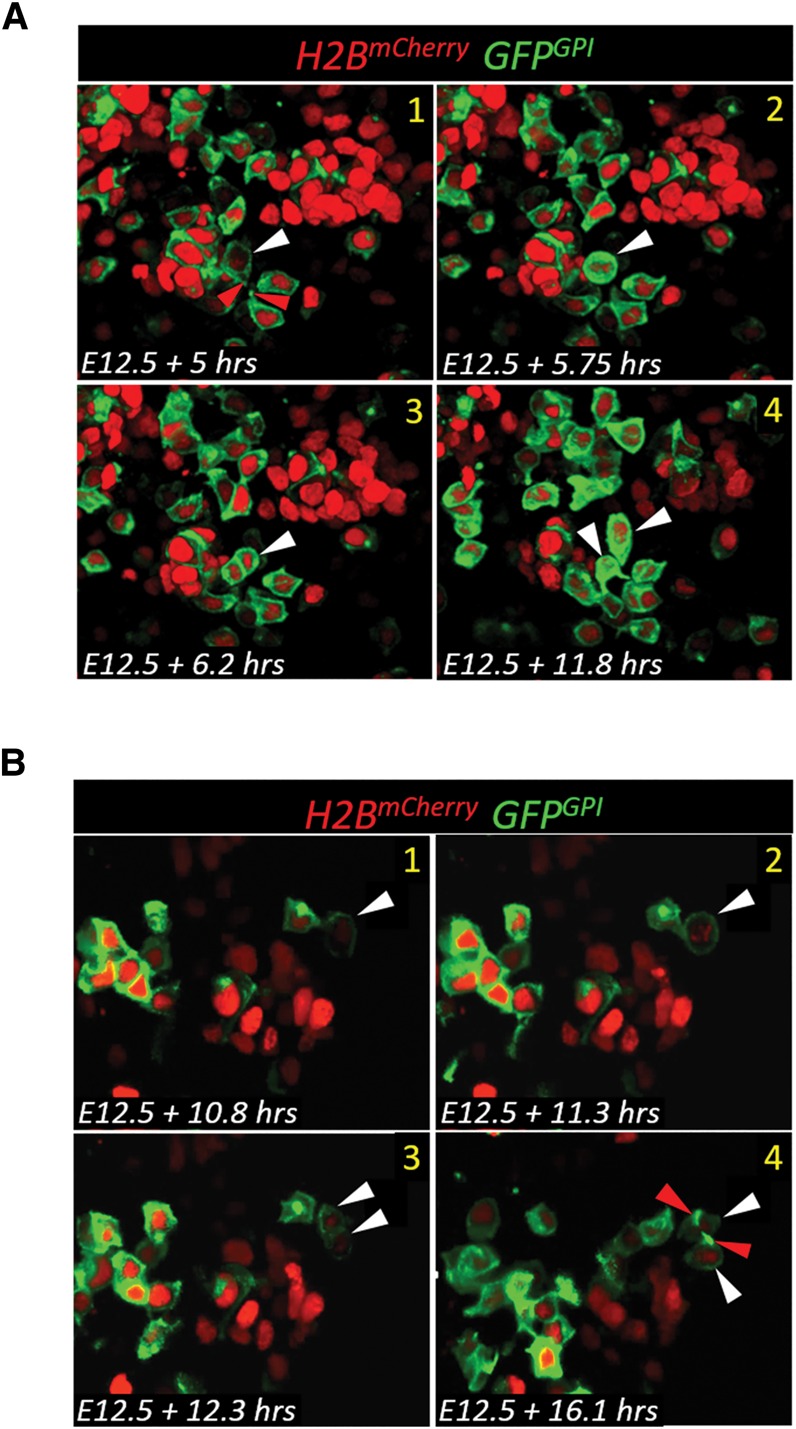
Division of _Neurog3_TA.LO progenitors in real time. Division of a _Neurog3_TA.LO cell into two delaminating _Neurog3_TA.HI cells (A) or two _Neurog3_TA.LO progenitors (B). Images are screen captures from Fig. 4B; Supplemental Movie 2. White and red arrowheads indicate a _Neurog3_TA.LO division event and apical attachment, respectively.
Although not directly observed in our time-lapse movies (possibly because of the restricted time-lapse period and the slowing of mitotic activity ex vivo), we hypothesized that mitotic _Neurog3_TA.LO progenitors in vivo can undertake multiple rounds of division to produce, over time, considerable numbers of _Neurog3_TA.LO progenitors or _Neurog3_TA.HI cells. Sequential dual-thymidine analog labeling is one way of tracking cells that divide more than once (Teta et al. 2007; Bradford and Clarke 2011). To determine the relative rate at which multiple rounds of progenitor maintenance versus terminal differentiation occurred, we quantified the relative proportion of EdU/BrdU double-labeled _Neurog3_pLO cells versus EdU/BrdU double-labeled _Neurog3_pHI cells. To accomplish this, E12.5 or E14.5 pancreatic epithelium was labeled sequentially with single EdU and BrdU injections 12 h apart (Supplemental Fig. S9A). To avoid fluorescence crossover problems when combining mCherry/GFP signals from _Neurog3_RG1 with EdU/BrdU immunofluorescence signals, we used Neurog3 protein to define _Neurog3_TA.LO and _Neurog3_TA.HI cells. Despite the likely underscoring of _Neurog3_TA.LO cells by using this method (for reasons described above), we show that the percentage of EdU+BrdU+ Neurog3pLO cells is ∼3.2-fold higher than that of EdU+BrdU+ Neurog3pHI cells at E12.5, compared with equal proportions of the two populations at E14.5 under the same labeling scheme (Supplemental Fig. S9B,D,E). It is possible that the complex plexus-state epithelium in vivo displays spatiotemporally varied behavior of _Neurog3_TA.LO progenitors with respect to their frequency of undergoing multiple rounds of division. Our snapshot-style bulk analysis will therefore tend toward a “homogenizing” nature when scoring across such a largely asynchronous epithelium and underrepresent the variation in mitotic activity of _Neurog3_TA.LO progenitors as the plexus-state endocrine progenitor niche develops, moves toward a state of peak endocrine yield, and begins final remodeling to the mature ductal tree. Nevertheless, these data fit the notion that, early in the secondary transition, progenitor maintenance-type division of the Sox9+ _Neurog3_TA.LO pool is favored over symmetric terminal differentiation-type division (Supplemental Fig. S9C). As the pancreatic epithelium progresses through the secondary transition, however, the proportion of terminal differentiation events could increase to accommodate local increases in endocrine cell birth rate.
Limiting Neurog3 expression increases proliferation and expands the _Neurog3_TA.LO progenitor pool
We tested whether deliberately reducing the level of Neurog3 gene activity would increase the proliferative index of _Neurog3_TA.LO progenitors and/or cause a concomitant population expansion. We determined the number and mitotic activity of Sox9+ _Neurog3_TA.LO cells in a decreasing series of gene dosages: wild-type, Neurog3 heterozygous (_Neurog3_EGFP/+), and strong Neurog3 hypomorphic (_Neurog3_EGFP/FL) conditions. At E14.5, Neurog3 expression and protein levels in the developing pancreas are known to decrease by ∼50% in the heterozygous condition and ∼75% under the strong hypomorphic condition (Wang et al. 2010) and are known to release _Neurog3_-expressing cells to nonendocrine lineages in both “reduced dosage” states. In that study, a large increase in _Neurog3_-expressing epithelial cells occurred in the strong hypomorphic condition compared with the heterozygous condition (Wang et al. 2010). However, the _Neurog3_EGFP reporter that they used was _Neurog3_-null, preventing comparison with wild-type tissues. Our new _Neurog3_RG1 reporter does not perturb the endogenous locus and thus allows this comparison. We reasoned that the _Neurog3_RG1 BAC transgene reporter (see the Supplemental Material) would behave similarly to the endogenous locus EGFP knock-in for estimating dynamic behavior of the _Neurog3_TA.LO population. We decided against using Neurog3_BAC.Cre;R26R_EYFP lineage tracing in the wild-type condition, which captures the population cumulatively via a dual-gene activation system. In areas of plexus-like epithelium that are rich in endocrine-committing and delaminating Neurog3HI cells, the visual estimation of the prevalence of the intraepithelial _Neurog3_TA.LO population was similar for _Neurog3_RG1 (Fig. 3A,B) and _Neurog3_EGFP/+ tissue (Fig. 5A,B), which was then validated by quantification across the epithelium (Fig. 6C), supporting the idea that both are effective for probing the population behavior of the _Neurog3_TA.LO pool. In all three genotypes—wild type (containing _Neurog3_RG1+), heterozygous _Neurog3_EGFP/+, and strong hypomorphic _Neurog3_EGFP/FL—we could easily observe _Neurog3_TA.pLO (Neurog3 protein-low) and _Neurog3_TA.pUD (Neurog3 protein-undetectable) cells. As for the wild-type tissue, the heterozygous and the strong hypomorph conditions also showed significant numbers of their overall EGFP+ Sox9+ _Neurog3_TA.LO population as pHH3+ (Fig. 5E–H). Quantification showed that, relative to the wild type, the number of Sox9+ _Neurog3_TA.pUD cells was significantly (and equivalently) greater than Sox9+ _Neurog3_TA.pLO cells under Neurog3 heterozygous and strong hypomorphic conditions at both E12.5 and E14.5 (Figs. 5C,D, 6A). We also observed, at E12.5, a significantly increased Sox9+ _Neurog3_TA.LO progenitor pool (combining protein-low and protein-undetectable cells) relative to the endocrine-committed _Neurog3_TA.HI pool in the heterozygous and strong hypomorphic conditions (cf. Figs. 3E and 6B). As described above (Figs. 1D, 3E), wild-type tissue showed a significantly increased _Neurog3_TA.HI relative to _Neurog3_TA.LO cell number between E12.5 and E14.5. The degree of this temporal shift toward the _Neurog3_TA.HI pool was much reduced in the heterozygous condition and nearly absent in the strong hypomorph (Figs. 3E vs. 6B). These results suggest that limiting Neurog3 expression—and thus protein levels—increased the number of Sox9+ _Neurog3_TA.LO progenitors undergoing progenitor maintenance divisions relative to terminal differentiation-type divisions.
Figure 5.
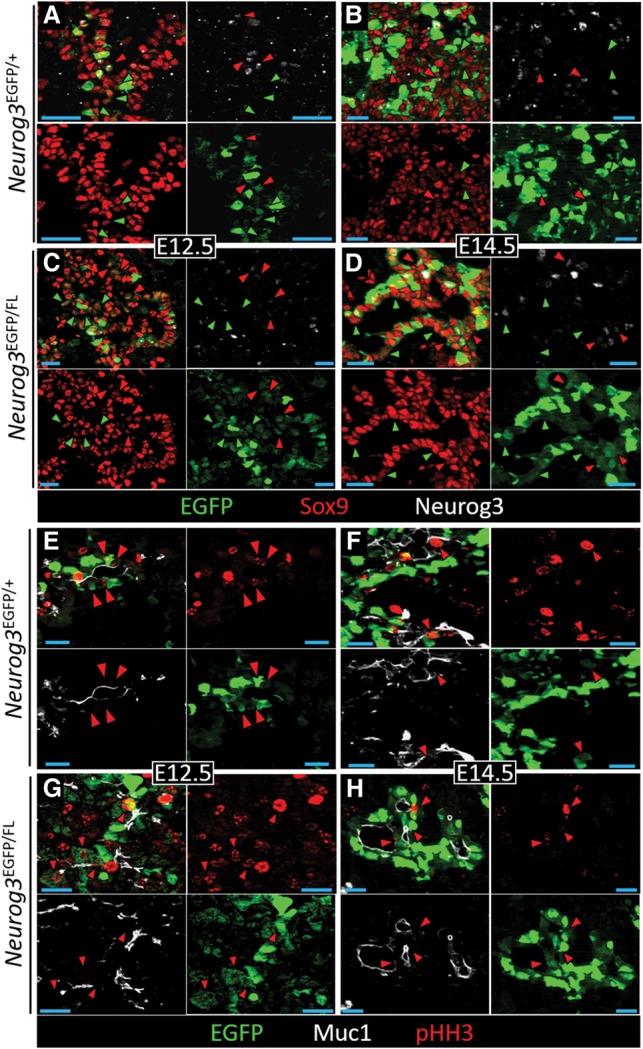
The mitotic _Neurog3_TA.LO population is prevalent under Neurog3 heterozygous and strong hypomorphic conditions. E12.5 (A,C,E,G) and E14.5 (B,D,F,H) pancreatic epithelium showing EGFP, Neurog3, and Sox9 or EGFP, Muc1, and pHH3 from _Neurog3_EGFP/+ and _Neurog3_EGFP/FL embryos. (A_–_D) Red and green arrowheads indicate Sox9+ _Neurog3_TA.pLO and Sox9+ _Neurog3_TA.pUD cells (marked by low EGFP signal from _Neurog3_EGFP), respectively. (E_–_H) Red arrowheads indicate Muc1+ EGFP+ pHH3+ _Neurog3_TA.LO cells.
We next determined whether the increased production of Sox9+ _Neurog3_TA.LO progenitors under reduced gene dosage affected the overall proportional representation of the intraepithelial _Neurog3_TA.LO progenitor population. Compared with the wild-type (_Neurog3_RG1+) control, the proportion of Sox9+ _Neurog3_TA.LO cells under the heterozygous condition, although unchanged at E12.5, was 2.5-fold expanded at E14.5 (Fig. 6C). Under the strong hypomorphic condition, however, this population was increased eightfold at E12.5 and 14-fold at E14.5 (Fig. 6C). These expansions were associated with increased proliferation as marked by pHH3. As explained above (Fig. 2), only _Neurog3_TA cells (_Neurog3_RG1-positive cells) with clear Muc1+ surfaces were defined as intraepithelial and with DAPI as an aid where appropriate. The mitotic index of _Neurog3_TA.LO cells in _Neurog3_EGFP/+ heterozygous relative to the wild type, although unchanged at E12.5, was increased 1.4-fold at E14.5 (Fig. 7A). In the _Neurog3_EGFP/FL strong hypomorph, however, the index was increased 2.1-fold at E12.5 and 1.7-fold at E14.5 (Fig. 7A). We also scored for any non-cell-autonomous effect of limiting Neurog3 expression on the mitotic index of the surrounding _Neurog3_-nonexpressing (Muc1+ _Neurog3_−) epithelium but found no significant change (Fig. 7A). These findings are consistent with a low level of Neurog3 protein having a critical role in the maintenance of an actively cycling, endocrine-biased _Neurog3_TA.LO progenitor state (Fig. 7B).
Figure 7.
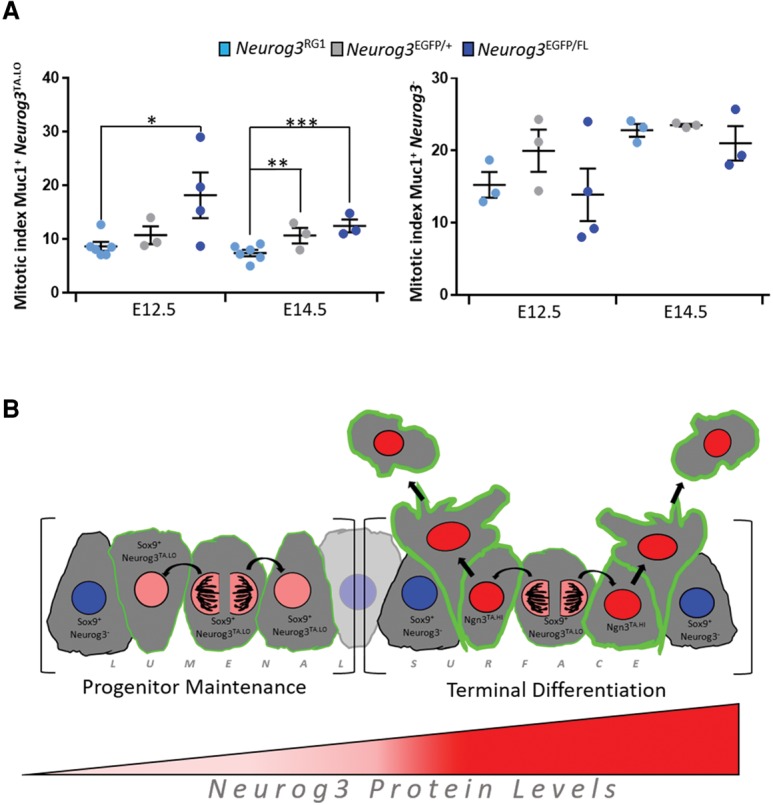
Reducing Neurog3 expression increases the mitotic index of Sox9+ _Neurog3_TA.LO progenitors. (A, left) The mitotic index (percentage pHH3+) of Muc1+ _Neurog3_TA.LO cells under wild-type (_Neurog3_RG1) (E12.5, n = 569, N = 6; E14.5, n = 2401, N = 6), _Neurog3_EGFP/+ (E12.5, n = 362, N = 3; E14.5, n = 904, N = 3), and _Neurog3_EGFP/FL (E12.5, n = 783, N = 4; E14.5, n = 3905, N = 3) conditions. (Right) The mitotic index of Muc1+ _Neurog3_− cells in wild-type (_Neurog3_RG1) (E12.5, n = 1200 cells, N = 3; E14.5, n = 7490, N = 3), _Neurog3_EGFP/+ (E12.5, n = 1003, N = 3; E14.5, n = 2737, N = 3) and _Neurog3_EGFP/FL (E12.5, n = 2226, N = 4; E14.5, n = 5217, N = 3) pancreata. Data are mean ± SEM. (*) P = 0.0138; (**) P = 0.0207; (***) P = 0.0018. (B) Model depicting the behavior of _Neurog3_TA.LO cells in the pancreatic epithelium.
Discussion
We describe several lines of evidence pointing to a new model for the generation of endocrine-committed Neurog3HI cells during the pancreatic secondary transition, driven by an intraepithelial endocrine-biased mitotic _Neurog3_TA.LO progenitor population (Fig. 7B). Using _Neurog3_-driven transcriptional reporters, we show that these progenitors are relatively abundant and have prolonged residency within the plexus-state epithelium of the developing pancreas, undertaking symmetric divisions to maintain the progenitor pool or produce two endocrine-committing daughters. As a mitotic pool that continually feeds production of endocrine-committed cells by symmetric terminal differentiation division, its behavior is reminiscent of progenitors in other tissues (for example, the intestinal crypt), acting as a transit-amplifying population. We do not propose that the _Neurog3_TA.LO progenitor pool is set aside at a very early stage of pancreas development, within the primary transition. However, further investigation (probably requiring lineage tracing tools capable of labeling only Neurog3 low-level expressors) would be needed to distinguish whether the Sox9+ _Neurog3_TA.LO endocrine-biased progenitor pool continues to be established throughout the secondary transition by derivation from a parental bipotent (duct/endocrine) trunk epithelium population or is essentially completely allocated within a short period near the inception of the secondary transition. If the latter result were to be found, it would support one interpretation of a previous lineage tracing study (Gu et al. 2002) showing that a large-scale separation of the duct and endocrine progenitors occurs in the run-up to the secondary transition as the plexus-state trunk epithelium becomes organized. The intraepithelial _Neurog3_TA.LO pool is likely maximally estimated through the use of Neurog3_BAC.Cre;R26R_EYFP lineage labeling, in which we determined that, at E14.5, about one-quarter of the whole Sox9+ epithelium was in the _Neurog3_TA.LO state. These cells were often clustered together, not scattered homogeneously, and scoring specifically plexus-state epithelial cells revealed up to half of them in this state. Our snapshot-type longitudinal analysis leaves open the possibility that any individual area of the plexus might have juvenile, mature, and aged phases in which the proportional representation of _Neurog3_TA.LO cells varies (according to developmental inputs), with all regions at some time passing through a “peak occupancy” period. Regarding our finding that reducing Neurog3 expression led to expansion of the Sox9+ _Neurog3_TA.LO progenitor population and significantly increased its mitotic index, these effects on the _Neurog3_TA.LO pool may also be underestimated by our scoring large regions of epithelium without being able to refer to spatial variations in the relative maturity of individual epithelial regions.
Our findings fit better with aspects of Neurog3 expression data reported in previous literature that were not previously highlighted, providing a new level of clarity regarding the role of Neurog3 in directing endocrine cell production during the secondary transition. Below, we speculate that our findings may indicate an interesting parallel with the role of the Neurog3 sister protein Neurog2 in neuronal development. Taking into account that the final endocrine cell fate choice is thought to have occurred in _Neurog3_-expressing cells (Desgraz and Herrera 2009), future experiments should investigate whether lineage specification/commitment might occur in the _Neurog3_TA.LO endocrine-biased progenitor state. Such information could advance efforts to manipulate human pluripotent stem cell-derived endocrine progenitors into producing specific types and quantities of functional endocrine cells.
Low Neurog3 expression defines an endocrine-biased mitotic progenitor state in Sox9+ cells
Our conclusion that Sox9+ _Neurog3_TA.LO progenitors represent an actively cycling, discrete, endocrine-biased progenitor population is consistent with previous in situ hybridizations using probe cocktails marking early steps of endocrine ontogeny to show broad mRNA distributions across most of the E14.5 epithelium (Zhou et al. 2007). These data corroborate the notion that many intraepithelial cells have entered the endocrine lineage program, maybe even in a relatively concerted manner beyond activating only Neurog3 expression (Zhou et al. 2007). _Neurog3_BAC.Cre-based lineage tracing in wild-type tissue shows that almost all Neurog3+ cells move eventually into the endocrine lineage, with a small percentage adopting nonendocrine acinar or duct lineages (Schonhoff et al. 2004). Furthermore, reducing Neurog3 expression via heterozygous/hypomorphic alleles significantly decreases the degree of endocrine biasing, allowing increased drift to nonendocrine lineages (Wang et al. 2010). Fitting our results with these studies prompts the conclusion that normal _Neurog3_TA.LO cells represent an endocrine-biased progenitor state that retains a small degree of multipotency. It will be interesting to determine, perhaps via single-cell RNA sequencing analysis, whether a low-level “sampling” type of expression activates, in _Neurog3_TA.LO endocrine-biased progenitors, genes lying downstream in the endocrine lineage specification–commitment–differentiation program, such as Insm1A, Pax4, Nkx2.2, and Arx. The notion that _Neurog3_TA.LO progenitors are noncommitted but nonetheless access endocrine pathway programs targeted by Neurog3 is analogous to the concept that, during hematopoiesis, progenitor cells are selectively primed toward multiple lineage programs (Nimmo et al. 2015).
Our confirmation that almost all _Neurog3_TA.HI cells are post-mitotic fits with previous studies demonstrating that high Neurog3 protein levels instruct cell cycle exit and transition to a unipotent precursor state producing an individual endocrine cell type (Desgraz and Herrera 2009). We propose that those previous studies focused on endocrine-committed Neurog3HI cells, not low-level epithelial _Neurog3_TA.LO cells, because certain lineage tracer _Neurog3_Cre driver/reporter pairings (for example, the _Neurog3_Cre;Z/AP reporter system) (Gu et al. 2002) require a higher level of _Neurog3_Cre expression that is reached only during endocrine commitment, thus missing the low-level-expressing intraepithelial cells. It is plausible that the increased ability of the _Neurog3_BAC.Cre (Schonhoff et al. 2004) to switch on _R26R_-based lineage reporters relates to _cis_-regulatory regions present in the BAC transgene that augment the known enhancer promoter elements of Neurog3 (Lee et al. 2001; Ejarque et al. 2013). Likely, our selection of the same Neurog3 BAC used by Schonhoff et al. (2004) in our _Neurog3_RG1 reporter facilitated study of the _Neurog3_TA.LO progenitor population.
Low Neurog3 protein levels promote a mitotic endocrine-biased _Neurog3_TA.LO progenitor state
Our new model is that abundant _Neurog3_TA.LO progenitors are maintained in a mitotic endocrine-biased state within plexus-state epithelial regions until they enter plexus-to-duct resolution (Bankaitis et al. 2015) using, in the interim, symmetric cell division to both maintain the endocrine-biased progenitor state and derive endocrine-committing _Neurog3_TA.HI cells. There was an apparent absence of asymmetric divisions that yield one _Neurog3_TA.LO and one _Neurog3_TA.HI daughter. Recently, Kim et al. (2015) published a real-time analysis of mitotic _Pdx1_GFP- and _Neurog3_RFP-expressing cells. They reported division events for _Pdx1_-expressing cells that were symmetric (for both progenitor renewal and terminal differentiation) and asymmetric (producing one Pdx1+Sox9+ daughter and one Neurog3+ daughter). Similar to our observations, there was no asymmetric division for mitotic _Neurog3_-expressing cells. Furthermore, our results suggest that, at E12.5, perhaps connected to the rapid building and expansion of the incipient plexus-state epithelium occurring at this stage, the proportion of _Neurog3_TA.LO cells undergoing progenitor maintenance divisions relative to terminal differentiation events is higher than at E14.5. Limiting Neurog3 expression in the strong hypomorphic condition increased the mitotic index of Sox9+ _Neurog3_TA.LO progenitors and concurrently expanded their proportional representation within the epithelium at the expense of endocrine commitment (Fig. 6B,C), perhaps reflecting a shift in favor of progenitor-maintaining divisions. Recently, we reported that ablating Neurog3 expression decreased the proliferation rate of the entire Sox9+ epithelium (Bankaitis et al. 2015). Together, these studies support the idea that low Neurog3 protein levels are functionally associated with promoting progenitor-maintaining divisions, sustaining the actively cycling _Neurog3_TA.LO state (Fig. 7B). While reducing Neurog3 protein levels decreases endocrine biasing, particularly in the strong hypomorph context, its complete absence essentially totally ablates endocrine lineage potential (Gradwohl et al. 2000; Johansson et al. 2007; Wang et al. 2010). These observations indicate that the presence of low levels of Neurog3 protein is required to establish and maintain endocrine biasing, as opposed to commitment, in Sox9+ _Neurog3_TA cells.
Potentially important analogies can be drawn regarding these different behaviors driven by Neurog3 and the findings on how low versus high levels of Neurog2 maintain the cycling neural progenitor state or promote cell cycle exit and neural specification (Shimojo et al. 2008; Roybon et al. 2009; Ali et al. 2011; Florio et al. 2012). In those studies, _Neurog2_LO cells were proliferative, while homozygous Neurog2 inactivation stalled stem cell mitotic progression in the G1 phase, and overexpression accelerated cell cycle exit. In cycling progenitors, high Cdk activity and low Cdk inhibitor (Cdki) activity during G2–S–M phases keep Neurog2 in an unstable multiphosphorylated state subject to ubiquitylation-mediated degradation (Vosper et al. 2009; Ali et al. 2011). The low-level phospho-Neurog2 is unable to activate neural specification target genes but activates progenitor-associated targets (Ali et al. 2011; Hindley et al. 2012). In our case, the Sox9+ _Neurog3_TA.LO population comprises cells with low to undetectable Neurog3 protein, and future experimentation could test for Sox9+ _Neurog3_TA.LO progenitors containing low levels of an unstable phospho-Neurog3 protein that is periodically degraded during the cell cycle and is immunodetected, at least with current antibodies, in only a subset of the _Neurog3_-expressing Sox9+ endocrine-biased cells. Neurog3 has been shown to be inherently unstable and subject to the same ubiquitylation-mediated degradation mechanisms as Neurog2 (Roark et al. 2012; Qu et al. 2013). These striking parallels for Neurog2 and Neurog3 predict that low levels of unstable Neurog3 activate a subset of target genes specifically associated with promoting progenitor maintenance and the endocrine-biased state. The low level of Neurog3 expression in the endocrine progenitor context clearly has different consequences compared with the sustained low-level Neurog3 expression in adult β cells that is necessary for physiological function: Neurog3 in mature β cells most likely activates target genes peculiar to quiescent endocrine cells (Wang et al. 2009).
Speculations on mechanisms regulating endocrine commitment vs. progenitor maintenance in _Neurog3_TA.LO progenitors
Several studies show that the length of the G1 phase of the cell cycle can dictate the choice of progenitor maintenance versus lineage specification (Hindley et al. 2012; Pauklin and Vallier 2013; Hardwick et al. 2015). For Neurog2 in neural progenitors, the low Cdk/high Cdki activity and lengthened G1 keep Neurog2 nonphosphorylated/underphosphorylated and stable enough to activate neuronal differentiation targets (Ali et al. 2011). Our model is that Neurog3 protein levels transition from low—sometimes immuno-undetectable but still present and functional—in cycling _Neurog3_TA.LO progenitors to uniformly high in endocrine-committing _Neurog3_TA.HI cells. Moreover, in every terminal differentiation division, we observed the irreversible transition to _Neurog3_TA.HI during what should be G1, ∼3–6 h after parental _Neurog3_TA.LO cell mitosis (Fig. 4; Supplemental Table S3). Moreover, enforcing G1-like conditions with the Cdki p27Kip1 led to significantly increased Neurog3 stability (Roark et al. 2012). In the Neurog3HI state, Neurog3 promotes expression of the Cdki Cdkn1a (Miyatsuka et al. 2011), confirmed by our qRT–PCR analysis, creating a positive feed-forward loop driving cell cycle exit. If Neurog3 behaves like Neurog2, the G1 phase would be mechanistically coupled to Neurog3 accumulation for promoting the transition to endocrine lineage commitment.
We and others reported that altering Neurog3 expression, along with affecting endocrine specification commitment, disturbs the morphological development and maintenance of the epithelial endocrine niche environment (Magenheim et al. 2011; Bankaitis et al. 2015). Therefore, a new viewpoint is emerging—that a vital part of learning how to manipulate endocrine progenitor states (for example, toward sustained in vitro production of endocrine cells of specific fates) will be to understand how the endocrine niche environment integrates intercellular signaling and cell-autonomous programs to regulate specification and commitment. Since Neurog3 protein levels critically regulate progenitor versus endocrine commitment, we judged it important to determine how Neurog3 protein stability and accumulation are regulated in Sox9+ _Neurog3_TA progenitors. We were also interested in the possibility that intraepithelial Neurog3 expression within the _Neurog3_TA.LO population, similar to the Hes1-dependent oscillation of Neurog2 (Shimojo et al. 2008), undergoes dynamic oscillation between low-expressing and off states. Such oscillation might explain why Neurog3 protein falls below a detection threshold in many endocrine-biased progenitors as well as the cumulative labeling of the population using _R26R_-based lineage tracing. Investigating this issue would require novel _Neurog3_-driven reporters with the sensitivity to detect such dynamism. Characterizing these sorts of regulatory influences with increased spatiotemporal resolution could help to define how an endocrine specification commitment program is temporally deployed to generate the multilineage islets of Langerhans.
Materials and methods
Mice
_Neurog3_BAC.Cre [Tg(_Neurog3_-cre)C1Able/J] (Schonhoff et al. 2004) and _ROSA26R_EYFP [B6.129 × 1-Gt(ROSA)26Sor tm1(EYFP)Cos/J] (Srinivas et al. 2001) mice were described previously. _Neurog3_EGFP/+ [B6.129.S-Neurog3 tm1(EGFP)Khk/Mmcd] (Lee et al. 2002) and _Neurog3_FL/+ [Neurog3 _tm1.1(cre/ERT)Ggu_] (Wang et al. 2008) mice from Guoqiang Gu (Vanderbilt University) were described previously. All protocols were approved by the Vanderbilt University Institutional Animal Care and Use Committee. For genotyping primers, see Supplemental Table S5.
Immunodetection
Embryonic dorsal pancreata were fixed with 4% paraformaldehyde for 4–6 h at 4°C. Cryosectioning was done on sucrose-equilibrated (30% overnight at 4°C) OCT-embedded tissue (Tissue-Tek). A Leica CM3050S was used to cut 10-µm tissue sections, which were sequentially placed on three separate sets of slides, each covering ∼33% of the dorsal pancreas. For primary and secondary antibodies, see Supplemental Table S4.
Flow sorting
Multiple E12.5 or E14.5 _Neurog3_RG1+ dorsal pancreata were pooled and treated with Accumax (Sigma) for ∼30–45 min (protocol available on request). Dispersed samples were washed and incubated on ice first with anti-Muc1 antibody for 1 h and then anti-hamster Cy5 secondary antibody for an additional hour. Samples were washed in cold PBS, and DAPI was added to ensure sorting of viable cells. Flow sorting was performed with a BD FACSAria III.
Static image acquisition and time-lapse movies
Unless noted, images are epifluorescence from a Zeiss ApoTome microscope with Zeiss Axiovision software. All scale bars indicate 20 µm. Confocal immunofluorescence images (Fig. 1H) and time-lapse movies were from a Zeiss LSM 510 confocal or LSM 780 two-photon microscope, respectively, analyzed with Zen 2.1 software. For time-lapse imaging, _Neurog3_RG1+ explants were embedded in BD Matrigel (BD Biosciences) and imaged immediately or allowed to attach to bovine fibronectin (50 µg/mL) overnight before imaging. All pancreatic explants were cultured in DMEM (without phenol-red) with 10% FBS, penicillin, and streptomycin (10 U/mL each) at 37°C in an environmentally controlled chamber.
Supplementary Material
Supplemental Material
Acknowledgments
We thank Richard Behringer (Baylor College of Medicine) for the H2BmCherry-peptide-2A-GFPGPI reporter cassette. We thank Anna Means, Guoqiang Gu, Maureen Gannon, Roland Stein, Jake Kushner, and members of the Wright/Gu laboratories for discussions. This work used the Cell Imaging Shared Resource and Transgenic/Embryonic Stem Cell Shared Resource core facilities of the Vanderbilt Diabetes Research and Training Center funded by National Institute of Diabetes and Digestive and Kidney Diseases grant 020593. Flow cytometry was performed in the Vanderbilt University Medical Center Flow Cytometry Shared Resource supported by the Vanderbilt Ingram Cancer Center (P30 CA68485) and the Vanderbilt Digestive Disease Research Center (DK0558404). Generation of _Neurog3_RG1 mice was supported in part by the Beta Cell Biology Consortium Mouse Embryonic Stem Cell Core funded by the National Institute of Diabetes and Digestive and Kidney Diseases (U01DK072473). This study was supported by the National Institutes of Health/National Institute of Diabetes and Digestive and Kidney Diseases (U01DK089570) and an American Heart Association fellowship to M.E.B. (13POST14240011).
Footnotes
Supplemental material is available for this article.
References
- Ali F, Hindley C, McDowell G, Deibler R, Jones A, Kirschner M, Guillemot F, Philpott A. 2011. Cell cycle-regulated multi-site phosphorylation of Neurogenin 2 coordinates cell cycling with differentiation during neurogenesis. Development 138: 4267–4277. [DOI] [PMC free article] [PubMed] [Google Scholar]
- Bankaitis ED, Bechard ME, Wright CVE. 2015. Feedback control of growth, differentiation, and morphogenesis of pancreatic endocrine progenitors in an epithelial plexus niche. Genes Dev 29: 2203–2216. [DOI] [PMC free article] [PubMed] [Google Scholar]
- Bradford JA, Clarke ST. 2011. Dual-pulse labeling using 5-ethynyl-2′-deoxyuridine (Edu) and 5-bromo-2′-deoxyuridine (BrdU) in flow cytometry. Curr Protoc Cytom 55: 7.38.1–7.38.15. [DOI] [PubMed] [Google Scholar]
- Cano DA, Soria B, Martin F, Rojas A. 2014. Transcriptional control of mammalian pancreas organogenesis. Cell Mol Life Sci 71: 2383–2402. [DOI] [PMC free article] [PubMed] [Google Scholar]
- Desgraz R, Herrera PL. 2009. Pancreatic neurogenin 3-expressing cells are unipotent islet precursors. Development 136: 3567–3574. [DOI] [PMC free article] [PubMed] [Google Scholar]
- De Vas MG, Kopp JL, Heliot C, Sander M, Cereghini S, Haumaitre C. 2015. Hnf1b controls pancreas morphogenesis and the generation of Ngn3+ endocrine progenitors. Development 142: 871–882. [DOI] [PMC free article] [PubMed] [Google Scholar]
- Ejarque M, Cervantes S, Pujadas G, Tutusaus A, Sanchez L, Gasa R. 2013. Neurogenin3 cooperates with Foxa2 to autoactivate its own expression. J Biol Chem 288: 11705–11717. [DOI] [PMC free article] [PubMed] [Google Scholar]
- Florio M, Leto K, Muzio L, Tinterri A, Badaloni A, Croci L, Zordan P, Barili V, Albieri I, Guillemot F, et al. 2012. Neurogenin 2 regulates progenitor cell-cycle progression and Purkinje cell dendritogenesis in cerebellar development. Development 139: 2308–2320. [DOI] [PMC free article] [PubMed] [Google Scholar]
- Gradwohl G, Dierich A, LeMeur M, Guillemot F. 2000. Neurogenin3 is required for the development of the four endocrine cell lineages of the pancreas. Proc Natl Acad Sci 97: 1607–1611. [DOI] [PMC free article] [PubMed] [Google Scholar]
- Gu G, Dubauskaite J, Melton DA. 2002. Direct evidence for the pancreatic lineage: NGN3+ cells are islet progenitors and are distinct from duct progenitors. Development 129: 2447–2457. [DOI] [PubMed] [Google Scholar]
- Hardwick LJA, Ali FR, Azzarelli R, Philpott A. 2015. Cell cycle regulation of proliferation versus differentiation in the central nervous system. Cell Tissue Res 359: 187–200. [DOI] [PMC free article] [PubMed] [Google Scholar]
- Hindley C, Ali F, McDowell G, Cheng K, Jones A, Guillemot F, Philpott A. 2012. Post-translational modification of Ngn2 differentially affects transcription of distinct targets to regulate the balance between progenitor maintenance and differentiation. Development 139: 1718–1723. [DOI] [PMC free article] [PubMed] [Google Scholar]
- Johansson KA, Dursun U, Jordan N, Gu G, Beermann F, Gradwohl G, Grapin-Botton A. 2007. Temporal control of neurogenin3 activity in pancreas progenitors reveals competence windows for the generation of different endocrine cell types. Dev Cell 12: 457–465. [DOI] [PubMed] [Google Scholar]
- Kim YH, Larsen HL, Rué P, Lemaire LA, Ferrer J, Grapin-Botton A. 2015. Cell cycle-dependent differentiation dynamics balances growth and endocrine differentiation in the pancreas. PLOS Biol 13: e1002111. [DOI] [PMC free article] [PubMed] [Google Scholar]
- Lee JC, Smith SB, Watada H, Lin J, Scheel D, Wang J, Mirmira RG, German MS. 2001. Regulation of the pancreatic pro-endocrine gene neurogenin3. Diabetes 50: 928–936. [DOI] [PubMed] [Google Scholar]
- Lee CS, Perreault N, Brestelli JE, Kaestner KH. 2002. Neurogenin 3 is essential for the proper specification of gastric enteroendocrine cells and the maintenance of gastric epithelial cell identity. Genes Dev 16: 1488–1497. [DOI] [PMC free article] [PubMed] [Google Scholar]
- Magenheim J, Klein AM, Stanger BZ, Ashery-Padan R, Sosa-Pineda B, Gu G, Dor Y. 2011. Ngn3+ endocrine progenitor cells control the fate and morphogenesis of pancreatic ductal epithelium. Dev Biol 359: 26–36. [DOI] [PMC free article] [PubMed] [Google Scholar]
- Miyatsuka T, Kosaka Y, Kim H, German MS. 2011. Neurogenin3 inhibits proliferation in endocrine progenitors by inducing Cdkn1a. Proc Natl Acad Sci 108: 185–190. [DOI] [PMC free article] [PubMed] [Google Scholar]
- Nimmo RA, May GE, Enver T. 2015. Primed and ready: understanding lineage commitment through single cell analysis. Trends Cell Biol 25: 459–467. [DOI] [PubMed] [Google Scholar]
- Pan FC, Wright C. 2011. Pancreas organogenesis: from bud to plexus to gland. Dev Dyn 240: 530–565. [DOI] [PubMed] [Google Scholar]
- Pauklin S, Vallier L. 2013. The cell-cycle state of stem cells determines cell fate propensity. Cell 155: 135–147. [DOI] [PMC free article] [PubMed] [Google Scholar]
- Puri S, Hebrok M. 2007. Dynamics of embryonic pancreas development using real-time imaging. Dev Biol 306: 82–93. [DOI] [PMC free article] [PubMed] [Google Scholar]
- Qu X, Afelik S, Jensen JN, Bukys MA, Kobberup S, Schmerr M, Xiao F, Nyeng P, Veronica Albertoni M, Grapin-Botton A, et al. 2013. Notch-mediated post-translational control of Ngn3 protein stability regulates pancreatic patterning and cell fate commitment. Dev Biol 376: 1–12. [DOI] [PubMed] [Google Scholar]
- Roark R, Itzhaki L, Philpott A. 2012. Complex regulation controls Neurogenin3 proteolysis. Biol Open 1: 1264–1272. [DOI] [PMC free article] [PubMed] [Google Scholar]
- Roybon L, Hjalt T, Stott S, Guillemot F, Li J-Y, Brundin P. 2009. Neurogenin2 directs granule neuroblast production and amplification while NeuroD1 specifies neuronal fate during hippocampal neurogenesis. PLoS One 4: e4779. [DOI] [PMC free article] [PubMed] [Google Scholar]
- Schonhoff SE, Giel-Moloney M, Leiter AB. 2004. Neurogenin 3-expressing progenitor cells in the gastrointestinal tract differentiate into both endocrine and non-endocrine cell types. Dev Biol 270: 443–454. [DOI] [PubMed] [Google Scholar]
- Seymour PA, Freude KK, Tran MN, Mayes EE, Jensen J, Kist R, Scherer G, Sander M. 2007. SOX9 is required for maintenance of the pancreatic progenitor cell pool. Proc Natl Acad Sci 104: 1865–1870. [DOI] [PMC free article] [PubMed] [Google Scholar]
- Shaner NC, Steinbach PA, Tsien RY. 2005. A guide to choosing fluorescent proteins. Nat Methods 2: 905–909. [DOI] [PubMed] [Google Scholar]
- Shimojo H, Ohtsuka T, Kageyama R. 2008. Oscillations in notch signaling regulate maintenance of neural progenitors. Neuron 58: 52–64. [DOI] [PubMed] [Google Scholar]
- Solar M, Cardalda C, Houbracken I, Martín M, Maestro MA, De Medts N, Xu X, Grau V, Heimberg H, Bouwens L, et al. 2009. Pancreatic exocrine duct cells give rise to insulin-producing β cells during embryogenesis but not after birth. Dev Cell 17: 849–860. [DOI] [PubMed] [Google Scholar]
- Srinivas S, Watanabe T, Lin CS, William CM, Tanabe Y, Jessell TM, Costantini F. 2001. Cre reporter strains produced by targeted insertion of EYFP and ECFP into the ROSA26 locus. BMC Dev Biol 1: 4. [DOI] [PMC free article] [PubMed] [Google Scholar]
- Stephens DJ, Allan VJ. 2003. Light microscopy techniques for live cell imaging. Science 300: 82–86. [DOI] [PubMed] [Google Scholar]
- Teta M, Rankin MM, Long SY, Stein GM, Kushner JA. 2007. Growth and regeneration of adult β cells does not involve specialized progenitors. Dev Cell 12: 817–826. [DOI] [PubMed] [Google Scholar]
- Villasenor A, Chong DC, Cleaver O. 2008. Biphasic Ngn3 expression in the developing pancreas. Dev Dyn 237: 3270–3279. [DOI] [PMC free article] [PubMed] [Google Scholar]
- Vosper JMD, McDowell GS, Hindley CJ, Fiore-Heriche CS, Kucerova R, Horan I, Philpott A. 2009. Ubiquitylation on canonical and non-canonical sites targets the transciption factor neurogenin for ubiquitin-mediated proteolysis. J Biol Chem 284: 15458–15468. [DOI] [PMC free article] [PubMed] [Google Scholar]
- Wang S, Hecksher-Sorensen J, Xu Y, Zhao A, Dor Y, Rosenberg L, Serup P, Gu G. 2008. Myt1 and Ngn3 form a feed-forward expression loop to promote endocrine islet cell differentiation. Dev Biol 317: 531–540. [DOI] [PMC free article] [PubMed] [Google Scholar]
- Wang S, Jensen JN, Seymour PA, Hsu W, Dor Y, Sander M, Magnuson MA, Serup P, Gu G. 2009. Sustained Neurog3 expression in hormone-expressing islet cells is required for endocrine maturation and function. Proc Natl Acad Sci 106: 9715–9720. [DOI] [PMC free article] [PubMed] [Google Scholar]
- Wang S, Yan J, Anderson DA, Xu Y, Kanal MC, Cao Z, Wright CVE, Gu G. 2010. Neurog3 gene dosage regulates allocation of endocrine and exocrine cell fates in the developing mouse pancreas. Dev Biol 339: 26–37. [DOI] [PMC free article] [PubMed] [Google Scholar]
- Wilkinson G, Dennis D, Schuurmans C. 2013. Proneural genes in neocortical development. Neuroscience 253: 256–273. [DOI] [PubMed] [Google Scholar]
- Zhang H, Tweedie E, Pope CF, Washington MK, Hipkens S, Means AL, Path G, Seufert J, Costa RH, Leiter AB, et al. 2009. Multiple, temporal-specific roles for HNF6 in pancreatic endocrine and ductal differentiation. Mech Dev 126: 958–973. [DOI] [PMC free article] [PubMed] [Google Scholar]
- Zhou Q, Law AC, Rajagopal J, Anderson WJ, Gray PA, Melton DA. 2007. A multipotent progenitor domain guides pancreatic organogenesis. Dev Cell 13: 103–114. [DOI] [PubMed] [Google Scholar]
Associated Data
This section collects any data citations, data availability statements, or supplementary materials included in this article.
Supplementary Materials
Supplemental Material