Manage Properties of Custom UI Components Programmatically - MATLAB & Simulink (original) (raw)
When you develop a custom UI component as a subclass of theComponentContainer base class, you can use certain techniques to make your code more robust, efficient, and user-friendly. These techniques focus on how you define and manage the properties of your class. Use any that are helpful for the type of component you want to create and the user experience you want to provide.
- Initialize Property Values — Set the default state of the UI component in case your users call the implicit constructor without any input arguments.
- Validate Property Values — Ensure that the values are valid before using them.
- Customize the Property Display — Provide a customized list of properties in the Command Window when a user references the UI component object without a semicolon.
- Optimize the update Method — Improve the performance of the
updatemethod when only a subset of your properties are used in a time-consuming calculation.
For an example of these techniques, see Example: Optimized Polynomial Fit UI Component with Customized Property Display.
In addition, there are certain considerations and limitations to keep in mind if you want to use your custom UI component in App Designer, or share your component with users who develop apps in App Designer. These considerations are listed on a separate page, inConfigure Custom UI Components for App Designer.
Initialize Property Values
Assign default values for all of the public properties of your class. This allows MATLAB to create a valid UI component even if the user omits some name-value arguments when they call the constructor method.
For UI components that contain a chart and have properties that store coordinate data, set the initial values to NaN values or empty arrays so that the default chart is empty when the user does not specify the coordinates.
Validate Property Values
Before your code uses property values, confirm that they have the correct size and class. For example, this property block validates the size and class of three properties.
properties LineColor {validateattributes(LineColor,{'double'}, ... {'<=',1,'>=',0,'size',[1 3]})} = [1 0 0] XData (1,:) double = NaN YData (1,:) double = NaN end
LineColor must be a 1-by-3 array of classdouble, where each value is in the range[0,1]. Both XData andYData must be row vectors of classdouble.
You can also validate properties that store the underlying component objects in your UI component. To do this, you need to know the correct class name for each object. To determine the class name of an object, call the corresponding UI component function at the command line, and then call the class function to get the class name. For example, if you plan to create a drop-down component in your setup method, call the uidropdown function at the command line with an output argument. Then, pass the output to theclass function to get its class name.
dd = uidropdown; class(d)
ans =
'matlab.ui.control.DropDown'Use the output of the class function to validate the class for the corresponding property in your class. Specify the class after the property name. For example, the following property stores a DropDown object and validates its class.
properties (Access = private, Transient, NonCopyable) DropDown matlab.ui.control.DropDown end
Occasionally, you might want to define a property that can store different shapes and classes of values. For example, if you define a property that can store a character vector, cell array of character vectors, or string array, omit the size and class validation or use a custom property validation method. For more information about validating properties, see Validate Property Values.
Customize the Property Display
One of the benefits of defining your UI component as a subclass of theComponentContainer base class is that it also inherits from the matlab.mixin.CustomDisplay class. This lets you customize the list of properties MATLAB® displays in the Command Window when you reference the UI component without a semicolon. To customize the property display, overload the getPropertyGroups method. Within that method, you can customize which properties are listed and the order of the list. For example, consider a FitPlot class that has the following public properties.
properties LineColor {validateattributes(LineColor,{'double'}, ... {'<=',1,'>=',0,'size',[1 3]})} = [1 0 0] XData (1,:) double = NaN YData (1,:) double = NaN end
The following getPropertyGroups method specifies the scalar object property list as XData, YData, andLineColor.
function propgrp = getPropertyGroups(comp)
if ~isscalar(comp)
% List for array of objects
propgrp = getPropertyGroups@matlab.mixin.CustomDisplay(comp);
else
% List for scalar object
propList = {'XData','YData','LineColor'};
propgrp = matlab.mixin.util.PropertyGroup(propList);
end
end
When the user references an instance of this UI component without a semicolon, MATLAB displays the customized list.
p =
FitPlot with properties:
XData: NaN
YData: NaN
LineColor: [1 0 0]
For more information about customizing the property display, see Customize Property Display.
Optimize the update Method
In most cases, the update method of your class reconfigures all the relevant aspects of your UI component that depend on the public properties. Sometimes, the reconfiguration involves an expensive calculation that is time consuming. If the calculation involves only a subset of the properties, you can design your class to execute that code only when it is necessary.
One way to optimize the update method is to add these elements to your class:
- A private property called
ExpensivePropChangedthat accepts alogicalvalue. This property indicates whether any of the properties used in the expensive calculation have changed. - A
setmethod for each property involved in the expensive calculation. Within eachsetmethod, set theExpensivePropChangedproperty totrue. - A protected method called
doExpensiveCalculationthat performs the expensive calculation. - A conditional statement in the
updatemethod that checks the value ofExpensivePropChanged. If the value istrue, executedoExpensiveCalculation.
The following code provides a template for this design.
classdef OptimizedUIComponent < matlab.ui.componentcontainer.ComponentContainer
properties
    Prop1
    Prop2
end
properties(Access=private,Transient,NonCopyable)
    ExpensivePropChanged (1,1) logical = true
end

methods(Access = protected)
    function setup(comp)
        % Configure UI component
        % ...
    end
    function update(comp)
        % Perform expensive computation if needed
        if comp.ExpensivePropChanged
            doExpensiveCalculation(comp);
            comp.ExpensivePropChanged = false;
        end

        % Update other aspects of UI component
        % ...
    end
    function doExpensiveCalculation(comp)
        % Expensive code
        % ...
    end
end

methods
    function set.Prop2(comp,val)
        comp.Prop2 = val;
        comp.ExpensivePropChanged = true;
    end
end
end
In this case, Prop2 is involved in the expensive calculation. The set.Prop2 method sets the value of Prop2, and then it sets ExpensivePropChanged to true. The next time the update method runs, it callsdoExpensiveCalculation only ifExpensivePropChanged is true. Then, theupdate method continues to update other aspects of the UI component.
Example: Optimized Polynomial Fit UI Component with Customized Property Display
This example defines a FitPlot class for interactively displaying best fit polynomials, and uses all four of these best practices. The properties defined in the properties block have default values and use size and class validation. The getPropertyGroups method defines a custom order for the property display. The changeFit method performs the potentially expensive polynomial fit calculation, and the update method executes changeFit only if the plotted data changed.
To define this class, save the FitPlot class definition to a file named FitPlot.m in a folder that is on the MATLAB path.
classdef FitPlot < matlab.ui.componentcontainer.ComponentContainer % Choose a fit method for your plotted data
properties
    LineColor {validateattributes(LineColor,{'double'}, ...
        {'<=',1,'>=',0,'size',[1 3]})} = [1 0 0]
    XData (1,:) double = NaN
    YData (1,:) double = NaN
end

properties (Access = private, Transient, NonCopyable)
    DropDown matlab.ui.control.DropDown
    Axes matlab.ui.control.UIAxes
    GridLayout matlab.ui.container.GridLayout
    DataLine (1,1) matlab.graphics.chart.primitive.Line
    FitLine (1,1) matlab.graphics.chart.primitive.Line
    FitXData (1,:) double
    FitYData (1,:) double
    ExpensivePropChanged (1,1) logical = true
end

methods (Access=protected)
    function setup(comp)
        % Set the initial position of this component
        comp.Position = [100 100 300 300];

        % Create the grid layout, drop-down, and axes
        comp.GridLayout = uigridlayout(comp,[2,1], ...
            'RowHeight',{20,'1x'},...
            'ColumnWidth',{'1x'});
        comp.DropDown = uidropdown(comp.GridLayout, ...
            'Items',{'None','Linear','Quadratic','Cubic'}, ...
            'ValueChangedFcn',@(s,e) changeFit(comp));
        comp.Axes = uiaxes(comp.GridLayout);

        % Create the line objects
        comp.DataLine = plot(comp.Axes,NaN,NaN,'o');
        hold(comp.Axes,'on');
        comp.FitLine = plot(comp.Axes,NaN,NaN);
        hold(comp.Axes,'off');
    end

    function update(comp)
        % Update data points
        comp.DataLine.XData = comp.XData;
        comp.DataLine.YData = comp.YData;

        % Do an expensive operation
        if comp.ExpensivePropChanged
            comp.changeFit();
            comp.ExpensivePropChanged = false;
        end

        % Update the fit line
        comp.FitLine.Color = comp.LineColor;
        comp.FitLine.XData = comp.FitXData;
        comp.FitLine.YData = comp.FitYData;
    end

    function changeFit(comp)
        % Calculate the fit line based on the drop-down value
        if strcmp(comp.DropDown.Value,'None')
            comp.FitXData = NaN;
            comp.FitYData = NaN;
        else
            switch comp.DropDown.Value
                case 'Linear'
                    f = polyfit(comp.XData,comp.YData,1);
                case 'Quadratic'
                    f = polyfit(comp.XData,comp.YData,2);
                case 'Cubic'
                    f = polyfit(comp.XData,comp.YData,3);
            end
            comp.FitXData = linspace(min(comp.XData),max(comp.XData));
            comp.FitYData = polyval(f,comp.FitXData);
        end
    end

    function propgrp = getPropertyGroups(comp)
        if ~isscalar(comp)
            % List for array of objects
            propgrp = getPropertyGroups@matlab.mixin.CustomDisplay(comp);
        else
            % List for scalar object
            propList = {'XData','YData','LineColor'};
            propgrp = matlab.mixin.util.PropertyGroup(propList);
        end
    end

end

methods
    function set.XData(comp,val)
        comp.XData = val;
        comp.ExpensivePropChanged = true;
    end
    function set.YData(comp,val)
        comp.YData = val;
        comp.ExpensivePropChanged = true;
    end
end
end
Define some sample data and use it to create an instance ofFitPlot.
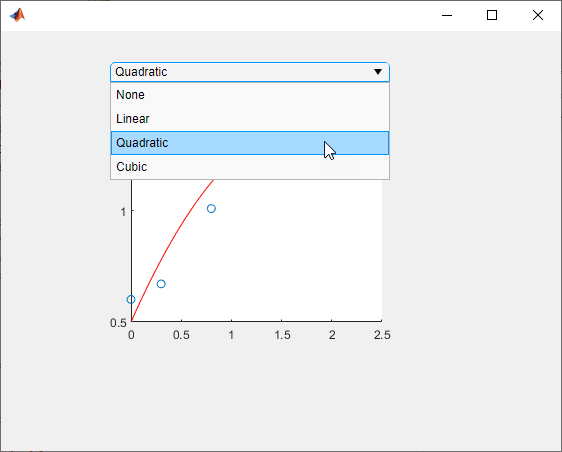
x = [0 0.3 0.8 1.1 1.6 2.3]; y = [0.6 0.67 1.01 1.35 1.47 1.25]; p = FitPlot('XData',x,'YData',y)
ans =
FitPlot with properties:
    XData: [1×43 double]
    YData: [1×43 double]
LineColor: [1 0 0]
Use the drop-down to display the quadratic best fit curve.
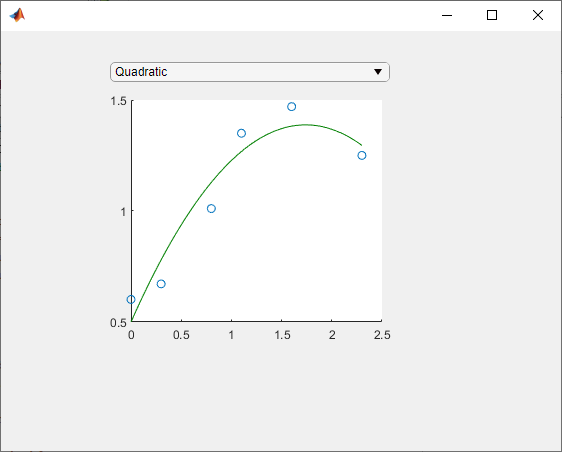
Set the LineColor property to change the color of the best fit curve to green.