Enabling Convenience Functions for Setting Axes Properties - MATLAB & Simulink (original) (raw)
When you develop a chart as a subclass of the ChartContainer class, consider enabling some of the MATLAB® convenience functions for setting properties on the axes. For example, you can design your class to support the title function. By enabling convenience functions, you provide a user experience that is consistent with the MATLAB plotting functions.
Support for Different Types of Properties
The way you enable a convenience function depends on whether the function controls a noncomputed property or a computed property. This table lists the convenience functions you can support.
| Convenience Function | Associated Axes Property | Type of Property |
|---|---|---|
| title,subtitle | Title,Subtitle | Noncomputed |
| xlabel,ylabel,zlabel | XLabel, YLabel, and ZLabel, respectively | Noncomputed |
| xlim,ylim,zlim | XLim, YLim, and ZLim, respectively | Computed |
| xticks, yticks,zticks | XTick, YTick, and ZTick, respectively | Computed |
| xticklabels,yticklabels, zticklabels | XTickLabel,YTickLabel, andZTickLabel, respectively | Computed |
| view | View | Computed |
Enable Functions for Noncomputed Properties
Noncomputed properties are fixed values. They do not change until a user or your code changes them explicitly.
To enable a convenience function for a noncomputed property, define a public property in your class that stores the value of axes property you want to control. Then define a public method that has the same name and supports the same calling syntaxes as the convenience function you want to support. Add a line of code to the method that sets the value of the property. For example, consider a class that has a public property called TitleText for storing the title. The following code shows the title method for the class.
function title(obj,txt) obj.TitleText = txt; end
Next, add a line of code to the update method that calls the MATLAB convenience function to set the corresponding axes property.
title(getAxes(obj),obj.TitleText);
After you perform the preceding steps and save your class file, you can create an instance of your chart and call the title function to display a title. Doing so triggers this calling sequence:
- The
titlemethod on the class sets theTitleTextproperty, which marks the chart for updating. - The next time
drawnowexecutes, theupdatemethod executes and calls thetitlefunction on the axes. - The
titlefunction updates theTitleproperty on the axes.
Enable Functions for Computed Properties
Computed properties are controlled by the axes. The axes recomputes their values depending on the content of the axes and the underlying data.
To enable a convenience function for a computed property, define a method that has the same name and calling syntax as the convenience function you want to enable. Inside that method, call the convenience function and specify the axes as the first argument. For example, to enable the xlim function, define a method called xlim in your class. Since thexlim function accepts a variable number of input arguments, you must specify varargin as the second input argument. Thexlim function also supports a variable number of output arguments, so you must specify [varargout{1:nargout}] to support those arguments.
function varargout = xlim(obj,varargin) ax = getAxes(obj); [varargout{1:nargout}] = xlim(ax,varargin{:}); end
To provide access to the corresponding property values on your chart, define two dependent properties on your class. The first property provides access to the value that the convenience function controls. The other property provides access to the mode property, which indicates how the first property is controlled. The mode property can have a value of 'auto' or'manual'. Define these properties as dependent so that the chart does not store the values. The axes controls and stores these values. For example, to provide access to the XLim andXLimMode properties on the axes, define a pair of dependent properties called XLimits andXLimitsMode.
properties (Dependent) XLimits (1,2) double XLimitsMode {mustBeMember(XLimitsMode,{'auto','manual'})} end
Next, define the set and get methods for each dependent property. Within each method, set the corresponding axes property. The following code shows the set methods andget methods for the XLimits andXLimitsMode properties.
function set.XLimits(obj,xlm) ax = getAxes(obj); ax.XLim = xlm; end function xlm = get.XLimits(obj) ax = getAxes(obj); xlm = ax.XLim; end function set.XLimitsMode(obj,xlmmode) ax = getAxes(obj); ax.XLimMode = xlmmode; end function xlm = get.XLimitsMode(obj) ax = getAxes(obj); xlm = ax.XLimMode; end
After you perform the preceding steps and save your class file, you can create an instance of your chart and call the xlim function to change the_x_-axis limits in the chart. The xlim method executes, which in turn calls the xlim function to update the XLim property on the axes.
Note
By default, MATLAB does not store any changes when the user calls thexlim and ylim functions. As a consequence, this example is not supported in the Live Editor. To support the Live Editor and workflows that involve saving and loading changes, see Saving and Loading Instances of Chart Classes.
Chart Class That Supports title, xlim, and ylim Functions
This example shows how to define a class of charts that supports the title, xlim, and ylim functions. The following code demonstrates how to:
- Define a
TitleTextproperty and implement atitlemethod so that instances of the chart support thetitlefunction. - Implement the
xlimandylimmethods so that instances of the chart support thexlimandylimfunctions. - Define properties that allow the user to get and set the _x_- and _y_-axis limits.
- Combine
BarandErrorBarobjects into a single chart.
To define the class, copy this code into the editor and save it with the name BarErrorBarChart.m in a writable folder.
classdef BarErrorBarChart < matlab.graphics.chartcontainer.ChartContainer properties XData (1,:) double = NaN YData (1,:) double = NaN EData (1,:) double = NaN TitleText (:,:) char = '' end properties (Dependent) % Provide properties to support setting & getting XLimits (1,2) double XLimitsMode {mustBeMember(XLimitsMode,{'auto','manual'})} YLimits (1,2) double YLimitsMode {mustBeMember(YLimitsMode,{'auto','manual'})} end properties (Access = private) BarObject (1,1) matlab.graphics.chart.primitive.Bar ErrorBarObject (1,1) matlab.graphics.chart.primitive.ErrorBar end
methods(Access = protected)
    function setup(obj)
        ax = getAxes(obj);
        obj.BarObject = bar(ax,NaN,NaN);
        hold(ax,'on')
        obj.ErrorBarObject = errorbar(ax,NaN,NaN,NaN);
        obj.ErrorBarObject.LineStyle = 'none';
        obj.ErrorBarObject.LineWidth = 2;
        obj.ErrorBarObject.Color = [0.6 0.7 1];
        hold(ax,'off');
    end
    function update(obj)
        % Update Bar and ErrorBar XData and YData
        obj.BarObject.XData = obj.XData;
        obj.BarObject.YData = obj.YData;
        obj.ErrorBarObject.XData = obj.XData;
        obj.ErrorBarObject.YData = obj.YData;

        % Update ErrorBar delta values
        obj.ErrorBarObject.YNegativeDelta = obj.EData;
        obj.ErrorBarObject.YPositiveDelta = obj.EData;

        % Update axes title
        ax = getAxes(obj);
        title(ax,obj.TitleText);
    end
end

methods
    % xlim method
    function varargout = xlim(obj,varargin)
        ax = getAxes(obj);
        [varargout{1:nargout}] = xlim(ax,varargin{:});
    end
    % ylim method
    function varargout = ylim(obj,varargin)
        ax = getAxes(obj);
        [varargout{1:nargout}] = ylim(ax,varargin{:});
    end
    % title method
    function title(obj,txt)
        obj.TitleText = txt;
    end

    % set and get methods for XLimits and XLimitsMode
    function set.XLimits(obj,xlm)
        ax = getAxes(obj);
        ax.XLim = xlm;
    end
    function xlm = get.XLimits(obj)
        ax = getAxes(obj);
        xlm = ax.XLim;
    end
    function set.XLimitsMode(obj,xlmmode)
        ax = getAxes(obj);
        ax.XLimMode = xlmmode;
    end
    function xlm = get.XLimitsMode(obj)
        ax = getAxes(obj);
        xlm = ax.XLimMode;
    end

    % set and get methods for YLimits and YLimitsMode
    function set.YLimits(obj,ylm)
        ax = getAxes(obj);
        ax.YLim = ylm;
    end
    function ylm = get.YLimits(obj)
        ax = getAxes(obj);
        ylm = ax.YLim;
    end
    function set.YLimitsMode(obj,ylmmode)
        ax = getAxes(obj);
        ax.YLimMode = ylmmode;
    end
    function ylm = get.YLimitsMode(obj)
        ax = getAxes(obj);
        ylm = ax.YLimMode;
    end
end
end
After saving BarErrorBarChart.m, create an instance of the chart.
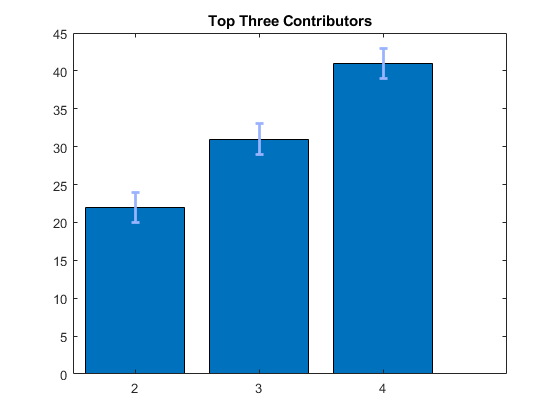
BarErrorBarChart('XData',[1 2 3 4],'YData',[11 22 31 41],'EData',[2 2 2 2]);

Specify a title by calling the title function. Then zoom into the last three bars by calling the xlim function.
title('Top Three Contributors') xlim([1.5 5])