zlabel - Label z-axis - MATLAB (original) (raw)
Syntax
Description
zlabel([txt](#btppucx-1%5Fsep%5Fshared-txt)) labels the _z_-axis of the current axes with the text, txt. Reissuing the zlabel command causes the new label to replace the old label.
zlabel([txt](#btppucx-1%5Fsep%5Fshared-txt),[Name,Value](#namevaluepairarguments)) additionally specifies the text object properties using one or more Name,Value pair arguments.
zlabel([ax](#btppucx-1-ax),___)adds the label to the axes specified by ax. This syntax allows you to specify the axes to which to add a label. ax can precede any of the input argument combinations in the previous syntaxes.
[h](#btppucx-1-h) = zlabel(___)returns the handle to the text object used as the _z_-axis label. The handle is useful when making future modifications to the label.
Examples
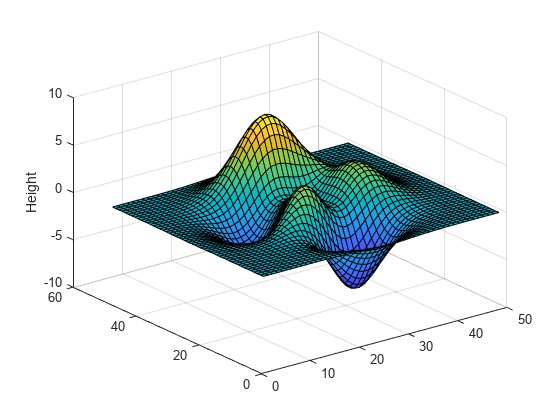
surf(peaks) zlabel('Height')

figure surf(peaks) zlabel(123)

MATLAB® displays 123 beside the _z_-axis.
Create a multiline label using a multiline cell array.
figure surf(peaks) zlabel({'First Line';'Second Line'})

Use Name,Value pairs to set the font size, font weight, and text color properties of the _z_-axis label.
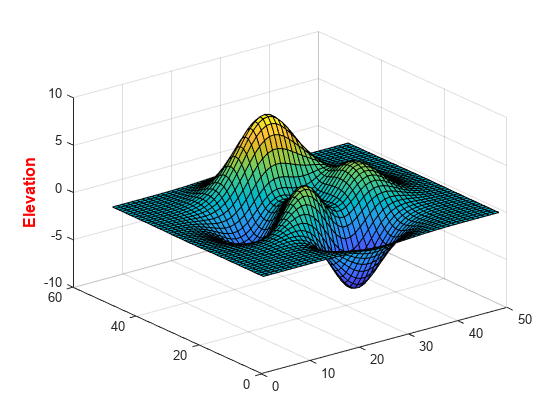
figure surf(peaks) zlabel('Elevation','FontSize',12,... 'FontWeight','bold','Color','r')

'FontSize',12 displays the label text in 12-point font. 'FontWeight','bold' makes the text bold. 'Color','r' sets the text color to red.
Starting in R2019b, you can display a tiling of plots using the tiledlayout and nexttile functions. Call the tiledlayout function to create a 2-by-1 tiled chart layout. Call the nexttile function to create the axes objects ax1 and ax2. Create two surface plots, and add a _z_-axis label to the second plot by specifying ax2 as the first input argument to zlabel.
tiledlayout(2,1) ax1 = nexttile; surf(ax1,peaks(30))
ax2 = nexttile; surf(ax2,peaks(45)) zlabel(ax2,'Height')

Label the _z_-axis and return the text object used as the label.
surf(peaks) t = zlabel('Population Change');

Set the color of the label to red. Use dot notation to set properties.

Input Arguments
Target axes, specified as an Axes object or an array ofAxes objects.
If you do not specify this argument, then zlabel modifies the current axes.
Name-Value Arguments
Specify optional pairs of arguments asName1=Value1,...,NameN=ValueN, where Name is the argument name and Value is the corresponding value. Name-value arguments must appear after other arguments, but the order of the pairs does not matter.
Before R2021a, use commas to separate each name and value, and enclose Name in quotes.
Example: 'Color','red','FontSize',12 specifies red, 12-point font.
In addition to the following, you can specify other text object properties using Name,Value pair arguments. See Text Properties.
Font size, specified as a scalar value greater than 0 in point units. One point equals 1/72 inch. To change the font units, use the FontUnits property.
Setting the font size properties for the associated axes also affects the label font size. The label font size updates to equal the axes font size times the label scale factor. The FontSize property of the axes contains the axes font size. The LabelFontSizeMultiplier property of the axes contains the label scale factor. By default, the axes font size is 10 points and the scale factor is 1.1, so the _z_-axis label font size is 11 points.
Data Types: single | double | int8 | int16 | int32 | int64 | uint8 | uint16 | uint32 | uint64
Text color, specified as an RGB triplet, a hexadecimal color code, a color name, or a short name.
For a custom color, specify an RGB triplet or a hexadecimal color code.
- An RGB triplet is a three-element row vector whose elements specify the intensities of the red, green, and blue components of the color. The intensities must be in the range
[0,1], for example,[0.4 0.6 0.7]. - A hexadecimal color code is a string scalar or character vector that starts with a hash symbol (
#) followed by three or six hexadecimal digits, which can range from0toF. The values are not case sensitive. Therefore, the color codes"#FF8800","#ff8800","#F80", and"#f80"are equivalent.
Alternatively, you can specify some common colors by name. This table lists the named color options, the equivalent RGB triplets, and the hexadecimal color codes.
| Color Name | Short Name | RGB Triplet | Hexadecimal Color Code | Appearance |
|---|---|---|---|---|
| "red" | "r" | [1 0 0] | "#FF0000" |  |
| "green" | "g" | [0 1 0] | "#00FF00" |  |
| "blue" | "b" | [0 0 1] | "#0000FF" |  |
| "cyan" | "c" | [0 1 1] | "#00FFFF" |  |
| "magenta" | "m" | [1 0 1] | "#FF00FF" |  |
| "yellow" | "y" | [1 1 0] | "#FFFF00" |  |
| "black" | "k" | [0 0 0] | "#000000" |  |
| "white" | "w" | [1 1 1] | "#FFFFFF" |  |
| "none" | Not applicable | Not applicable | Not applicable | No color |
This table lists the default color palettes for plots in the light and dark themes.
| Palette | Palette Colors |
|---|---|
| "gem" — Light theme default_Before R2025a: Most plots use these colors by default._ |  |
| "glow" — Dark theme default |  |
You can get the RGB triplets and hexadecimal color codes for these palettes using the orderedcolors and rgb2hex functions. For example, get the RGB triplets for the "gem" palette and convert them to hexadecimal color codes.
RGB = orderedcolors("gem"); H = rgb2hex(RGB);
Before R2023b: Get the RGB triplets using RGB = get(groot,"FactoryAxesColorOrder").
Before R2024a: Get the hexadecimal color codes using H = compose("#%02X%02X%02X",round(RGB*255)).
Example: 'blue'
Example: [0 0 1]
Example: '#0000FF'
Text orientation, specified as a scalar value in degrees. A rotation value of 0 degrees makes the text horizontal. For vertical text, set this property to 90 or -90. Positive values rotate the text counterclockwise. Negative values rotate the text clockwise.
Data Types: single | double | int8 | int16 | int32 | int64 | uint8 | uint16 | uint32 | uint64
Output Arguments
Text object used as the _z_-axis label. Use h to access and modify properties of the label after its created.
Tips
- By default, the
Interactionsproperty containseditInteractionso the text can be edited by clicking on the text. To disable this interaction, set theInteractionsproperty of the text object to[].
Version History
Introduced before R2006a