colororder - Set or query color order palette - MATLAB (original) (raw)
Set or query color order palette
Syntax
Description
Set Colors
colororder([colorarray](#mw%5Fa3ac0dbb-c8d8-48c9-977c-1bfa84840b08)) sets the palette for the current figure's color order. The color order controls the ordering of the colors MATLAB® uses for plotting multiple data series within an axes.
Specify colorarray as a matrix of RGB triplets or an array of color names such as ["red" "green" "blue"]. If a figure does not exist, MATLAB creates a figure and sets the palette for that figure. When you set the palette for a figure, you set the palette for all the axes within that figure.
colororder([palettename](#mw%5F1a03864a-b9cc-4ad1-bb79-c6980b1d3e07)) specifies the colors as one of the predefined palette names, such as "gem","glow", or "sail". (since R2023b)
colororder([target](#mw%5F6f4583d7-f399-4f15-ac96-de5fd59d2f80),___) sets the palette for the target figure, axes, or chart instead of the current figure.
Get Colors
C = colororder returns the color matrix for the current figure.
C = colororder([target](#mw%5F6f4583d7-f399-4f15-ac96-de5fd59d2f80)) returns the color matrix for the target figure, axes, or chart.
Examples
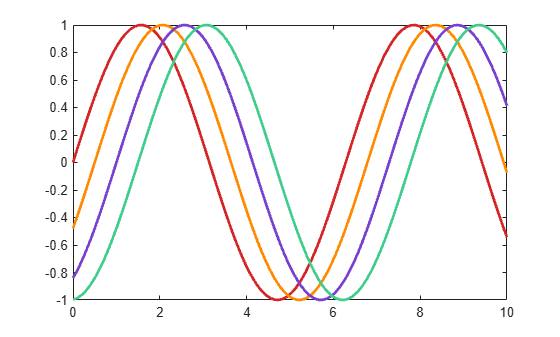
Set the color order for the figure to four colors. Define an _x_-coordinate vector and four _y_-coordinate vectors. Then plot each set of coordinates.
newcolors = [0.83 0.14 0.14 1.00 0.54 0.00 0.47 0.25 0.80 0.25 0.80 0.54];
colororder(newcolors)
% Define coordinates x = linspace(0,10); y1 = sin(x); y2 = sin(x-0.5); y3 = sin(x-1); y4 = sin(x-1.5);
% Plot coordinates plot(x,y1,'LineWidth',2) hold on plot(x,y2,'LineWidth',2) plot(x,y3,'LineWidth',2) plot(x,y4,'LineWidth',2) hold off
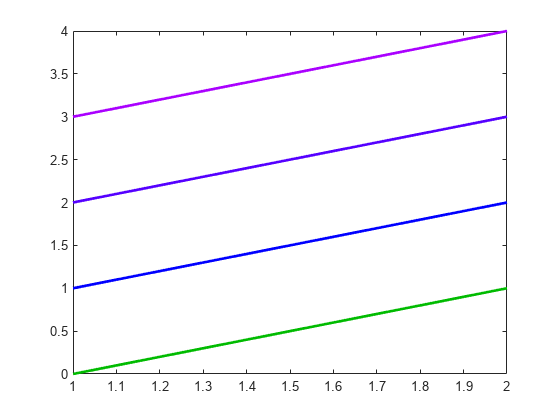
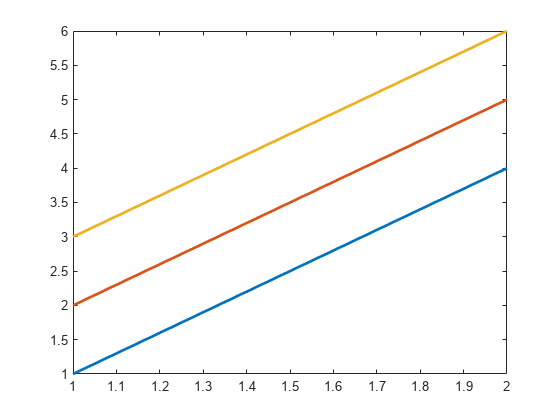
Create a vector of _x_-coordinates and a matrix of _y_-coordinates. Then plot the coordinates.
x = [1 2]; y = [0 1 2 3; 1 2 3 4]; plot(x,y,"LineWidth",2)

Change the colors of the plot by passing four hexadecimal color codes to the colororder function.
newcolors = ["#0B0" "#00F" "#50F" "#A0F"]; colororder(newcolors)
You can also specify one of several named color palettes. Change the colors to the palette named sail.

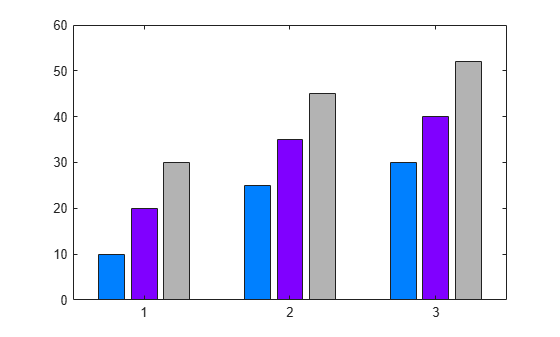
Display three series of bars. Then set the color order to blue, purple, and gray.
bar([10 20 30; 25 35 45; 30 40 52]) newcolors = [0 0.5 1; 0.5 0 1; 0.7 0.7 0.7]; colororder(newcolors)
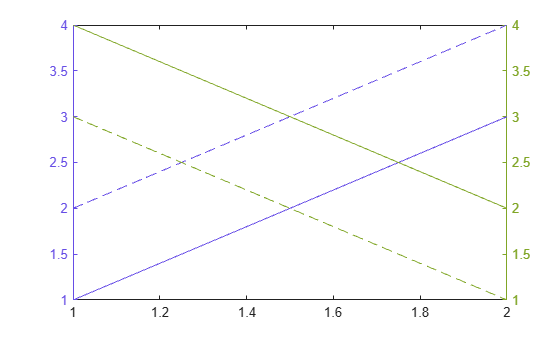
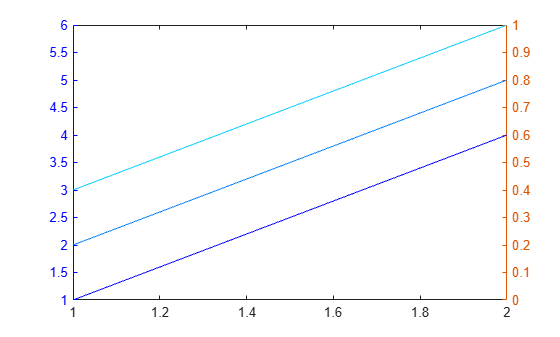
Setting the color order for the figure before calling yyaxis sets the color for each _y_-axis. The left side uses the first color, and the right side uses the second color. If you specify more than two colors, the additional colors are not used by either side.
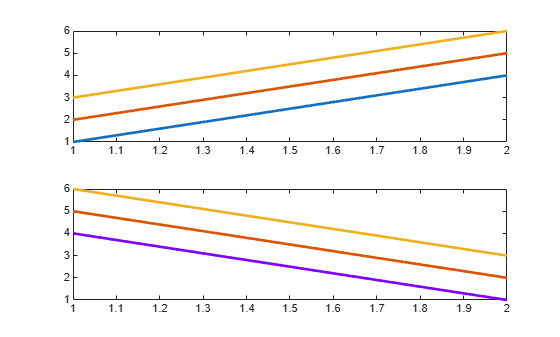
Define newcolors as a matrix containing two RGB triplets. Set the color order for the figure, and plot two lines against the left side. Then plot two lines against the right side.
newcolors = [0.40 0.30 0.90; 0.50 0.65 0.15]; colororder(newcolors)
% Left side yyaxis left plot([1 2; 3 4])
% Right side yyaxis right plot([4 3; 2 1])
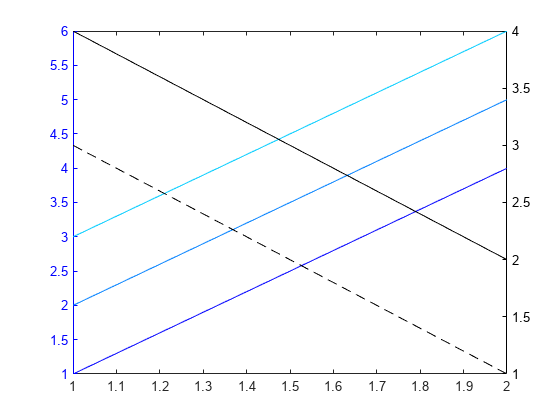
Setting the color order for the figure after calling yyaxis sets the color for the active side.
Activate the left _y_-axis and plot three lines. Set the line style order to one solid line and change the _y_-axis color to blue. Then set the color order to three shades of blue.
% Left side yyaxis left plot([1 2 3; 4 5 6]) ax = gca; ax.LineStyleOrder = '-'; ax.YColor = 'blue'; leftcolors = [0 0 1; 0 0.50 1; 0 0.80 1]; colororder(leftcolors)
Activate the right _y_-axis and plot two lines. Change the _y_-axis color to black. Then set the color order to black.
% Right side yyaxis right plot([4 3; 2 1]) ax.YColor = 'black'; colororder('black')
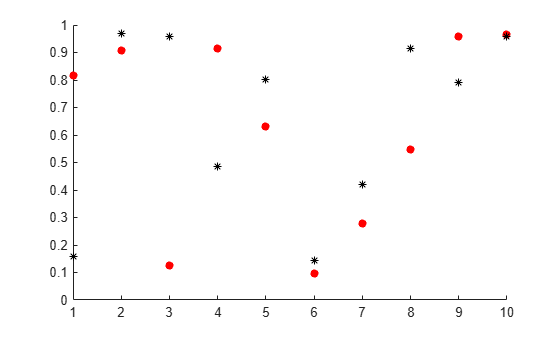
When you call a plotting function with a color argument, the plotting function uses that color instead of the next color in the color order.
Set the color order of the figure to red, magenta, and blue. Call the scatter function to plot a series of scattered points. Then plot a second series of points, and specify the markers as black asterisks.
newcolors = {'red','magenta','blue'}; colororder(newcolors) scatter(1:10,rand(1,10),'filled') hold on scatter(1:10,rand(1,10),'*k')
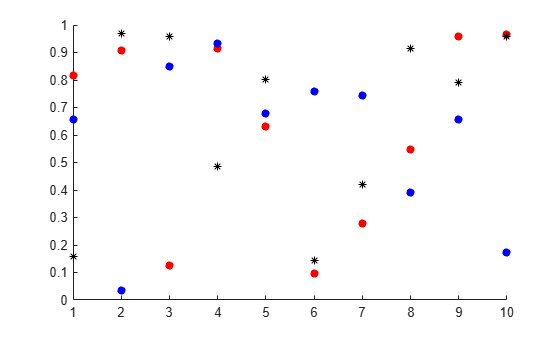
Plot a third series of points without specifying the marker color. Notice that this series uses the third color in the color order, which is blue.
scatter(1:10,rand(1,10),'filled') hold off
Create a tiled chart layout and plot three lines in the first tile.
tiledlayout('flow') nexttile plot([1 2 3; 4 5 6],'LineWidth',2)
Call the nexttile function with a return argument to get the axes object for the second tile. Plot three lines in the second tile. Then get the color order matrix for the axes and return the output in C. Change the first color in C to purple, and set the axes color order to the modified C matrix.
ax = nexttile; plot(ax,[4 5 6; 1 2 3],'LineWidth',2) C = colororder(ax); C(1,:) = [0.5 0 1]; colororder(ax,C)
Since R2023b
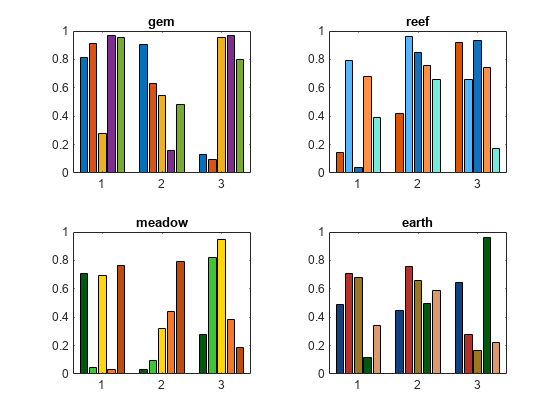
Named palettes provide a convenient way to change the colors of a chart. This example compares four different palettes in a tiled chart layout.
Create a tiled chart layout containing one axes object by calling the nexttile function. Then create a bar chart of random numbers using the default palette, gem.
nexttile bar(rand(3,5)) title("gem")

Create three more bar charts using the reef, meadow, and earth palettes. To specify the colors for the different axes, you must pass the axes object to the colororder function. To get the axes objects, specify an output argument when you call nexttile.
ax2 = nexttile; bar(rand(3,5)) colororder(ax2,"reef") title("reef")
ax3 = nexttile; bar(rand(3,5)) colororder(ax3,"meadow") title("meadow")
ax4 = nexttile; bar(rand(3,5)) colororder(ax4,"earth") title("earth")
Input Arguments
Color array, specified as a matrix of RGB triplets, an array of color names.
Matrix of RGB Triplets
Specify an m-by-3 matrix, where each row is an RGB triplet. An RGB triplet is a three-element vector containing the intensities of the red, green, and blue components of a color. The intensities must be in the range [0,1]. For example, this matrix defines the new colors as blue, dark green, and orange:
colorarray = [1.0 0.0 0.0 0.0 0.4 0.0 1.0 0.5 0.0];
Array of Color Names or Hexadecimal Color Codes
Specify any combination of color names, short names, or hexadecimal color codes.
- To specify one color, set
colorarrayto a character vector or a string scalar. For example,colorarray = 'red'specifies red as the only color in the color order. - To specify multiple colors, set
colorarrayto a cell array of character vectors or a string array. For example,colorarray = {'red','green','blue'}specifies red, green, and blue as the colors.
A hexadecimal color code starts with a hash symbol (#) followed by three or six hexadecimal digits, which can range from 0 toF. The values are not case sensitive. Thus, the color codes'#FF8800', '#ff8800','#F80', and '#f80' are equivalent.
This table lists the color names and short names with the equivalent RGB triplets and hexadecimal color codes.
| Color Name | Short Name | RGB Triplet | Hexadecimal Color Code | Appearance |
|---|---|---|---|---|
| "red" | "r" | [1 0 0] | "#FF0000" |  |
| "green" | "g" | [0 1 0] | "#00FF00" |  |
| "blue" | "b" | [0 0 1] | "#0000FF" |  |
| "cyan" | "c" | [0 1 1] | "#00FFFF" |  |
| "magenta" | "m" | [1 0 1] | "#FF00FF" |  |
| "yellow" | "y" | [1 1 0] | "#FFFF00" |  |
| "black" | "k" | [0 0 0] | "#000000" |  |
| "white" | "w" | [1 1 1] | "#FFFFFF" |  |
Data Types: single | double | char | cell | string
Since R2023b
Predefined palette name, specified as one of the values in this table or"default", which is the same as "gem".
| Palette Name | Palette Colors |
|---|---|
| "gem" (Light theme default) |  |
| "gem12" |  |
| "glow" (Dark theme default) |  |
| "glow12" |  |
| "sail" |  |
| "reef" |  |
| "meadow" |  |
| "dye" |  |
| "earth" |  |
Target, specified as one of these values:
- A figure. The new colors affect the contents of all the axes in the figure.
- Any type of axes object: an
Axes,PolarAxes, orGeographicAxesobject. The new colors affect the contents of the specified axes only. - A standalone visualization such as a chart created by the bubblecloud, piechart, donutchart, stackedplot, scatterhistogram, parallelplot, or geobubble function.
Tips
- When you set the color order for a figure, the colors persist when you call a plotting function. However, if you pass an axes object to the
colororderfunction, you must first callhold onto make the colors persist when you call a plotting function. - If you set the
ColorOrderIndexorLineStyleOrderIndexproperty on the axes, the new color order does not affect existing plots. The new colors take effect only after you callhold onand then call a plotting function.
Version History
Introduced in R2019b
The "gem" palette colors have changed slightly. This table lists the changes.
| R2024b Colors | R2025a Colors |
|---|---|
RGB TripletSample[0.0000 0.4470 0.7410]  [0.8500 0.3250 0.0980] [0.8500 0.3250 0.0980]  [0.9290 0.6940 0.1250] [0.9290 0.6940 0.1250]  [0.4940 0.1840 0.5560] [0.4940 0.1840 0.5560]  [0.4660 0.6740 0.1880] [0.4660 0.6740 0.1880]  [0.3010 0.7450 0.9330] [0.3010 0.7450 0.9330]  [0.6350 0.0780 0.1840] [0.6350 0.0780 0.1840]  |
RGB TripletSample[0.0660 0.4430 0.7450]  [0.8660 0.3290 0.0000] [0.8660 0.3290 0.0000]  [0.9290 0.6940 0.1250] [0.9290 0.6940 0.1250]  [0.5210 0.0860 0.8190] [0.5210 0.0860 0.8190]  [0.2310 0.6660 0.1960] [0.2310 0.6660 0.1960]  [0.1840 0.7450 0.9370] [0.1840 0.7450 0.9370]  [0.8190 0.0150 0.5450] [0.8190 0.0150 0.5450]  |
Change the colors in your plots by specifying one of nine predefined color palettes.