NumericRuler - Control axis with numeric values - MATLAB (original) (raw)
NumericRuler Properties
Control axis with numeric values
NumericRuler properties control the appearance and behavior of an _x_-axis, _y_-axis, or _z_-axis that shows numeric values. Each individual axis has its own ruler object. By changing property values of the ruler, you can modify certain aspects of a specific axis.
Use dot notation to refer to a particular ruler and property. Access the ruler objects through the XAxis, YAxis, andZAxis properties of the Axes object.
ax = gca; co = ax.XAxis.Color; ax.XAxis.Color = 'blue';
Appearance
Axis label horizontal alignment, specified as one of the values from the table.
| LabelHorizontalAlignment Value | Description | Appearance |
|---|---|---|
| 'center' | For a horizontal axis, the label is centered between the left and right edges of the plot box.For a vertical axis, the label is centered between the top and bottom edges of the plot box. |  |
| 'left' | For a horizontal axis, the label is aligned with the left edge of the plot box.For a vertical axis, the label is aligned with the bottom edge of the plot box. |  |
| 'right' | For a horizontal axis, the label is aligned with the right edge of the plot box.For a vertical axis, the label is aligned with the top edge of the plot box. | 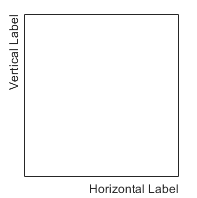 |
Scale and Direction
Tick Values and Labels
Exponential notation common to all tick values, specified as an integer value. The axis displays the secondary label 105.

The base value is always 10. However, you can change the exponent value by setting the Exponent property. For example, change the exponent to 2.
ax = gca; ax.YAxis.Exponent = 2;
If the exponent value is 0, then the exponent label does not display.
If you assign a value to this property, then MATLAB sets the ExponentMode property to'manual'. If the axis has a log scale, then theExponent property has no effect.
Selection mode for the Exponent property, specified as one of these values:
'auto'— Automatically select the exponent value based on the axis limits.'manual'— Use an exponent value that you specify. To specify the value, set theExponentproperty.
Data Types: char | string | categorical
Tick label color, specified as an RGB triplet, a hexadecimal color code, a color name, or a short name.
For a custom color, specify an RGB triplet or a hexadecimal color code.
- An RGB triplet is a three-element row vector whose elements specify the intensities of the red, green, and blue components of the color. The intensities must be in the range
[0,1], for example,[0.4 0.6 0.7]. - A hexadecimal color code is a string scalar or character vector that starts with a hash symbol (
#) followed by three or six hexadecimal digits, which can range from0toF. The values are not case sensitive. Therefore, the color codes"#FF8800","#ff8800","#F80", and"#f80"are equivalent.
Alternatively, you can specify some common colors by name. This table lists the named color options, the equivalent RGB triplets, and the hexadecimal color codes.
| Color Name | Short Name | RGB Triplet | Hexadecimal Color Code | Appearance |
|---|---|---|---|---|
| "red" | "r" | [1 0 0] | "#FF0000" |  |
| "green" | "g" | [0 1 0] | "#00FF00" |  |
| "blue" | "b" | [0 0 1] | "#0000FF" |  |
| "cyan" | "c" | [0 1 1] | "#00FFFF" |  |
| "magenta" | "m" | [1 0 1] | "#FF00FF" |  |
| "yellow" | "y" | [1 1 0] | "#FFFF00" |  |
| "black" | "k" | [0 0 0] | "#000000" |  |
| "white" | "w" | [1 1 1] | "#FFFFFF" |  |
| "none" | Not applicable | Not applicable | Not applicable | No color |
This table lists the default color palettes for plots in the light and dark themes.
| Palette | Palette Colors |
|---|---|
| "gem" — Light theme default_Before R2025a: Most plots use these colors by default._ |  |
| "glow" — Dark theme default |  |
You can get the RGB triplets and hexadecimal color codes for these palettes using the orderedcolors and rgb2hex functions. For example, get the RGB triplets for the "gem" palette and convert them to hexadecimal color codes.
RGB = orderedcolors("gem"); H = rgb2hex(RGB);
Before R2023b: Get the RGB triplets using RGB = get(groot,"FactoryAxesColorOrder").
Before R2024a: Get the hexadecimal color codes using H = compose("#%02X%02X%02X",round(RGB*255)).
Note
Setting the ruler’s Color property also sets theTickLabelColor property to the same value. However, setting the TickLabelColor property does not change theColor property. To prevent the Color property value from overriding the TickLabelColor property value, set the Color property first, and then set theTickLabelColor property.
Tick label format and decimal precision, specified as a character vector or string. For example, you can display the tick labels in a currency format, control the number of decimals that appear in each label, or add text after all the labels.
Example: ax.XAxis.TickLabelFormat = '%g%%'; displays a percent sign after all the tick labels.
This table lists some common formats.
| Common Format | Character Vector to Use | Examples of Resulting Format |
|---|---|---|
| Currency — Display dollar sign before values, use two decimal places, and use commas. | '$%,.2f' | 0.010.01 0.011.00 $1,000.00 |
| Temperatures — Display degree symbol after values. | '%g\\circ' | 0.01o 1o 1000o |
| Percentages — Display percent sign after values. | '%g%%' | 0.01% 1% 1000% |
| Commas — Display commas in the thousandth place. | '%,g' | 0.01 1 1,000 |
Alternatively, specify the tick label format using the xtickformat, ytickformat, and ztickformat functions.
Custom Format
If none of the formats mentioned in the table gives your desired format, then create a custom character vector or string with identifiers.
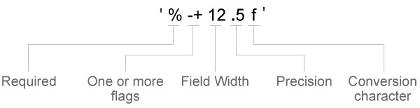
Identifiers are optional, except the percent sign and conversion character. Construct the format in this order:
- One or more flags — Options such as adding a plus sign before positive values. For a full list of options, see the table of Optional Flags.
- Field width — Minimum number of characters to print in the tick label. Specify the field width as an integer value. If the number of significant digits in the tick value is smaller than the field width, then the label is padded with spaces.
- Precision — Number of digits to the right of the decimal point or the number of significant digits, depending on the conversion character. Specify the precision as an integer value.
- Conversion character — Value type. For a full list of options, see the table of Conversion Characters. If you specify a conversion that does not fit the data, MATLAB overrides the specified conversion and uses
%e.
Also, you can specify literal text at the beginning or end of the format. To print a single quotation mark, use ''. To print a percent character, use %%.
'$%.2f'— Display a dollar sign before each value and use fixed-point notation with two decimal values.'%.3f Million'— DisplayMillionafter each value and use fixed-point notation with three decimal values.
Optional Flags
| Identifier | Description | Example of Numeric Format |
|---|---|---|
| , | Display commas every three digits, such as'1,000'. | '%,4.4g' |
| + | Print the sign character (+) for positive values, such as '+100'. | '%+4.4g' |
| 0 | Pad the field width with leading zeros instead of spaces, such as '0100'. | '%04.4g' |
| – | Left-justify, which pads the end of the value with spaces instead of the beginning. For example, if the field width is 4, then this flag formats the label as '100 ' instead of ' 100'. | '%-4.4g' |
| # | For the %f,%e, and %g conversion characters, print the decimal point even when the precision is 0, such as'100.'. For%g, do not remove trailing zeros. | '%#4.4g' |
Conversion Characters
| Identifier | Description | Example |
|---|---|---|
| d or i | Signed integer with base 10. The precision value indicates the number of significant digits. | '%.4d' displays π as0003. |
| f | Fixed-point notation. The precision value indicates the number of decimal places. | '%.4f' displays π as3.1416. |
| e | Exponential notation. The precision value indicates the number of decimal places. | '%.4e' displays π as3.1416x100. |
| g | The more compact version of e orf, with no trailing zeros. The precision value indicates the maximum number of decimal places. | '%.4g' displays π as3.1416. |
Font
Callbacks
Axis limits changed callback, specified as one of these values:
- A function handle.
- A cell array in which the first element is a function handle. Subsequent elements in the cell array are the arguments to pass to the callback function.
- A character vector containing a valid MATLAB expression (not recommended). MATLAB evaluates this expression in the base workspace.
This callback executes after the axis limits have changed, either programmatically or using an interaction such as panning within the axes. It can also execute if MATLAB changes the axis limits to encompass the range of your data when you call a plotting function.
This callback function can access specific information about the axis limits. MATLAB passes this information in a LimitsChanged object as the second argument to your callback function. If you are developing an app in App Designer, the argument is calledevent. You can query the object properties using dot notation. For example, event.NewLimits returns the new axis limits. TheLimitsChanged object is not available to callback functions specified as character vectors.
The following table lists the properties of the LimitsChanged object.
| Property | Description |
|---|---|
| Source | Ruler object that executes the callback |
| EventName | 'LimitsChanged' |
| OldLimits | Two-element vector containing the previous axis limits |
| NewLimits | Two-element vector containing the new axis limits |
For more information about writing callbacks in apps, see Callbacks in App Designer.
Parent/Child
The ruler has no children. You cannot set this property.
Version History
Introduced in R2015b
The FontSmoothing property has no effect and will be removed in a future release. You can set or get the value of this property without warning, but all text is smooth regardless of the property value. This property removal was announced in R2022a.