brush - Interactively mark data values in a chart - MATLAB (original) (raw)
Interactively mark data values in a chart
Description
Data brushing allows you to mark data values in a chart using a color of your choice. You can mark individual data values, or select many values to mark using a selection rectangle. Once you have values marked, you can delete them or save them to a variable in the workspace. Brush marks will persist until you remove them, even if you pan, zoom, add data tips, or edit the plot.
Most charts support data brushing, including line, bar, area, histogram, and surface charts. Charts that support brushing typically display the brush ![]() icon in the axes toolbar.
icon in the axes toolbar.
Creation
Syntax
Description
brush on turns on brushing in the current figure. With brushing on, mark a single data value by clicking on it. Mark multiple data values by dragging a selection rectangle around them. To add additional marks or remove unwanted marks, hold the Shift key while brushing the values.
brush off turns off brushing. If there are existing brush marks on the chart, this command will not remove them.
brush toggles the brush mode between on andoff.
brush([color](#mw%5F0c624505-b1a1-490c-8ecb-3e4262c09fa7)) sets the color for subsequent brush marks. Setting the brush color does not affect current marks unless you brush data, change the brush color, and then add or remove marks using theShift key. In this case, all marks update to the new color.
brush([fig](#mw%5Fb192d45b-f98c-452f-b959-3dc706c8c6a2),___) sets the brush mode for all axes in the specified figure for any of the previous syntaxes. Specify the additional argument as 'on', 'off', or a brush mark color. For example, to enable brush mode for all axes in the figurefig, use brush(fig,'on'). To set the brush mark color for all of the axes, use brush(fig,'green').
brush([ax](#mw%5Fd5ca5609-fc39-41b1-82bb-f29efa7d128d),___) sets the brush mode for the specified axes. For example, to enable brush mode for the axesax, use brush(ax,'on'). To set the brush mark color for the axes, use brush(ax,'green'). (since R2023a)
Before R2025a: Use this syntax with apps created in App Designer or using the uifigure function.
`b` = brush creates a brush object for the current figure. This syntax is useful for customizing the brush mode, color, and callback properties.
`b` = brush([fig](#mw%5Fb192d45b-f98c-452f-b959-3dc706c8c6a2)) creates a brush object for the specified figure.
Input Arguments
Brush mark color, specified as an RGB triplet or a color name. To create brush marks of a certain color, set the color property before brushing your data values. Setting the brush color does not affect current marks unless you brush data, change the brush color, and then add or remove marks using the Shift key. In this case, all marks update to the new color.
An RGB triplet is a three-element row vector whose elements specify the intensities of the red, green, and blue components of the color. The intensities must be in the range [0,1]; for example,[0.4 0.6 0.7]. Alternatively, you can specify some common colors by name. This table lists the long and short color name options and their equivalent RGB triplet values.
| Color Name | Short Name | RGB Triplet | Appearance |
|---|---|---|---|
| 'red' | 'r' | [1 0 0] |  |
| 'green' | 'g' | [0 1 0] |  |
| 'blue' | 'b' | [0 0 1] |  |
| 'cyan' | 'c' | [0 1 1] |  |
| 'magenta' | 'm' | [1 0 1] |  |
| 'yellow' | 'y' | [1 1 0] |  |
| 'black' | 'k' | [0 0 0] |  |
| 'white' | 'w' | [1 1 1] |  |
Here are the RGB triplets for the default colors MATLAB® uses in many types of plots.
| RGB Triplet | Appearance |
|---|---|
| [0 0.4470 0.7410] | ![Sample of RGB triplet [0 0.4470 0.7410], which appears as dark blue](https://in.mathworks.com/help/matlab/ref/colororder1.png) |
| [0.8500 0.3250 0.0980] | ![Sample of RGB triplet [0.8500 0.3250 0.0980], which appears as dark orange](https://in.mathworks.com/help/matlab/ref/colororder2.png) |
| [0.9290 0.6940 0.1250] | ![Sample of RGB triplet [0.9290 0.6940 0.1250], which appears as dark yellow](https://in.mathworks.com/help/matlab/ref/colororder3.png) |
| [0.4940 0.1840 0.5560] | ![Sample of RGB triplet [0.4940 0.1840 0.5560], which appears as dark purple](https://in.mathworks.com/help/matlab/ref/colororder4.png) |
| [0.4660 0.6740 0.1880] | ![Sample of RGB triplet [0.4660 0.6740 0.1880], which appears as medium green](https://in.mathworks.com/help/matlab/ref/colororder5.png) |
| [0.3010 0.7450 0.9330] | ![Sample of RGB triplet [0.3010 0.7450 0.9330], which appears as light blue](https://in.mathworks.com/help/matlab/ref/colororder6.png) |
| [0.6350 0.0780 0.1840] | ![Sample of RGB triplet [0.6350 0.0780 0.1840], which appears as dark red](https://in.mathworks.com/help/matlab/ref/colororder7.png) |
Target figure, specified as a Figure object. Specifying a target figure sets the mode for all current or future Axes children.
Target axes, specified as an Axes object.
Properties
Note
If you modify any of these properties of a brush object, then MATLAB enables legacy exploration modes on the figure. For more information, seeenableLegacyExplorationModes.
Brush mark color, specified as an RGB triplet, a hexadecimal color code, a color name, or a short name. To create brush marks of a certain color, set the color property before brushing your data values. Setting the brush color does not affect current marks unless you brush data, change the brush color, and then add or remove marks using theShift key. In this case, all marks update to the new color.
For a custom color, specify an RGB triplet or a hexadecimal color code.
- An RGB triplet is a three-element row vector whose elements specify the intensities of the red, green, and blue components of the color. The intensities must be in the range
[0,1], for example,[0.4 0.6 0.7]. - A hexadecimal color code is a string scalar or character vector that starts with a hash symbol (
#) followed by three or six hexadecimal digits, which can range from0toF. The values are not case sensitive. Therefore, the color codes"#FF8800","#ff8800","#F80", and"#f80"are equivalent.
Alternatively, you can specify some common colors by name. This table lists the named color options, the equivalent RGB triplets, and the hexadecimal color codes.
| Color Name | Short Name | RGB Triplet | Hexadecimal Color Code | Appearance |
|---|---|---|---|---|
| "red" | "r" | [1 0 0] | "#FF0000" | |
| "green" | "g" | [0 1 0] | "#00FF00" | |
| "blue" | "b" | [0 0 1] | "#0000FF" | |
| "cyan" | "c" | [0 1 1] | "#00FFFF" | |
| "magenta" | "m" | [1 0 1] | "#FF00FF" | |
| "yellow" | "y" | [1 1 0] | "#FFFF00" | |
| "black" | "k" | [0 0 0] | "#000000" | |
| "white" | "w" | [1 1 1] | "#FFFFFF" | |
| "none" | Not applicable | Not applicable | Not applicable | No color |
This table lists the default color palettes for plots in the light and dark themes.
| Palette | Palette Colors |
|---|---|
| "gem" — Light theme default_Before R2025a: Most plots use these colors by default._ |  |
| "glow" — Dark theme default |  |
You can get the RGB triplets and hexadecimal color codes for these palettes using the orderedcolors and rgb2hex functions. For example, get the RGB triplets for the "gem" palette and convert them to hexadecimal color codes.
RGB = orderedcolors("gem"); H = rgb2hex(RGB);
Before R2023b: Get the RGB triplets using RGB = get(groot,"FactoryAxesColorOrder").
Before R2024a: Get the hexadecimal color codes using H = compose("#%02X%02X%02X",round(RGB*255)).
Brush mode state, specified as 'on' or 'off', or as numeric or logical 1 (true) or0 (false). A value of 'on' is equivalent to true, and 'off' is equivalent tofalse. Thus, you can use the value of this property as a logical value. The value is stored as an on/off logical value of type OnOffSwitchState.
Function to execute before brushing, specified as one of these values:
- Function handle
- Cell array containing a function handle and additional arguments
- Character vector that is a valid MATLAB command or function, which is evaluated in the base workspace (not recommended)
Use this property to execute code as you start brushing a graph. If you specify this property using a function handle, then MATLAB passes two arguments to the callback function when executing the callback:
figure— Figure object you are brushing.axesStruct— Structure that contains the axes you are brushing. This structure has one field,Axes, the axes object you are brushing. If you do not use this argument in your callback function, then replace it with the tilde character (~).
For more information about how to use function handles to define callback definitions, see Create Callbacks for Graphics Objects.
Function to execute after brushing, specified as one of these values:
- Function handle
- Cell array containing a function handle and additional arguments
- Character vector that is a valid MATLAB command or function, which is evaluated in the base workspace (not recommended)
Use this property to execute code after you finish brushing a graph. If you specify this property using a function handle, then MATLAB passes two arguments to the callback function when executing the callback:
figure— Figure object you are brushing.axesStruct— Structure that contains the axes you are brushing. This structure has one field,Axes, the axes object you are brushing. If you do not use this argument in your callback function, then replace it with the tilde character (~).
For more information about how to use function handles to define callback definitions, see Create Callbacks for Graphics Objects.
Brush suppression callback, specified as one of these values:
- Function handle
- Cell array containing a function handle and additional arguments
- Character vector that is a valid MATLAB command or function, which is evaluated in the base workspace (not recommended)
Use this property to suppress brushing under conditions that you define. A numeric or logical output of 1 (true) suppresses the brush action, and a numeric or logical output of 0 (false) allows the brush action to proceed. If you specify this property using a function handle, then MATLAB passes two arguments to the callback function when executing the callback:
axes— The axes object you are brushing.eventData— Empty argument. Replace it with the tilde character (~) in the function definition to indicate that this argument is not used.
If you specify this property using a function handle, then you must assign the function's output to a variable.
For more information about how to use function handles to define callback definitions, see Create Callbacks for Graphics Objects.
This property is read-only.
Figure object in which brush marks appear.
Legacy mode, specified as "on" or "off", or as numeric or logical 1 (true) or0 (false). A value of "on" is equivalent to true, and "off" is equivalent tofalse. Thus, you can use the value of this property as a logical value. The value is stored as an on/off logical value of type matlab.lang.OnOffSwitchState. For more information, see Legacy Exploration Modes.
Once this property is set to "on", you cannot change it back to"off".
Before R2025a: This property applies only tobrush objects for figures created using theuifigure function or in MATLAB Online™. Setting this property to "on" changes the behavior of interaction modes in UI figures so they match the behavior of modes in traditional figures. For more information, see enableLegacyExplorationModes.
Examples
Use brushing to mark data values in a scatter plot. First, plot randomx and y values. Then, turn on brushing and use the mouse to drag a rectangle around some points.
x = rand(20,1); y = rand(20,1); scatter(x,y) brush('on')
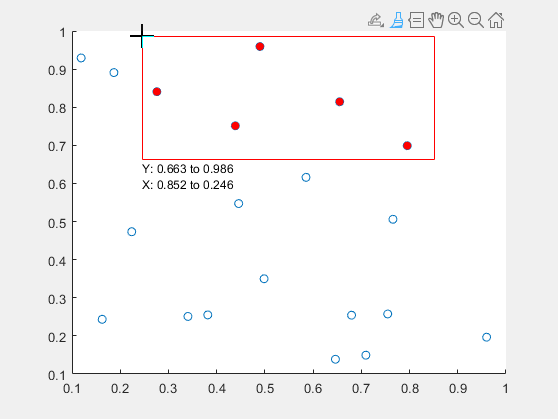
To modify which points you have marked without discarding the entire set, hold down the Shift key while brushing. Add or remove a single point by clicking on it. Add or remove several points by dragging a selection rectangle.
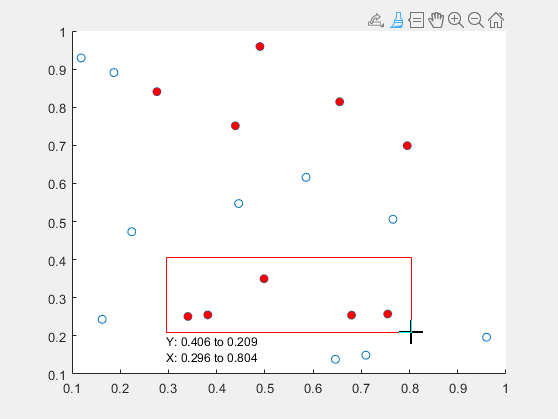
Clear all brush marks by clicking or dragging in an empty area of the axes.
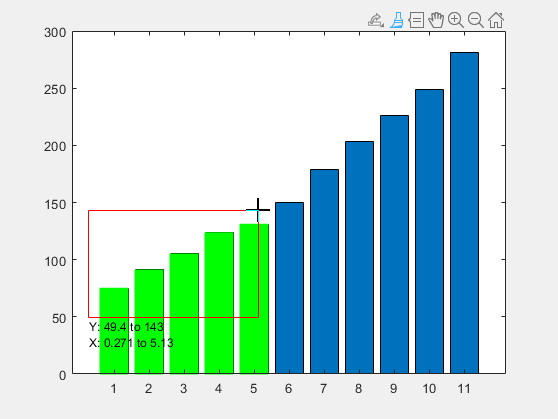
Plot data values in a bar chart and create a brush object. Then, enable brushing and set the brush color to 'green' by updating the object's properties. Finally, mark data values by including the maximum value of each bar in the selection rectangle.
y = [75 91 105 123.5 131 150 179 203 226 249 281.5]; bar(y) b = brush; b.Enable = 'on'; b.Color = 'green';
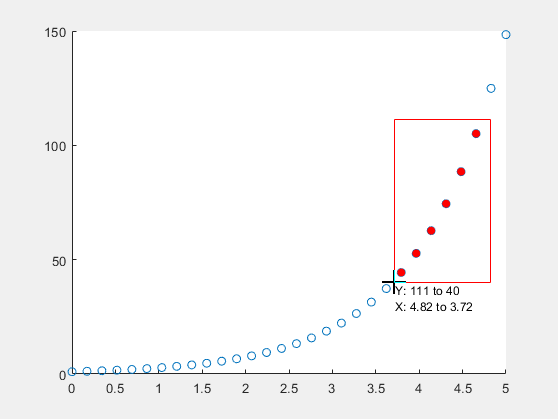
Save brushed data in a variable by using the context menu. First, plot somex and y values. Turn on brushing, and then mark some data values.
x = linspace(0,5,30); y = exp(x); plot(x,y) brush('on')
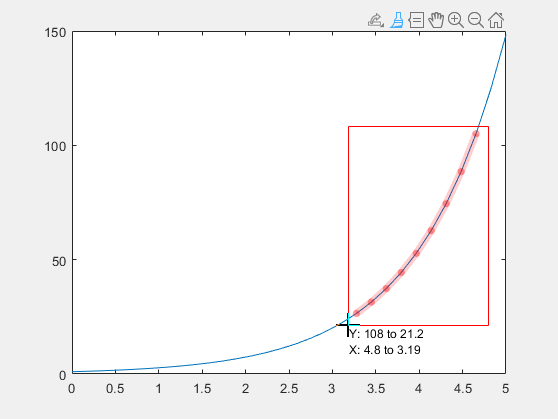
To store the brushed data in a variable, right-click on a brushed data value and select from the context menu. When prompted, enter the variable name. In this case, use the name bData. Finally, view the contents ofbData.
bData =
3.2759   26.4660
3.4483   31.4461
3.6207   37.3633
3.7931   44.3940
3.9655   52.7475
4.1379   62.6730
4.3103   74.4662
4.4828   88.4784
4.6552  105.1273
Remove brushed data from a chart by using the context menu. First, plot somex and y values. Turn on brushing, and then mark some data values.
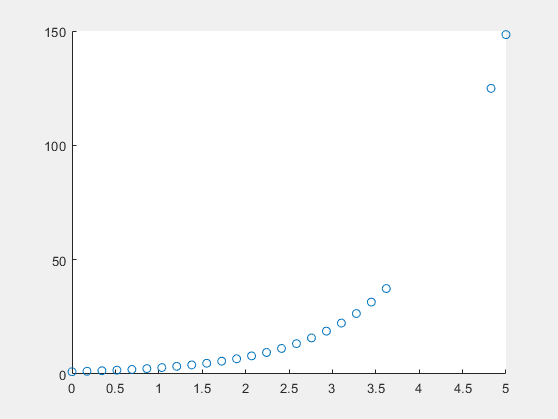
x = linspace(0,5,30); y = exp(x); scatter(x,y) brush('on')
To remove the brushed data from the chart, right-click on a brushed data value and select from the context menu.
More About
Data linking automatically updates figures as plotted variables change. Enable data linking for a figure using the command linkdata on. Brush marks created on a linked graph will appear on other linked graphs that display the same variables. This occurs even if other plots are not in brush mode.
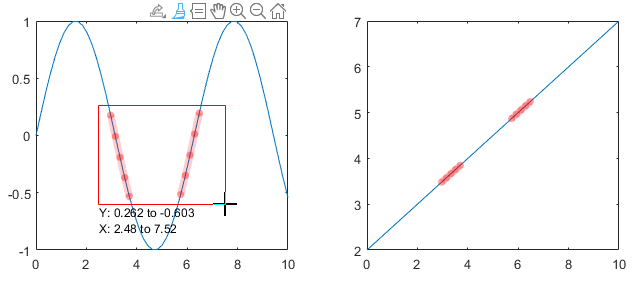
When you turn on data linking for a figure, existing brush marks are replaced by the marks in other linked figures. If you turn on data linking and there are no other linked figures, then existing brush marks disappear. If you brush a graph and then turn off data linking, the brush marks remain.
The following conditions apply:
- Brush marks appear in the same color in all linked charts. The brush color that displays in linked charts is the brush color associated with the graph you are brushing.
- The linked variable must not be complex. You can brush complex data values, but brush marks will not appear in the other linked charts. For more information about linking complex variables, see linkdata.
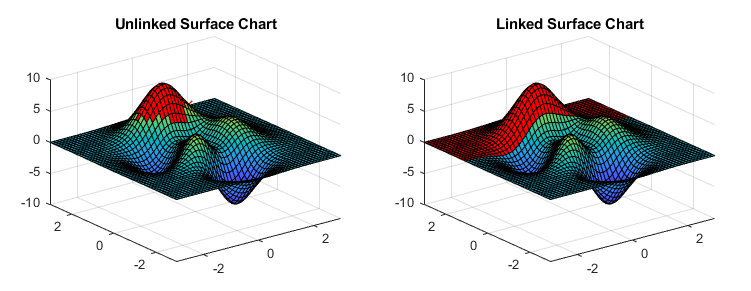
Brush marks on a surface chart display differently when the surface chart has linked data. When you brush one face of a linked surface chart, all faces with the sameyData are also brushed. This behavior allows you to investigate relationships between columns of data distributed among multiple rows. The following images illustrate the difference between brushing unlinked and linked surface charts.
Tips
- To brush a histogram chart, you must first turn on data linking.
Alternative Functionality
Axes Toolbar
For some charts, enable brush mode by clicking the brush ![]() icon in the axes toolbar.
icon in the axes toolbar.
Version History
Introduced in R2008a
Set the brush mode for axes by specifying the axes as the first input ofbrush. When setting the brush mode for axes, the function does not return a brush object. Previously, you could set the brush mode for axes only in apps created in App Designer or using the uifigure function.
For apps created in App Designer or using the uifigure function, set the brush mode for axes by specifying the axes as the first input ofbrush. When setting the brush mode for axes, the function does not return a brush object.