Variables Editor - Interactively view, edit, and analyze workspace variables - MATLAB (original) (raw)
Interactively view, edit, and analyze workspace variables
Description
The Variables editor enables you to view, edit, and analyze variables in the MATLAB® workspace. Changes that you make to variables in the Variables editor occur in the current workspace as soon as you enter them. For example, you can use the Variables editor to:
- Navigate and explore variable contents.
- Directly edit variable contents.
- View variable edits as MATLAB code in the Command Window.
- View sparklines and summary statistics for data in a table or timetable.
- Visualize data in a plot linked with workspace variables.
- Create a variable from selected data.
Open the Variables Editor
- MATLAB Toolstrip: On the Home tab, in theVariable section, click New Variable or Open Variable.
- Workspace panel: In the Workspace panel, double-click a variable to open it in the Variables editor. Alternatively, you can select variables, right-click your selection, and select Open Selection in the context menu.
- MATLAB command prompt: Enter
openvar(varname), wherevarnameis a string scalar or character vector specifying the name of a variable in the MATLAB workspace.
Examples
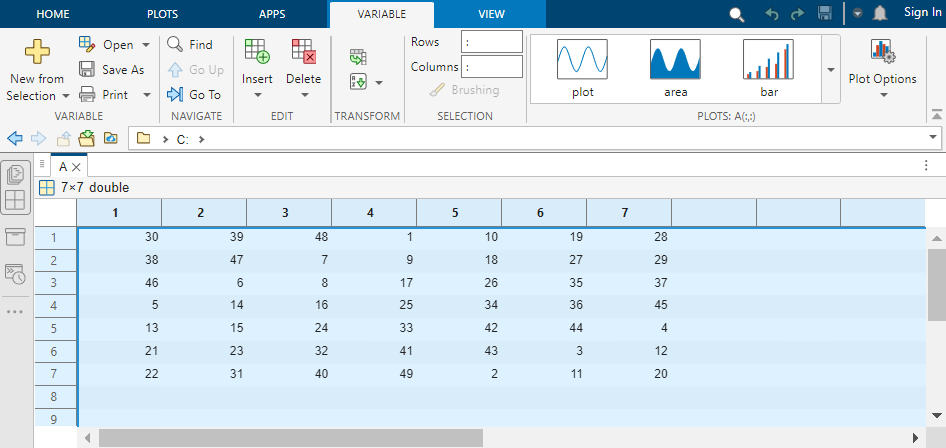
You can navigate the contents of a variable in the Variables editor using the options in the Variable tab and keyboard shortcuts.
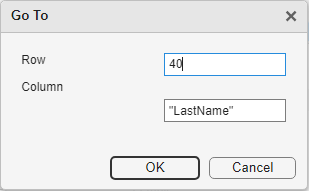
First, open a variable in the Variables editor. To move the view to a row and column that you specify, on the Variable tab, in the Navigate section, click Go To. Then, enter the row number and the column number or variable name. For example, for a table in the Variables editor that contains a variable named LastName, move the view to row 40 of that variable.
To search the contents of the open variable selection, on theVariable tab, in the Navigate section, click Find. Then, enter a value to find. For example, for a table in the Variables editor that contains a variable namedLastName, search for the table row that contains the name Cook. If you want to search within a selection of the table instead of the entire variable, click the Find in selection button in the Find toolbar.

For a list of keyboard shortcuts to navigate your variable, see Keyboard Shortcuts.
You can interactively edit elements in variables such as matrices, cell arrays, and tables using the Variables editor. After editing a variable, you can view the generated code that represents your edits in the Command Window.
Edit Matrix
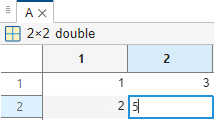
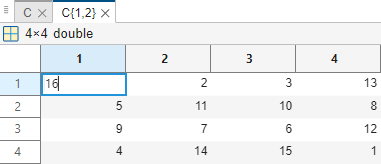
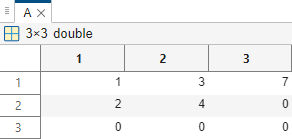
To edit an element in a matrix, click the element and type a new value. Press Enter or click another element to save the change. For example, for a matrix in the Variables editor, change the value of the fourth element.
Edit Multidimensional Array
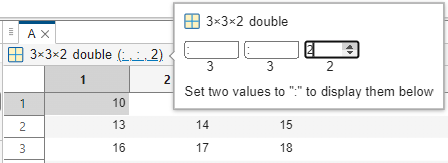
To navigate the contents of a multidimensional array, click the text that indicates the current subset. For example, click (:,:,1), which indicates that the Variables editor displays the first page of a three-dimensional array.

Then, use the numeric fields to specify another subset. For example, to display the second page in a three-dimensional array, set the numeric field for the third array dimension to 2.
To edit an element in the array, click the element and type a new value. Press Enter or click another element to save the change.
Edit Cell Array
To view the contents of a cell in a cell array, in the Variables editor, double-click the cell. Then, to edit an element in the cell, click the element and type a new value. Press Enter or click another element to save the change. To return to the parent cell array, on theVariable tab, in the Navigate section, click the Go Up button. For example, for a cell array in the Variables editor, change the value of the first element in the second cell.
Edit Table
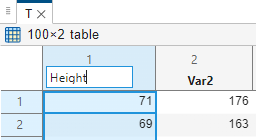
To edit the name of a table variable, double-click the name in the table variable header and type a new name. For example, for a table in the Variables editor, change the name of the first variable.
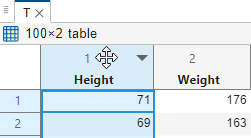
To reorder variables, click the header of a table variable so that a four-headed arrow appears. Then, drag the variable to a new position. For example, switch the order of two variables in a table.
To modify the units and description of a table variable, pause on the header of a table variable. Then, to open the Table Property Editor, click the arrow that appears to the right of the variable name and selectEdit Variable Properties. For example, specify units and a description for a table variable.

To sort data in a table, pause on the header of a table variable and click the arrow that appears to the right of the variable name. Then, select the sort order. For example, sort a table variable in ascending order.

View Generated Code
The Command Window displays MATLAB code that represents edits to some types of variables. If you want to suppress this display, on the View tab, clearShow MATLAB Code.
You can interactively resize data using the Variables editor.
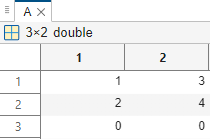
To add a row or column to a matrix, right-click the header of a row or column and select an option from the context menu. For example, for a matrix in the Variables editor, insert a third row. Right-click the header of the second row and select Insert Row Below from the context menu. The inserted elements are assigned default empty values, which are:
0for numeric data[]for cell arrays and structures<undefined>for categorical data
You can also enter a value in an empty row or column. For example, select an empty matrix element in the third column and enter a value for the element. The Variables editor saves the value you entered and fills the remaining elements in the column with empty values.
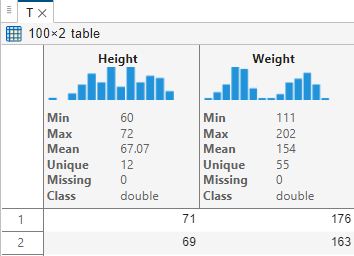
For table or timetable variables, you can display quick insights in the Variables editor to better understand the data.
To display a small chart or set of statistics in the header of each variable in a table, on the View tab, selectSparklines or Summary Statistics, respectively.
You can create a plot that is synchronized with data values using the Variables editor. You can also interactively brush the linked plot.
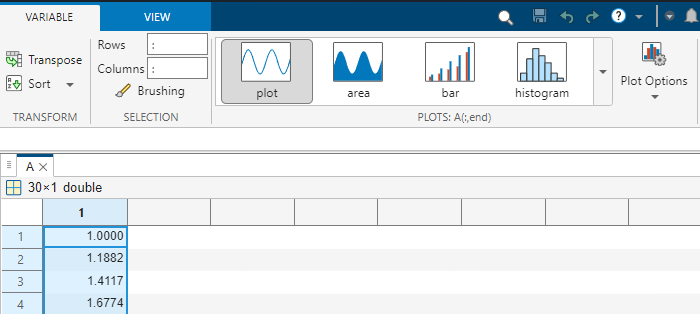
To create a plot for selected data, on the Variable tab, choose a plot type from the gallery. The plotted data is automatically linked to the workspace variable, so if you change the data, the figure refreshes to reflect the change. Additionally, you can customize the format of the figure using the Plot Options button on theVariable tab. For example, for a column vector in the Variables editor, select the column header and create a linked line plot.
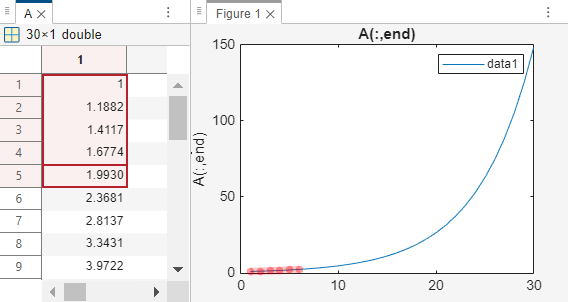
Then, to enable brushing, on the Variable tab, in theSelection section, clickBrushing. Select some data in the Variables editor to highlight the corresponding data points in the figure. For example, brush the first few elements of a column vector in the Variables editor to highlight the corresponding data points in red on the linked line plot.
Then, you can create a logical variable indicating the brushed data points. On the Variable tab, in theVariable section, select New from Selection > New Logical Variable from Selected Indices > New Column Vector Indicating Row Selection.
For more information about creating a linked plot and brushing the data, see linkdata and brush.
Using the Variables editor, you can select a subset of data in a variable and interactively create a new variable from the selection.
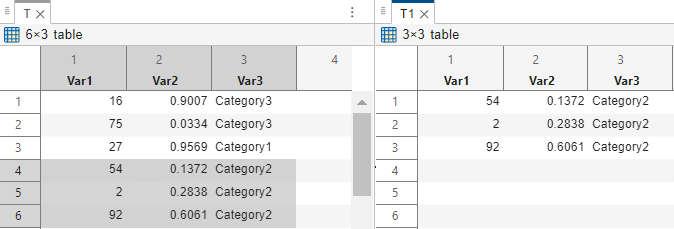
For example, to create a new table from selected data in an existing table in the Variables editor, on the Variable tab, in theVariable section, select New from Selection > New Workspace Variable from Selection > New Table.
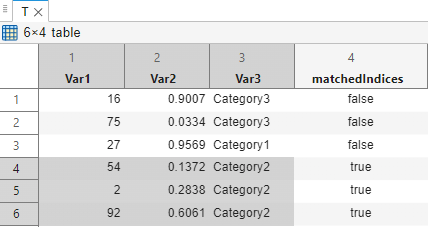
You can also select a subset of data in a variable and insert a logical vector or variable into the data based on the selection. For example, for a table, on the Variable tab, in theVariable section, select New from Selection > New Logical Variable from Selected Indices > Insert Logical Variable in Table. The new table variable is true for rows you selected in the original table.
Programmatic Use
openvar(varname) opens the Variables editor and displays the variable specified by the string scalar or character vectorvarname.
Limitations
- The maximum number of elements in a variable that you can open depends on your operating system and the amount of physical memory installed on your system.
- The Variables editor does not support viewing the contents of some variables, such as tall arrays and sparse arrays.
- You can view and edit the contents of a table only when the number of variables is fewer than 5000. When the number of variables is at least 5000, you can only view the table properties.
More About
Some variables can contain large amounts of data, making it difficult to navigate between elements. Use these keyboard shortcuts to move easily between variable elements in the Variables editor. You cannot modify these keyboard shortcuts.
| Action | Keyboard Shortcut |
|---|---|
| Commit changes to the element and move to the next element.You can use Variables settings to control if the selection moves after you press Enter. You can also control which direction the selection moves after you pressEnter. The default direction is down. For more information about Variables settings, see Modify Workspace and Variables Settings. | Enter |
| Move right.Within a selection,Tab also moves from the last column in one row to the first column in the next row. | Tab |
| Move in the opposite direction of Enter orTab. | Shift+Enter orShift+Tab |
| Move up m rows, wherem is the number of visible rows. | Page Up |
| Move down m rows, wherem is the number of visible rows. | Page Down |
| Go to column 1. | Home |
| Go to row 1, column 1. | Ctrl+Home |
| Edit current element and position cursor at the end of the element. | F2On macOS systems, useCtrl+U instead. |
Version History
Introduced before R2006a
The Variables editor has new tools for navigating and analyzing variable contents. For example, you can:
- View edits to variables of all types as MATLAB code in the Command Window.
- View sparklines and summary statistics for data in a table or timetable.
- Create a logical variable from selected data indices.
- Navigate variable contents using the Find andGo To buttons on the toolstrip.
- Create a linked plot that is synchronized with workspace variables.
- Edit categories of a categorical table variable.
The Variables editor display has enhanced readability for some variable types. For example, you can:
- Review and analyze data in a table, timetable, structure array, or cell array using a simplified, borderless design and row striping.
- Edit the contents of and view useful information for data in a scalar structure, object array, or cell array.
- Interactively edit each page of data in a multidimensional array.
- View the event labels for data in a timetable.
To specify the page orientation when printing the contents of a variable, use the options in the Print dialog box. Page numbers are no longer printed in the page header, and all rows print before wrapped columns.
When you open a timeseries object in the Variables editor, the editor now displays the Property, Value, Size, and Class columns directly, rather than displaying a specialized editor for the timeseries data. You can still access and view all the properties of the timeseries object and edit some of its property values using this updated display.
The Variables editor no longer supports opening a variable that does not exist. For example, if the variable a does not exist, thenopenvar(a) returns an error.