plot - Plot data in Simulation Data Inspector - MATLAB (original) (raw)
Plot data in Simulation Data Inspector
Syntax
Description
Use the plot function to plot data contained in objects such as Dataset, SimulationOutput, or Signal objects in the Simulation Data Inspector.
For more information about interactively plotting data in the Simulation Data Inspector and customizing the plot appearance, see Create Plots Using the Simulation Data Inspector.
To create a 2-D line plot in a MATLAB® figure, see plot.
plot([obj](#mw%5F3541188d-bd77-4db1-bfc1-ff00a8afbb0e)) plots the simulation results in the object obj in the Simulation Data Inspector and opens the Simulation Data Inspector. You can use theplot function to plot data and simulation results stored in an object such as:
When the input object contains fewer than eight signals, the Simulation Data Inspector layout changes to 1-by-n, where n is the number of signals, and each subplot displays one signal. When the simulation results contain more than eight signals to plot, the Simulation Data Inspector layout changes to1-by-1, and the plot displays the first signal.
plot([ds](#mw%5F5ffacdef-9243-427e-b64a-518cf1f7365a),[viewer](#mw%5Fe76f8921-512c-419a-a7dc-8e468f23c78c)) displays data contained in a Simulink.SimulationData.Dataset orSimulink.SimulationData.DatasetRef object in the Simulation Data Inspector or Signal Preview window according to the value specified forviewer.
[runObj](#mw%5F81c4966b-1fae-40ca-8339-f840c9a53c38) = plot(___) returns theSimulink.sdi.Run object that corresponds to the plotted data.
Examples
Open the model vdp, which models the second-order Van der Pol differential equation. You can use the plot function to plot the simulation results in the Simulation Data Inspector.
mdl = "vdp"; open_system(mdl)
Configure the model to log signals, outputs, and states.
set_param(mdl,"SignalLogging","on") set_param(mdl,"SaveOutput","on") set_param(mdl,"SaveState","on")
Mark the x1 and x2 signals for logging.
Simulink.sdi.markSignalForStreaming('vdp/Mu',1,'on') Simulink.sdi.markSignalForStreaming('vdp/Product',1,'on') Simulink.sdi.markSignalForStreaming('vdp/Square',1,'on') Simulink.sdi.markSignalForStreaming('vdp/Sum',1,'on')
Simulate the model and return all logged data as a single simulation output named out. The model logs data using the Dataset format, so all the logged data streams to the Simulation Data Inspector during simulation.
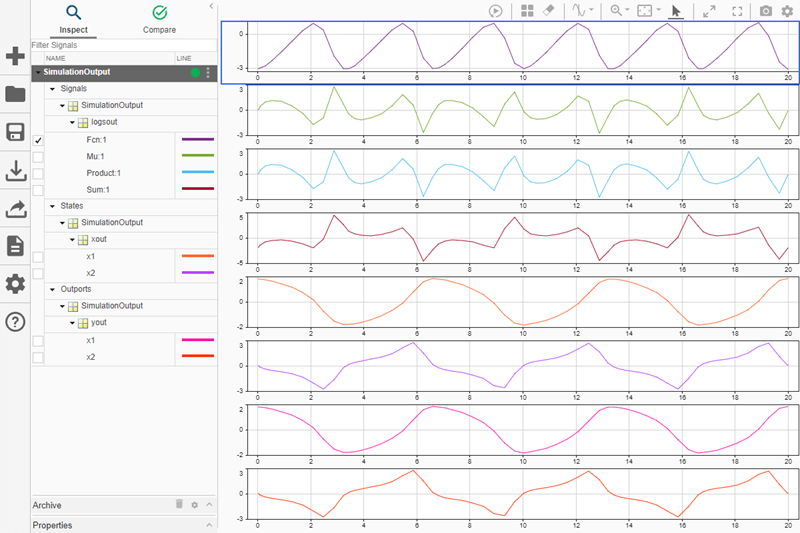
Use the plot function to plot all the simulation results in the Simulation Data Inspector. The Simulation Data Inspector updates to a 1-by-8 layout and plots one signal on each subplot.
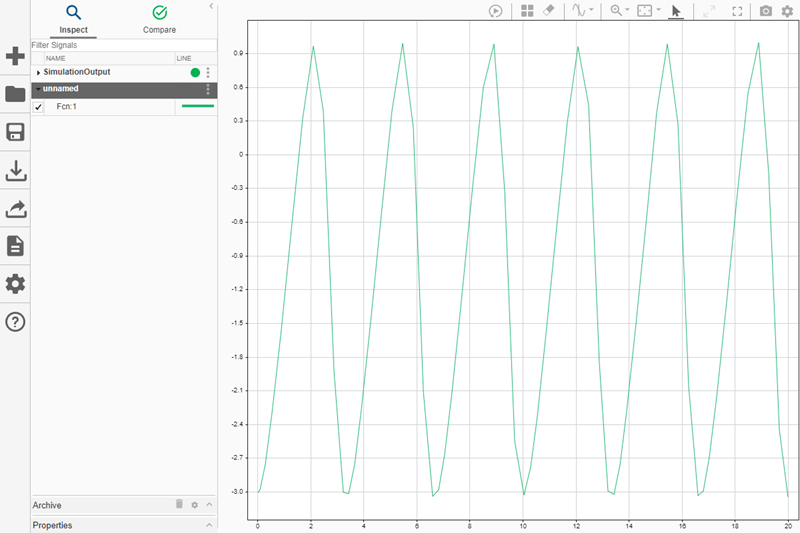
You can also use the plot function to plot data for a single signal or a subset of the simulation results. When you plot the data for a single signal, the Simulation Data Inspector always imports the data for the signal into a new run.
The Simulink.SimulationOutput object contains a property for each logging variable. Access the signal logging data in the property logsout.
logsout = Simulink.SimulationData.Dataset 'logsout' with 6 elements
                     Name  BlockPath
                     ____  ___________
1  [1x1 Signal]      ''    vdp/Mu
2  [1x1 Signal]      ''    vdp/Product
3  [1x1 Signal]      ''    vdp/Square
4  [1x1 Signal]      ''    vdp/Sum
5  [1x1 Signal]      x1    vdp/x1
6 [1x1 Signal] x2 vdp/x2 - Use braces { } to access, modify, or add elements using index.
Use the get function for the Dataset object to access the data for the first element, which contains the data for a single logged signal.
When you plot the signal data, the Simulation Data Inspector imports the signal into a new run, updates the layout to 1-by-1, and plots the signal.
Create two timeseries objects.
ts1 = timeseries([0;20],[0;10]);
ts2 = timeseries([0;40],[0;10]);
Create a Dataset object. Then, add the timeseries objects to the Dataset object.
ds = Simulink.SimulationData.Dataset; ds = addElement(ds,ts1,"timeseries1"); ds = addElement(ds,ts2,"timeseries2");
Plot the Dataset object in the Simulation Data Inspector.
Input Arguments
Data to plot in specified visualization tool, specified as aSimulink.SimulationData.Dataset object or aSimulink.SimulationData.Datasetref object.
Viewer used to plot data, specified as "datainspector" or"preview". When you do not specify the viewer input, the plot function plots data in the Simulation Data Inspector.
"datainspector"— Plot data in the Simulation Data Inspector."preview"— Plot data in the Signal Preview window. For more information, see Preview Signal Data.
Version History
Introduced in R2019b
Specifying the viewer input as "sdi" is not recommended. Instead, to view plotted data in the Simulation Data Inspector, specify theviewer argument as "datainspector".
See Also
Objects
- Simulink.SimulationData.BlockPath | Simulink.SimulationData.Signal | Simulink.SimulationData.DataStoreMemory | Simulink.SimulationData.Dataset