grid - Display or hide axes grid lines - MATLAB (original) (raw)
Display or hide axes grid lines
Syntax
Description
grid on displays the major grid lines for the current axes returned by the gca command. Major grid lines extend from each tick mark.
grid off removes all grid lines from the current axes or chart.
grid toggles the visibility of the major grid lines.
grid minor toggles the visibility of the minor grid lines. Minor grid lines lie between the tick marks. Not all types of charts support minor grid lines.
grid([visibility](#mw%5F6ab96a67-1b12-4fc0-ab74-83a1ca935dca)) displays or hides the grid by specifying a visibility value. You can specifyvisibility as "on","off", a logical value, or anOnOffSwitchState value.
grid([target](#bulam13-1-target),___) uses the axes or standalone visualization specified by target instead of the current axes. Specify target before all other arguments.
Examples
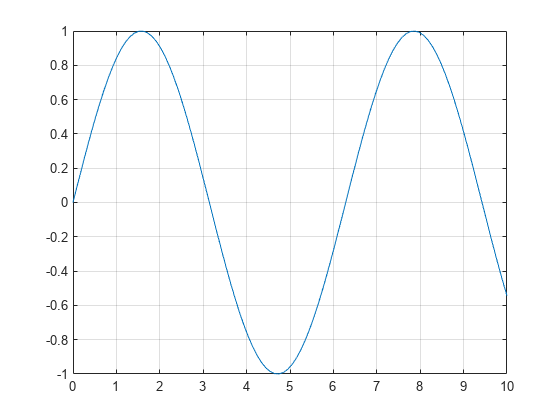
Display Grid Lines
Display the grid lines for a sine plot.
x = linspace(0,10); y = sin(x); plot(x,y) grid on
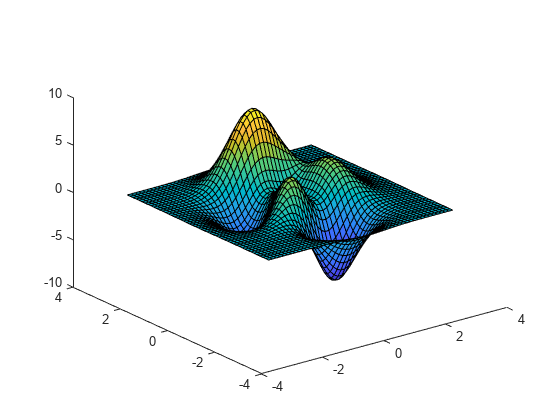
Remove Grid Lines
Create a surface plot and remove the grid lines.
[X,Y,Z] = peaks; surf(X,Y,Z) grid off
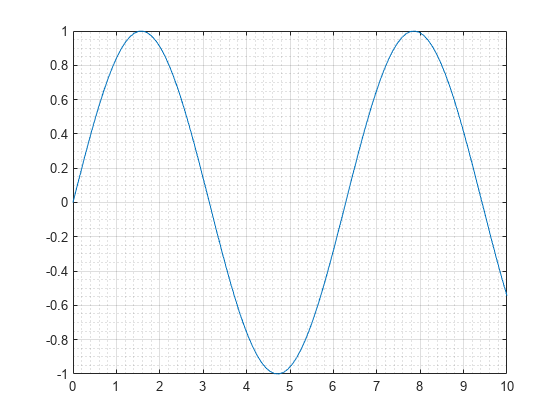
Display Major and Minor Grid Lines
Display the major and minor grid lines for a sine plot.
x = linspace(0,10); y = sin(x); plot(x,y) grid on grid minor
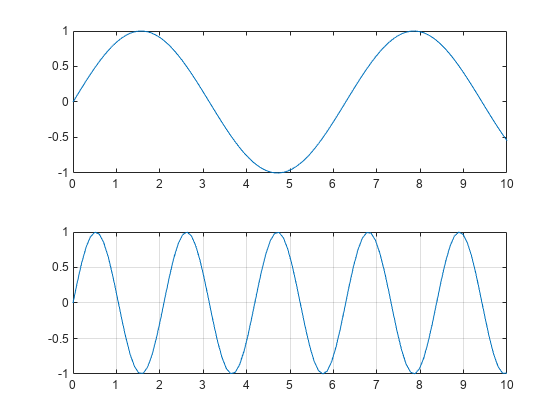
Display Grid Lines on Specific Axes
Starting in R2019b, you can display a tiling of plots using the tiledlayout and nexttile functions. Call the tiledlayout function to create a 2-by-1 tiled chart layout. Call the nexttile function to create the axes objects ax1 and ax2. Plot data into each axes. Then display grid lines in the bottom plot by passing ax2 to the grid function.
x = linspace(0,10); y1 = sin(x); y2 = sin(3*x); tiledlayout(2,1)
% Top plot ax1 = nexttile; plot(ax1,x,y1)
% Bottom plot ax2 = nexttile; plot(ax2,x,y2) grid(ax2,'on')
Input Arguments
visibility — Grid visibility
"on" | "off" | true or 1 | false or 0 | OnOffSwitchState value
Grid visibility, specified one of these values:
"on"or"off"— A value of"on"displays the grid, and"off"hides it. You can also specify the character vectors'on'or'off'.- Numeric or logical
1(true) or0(false) — A value of1ortruedisplays the grid, and0orfalsehides it. (since R2024a) - A matlab.lang.OnOffSwitchState value — A value of
matlab.lang.OnOffSwitchState.ondisplays the grid, andmatlab.lang.OnOffSwitchState.offhides it. (since R2024a)
target — Target object
axes | standalone visualization | array of axes or standalone visualizations
Target object, specified as one of the following:
- Any type of axes object: an
Axes,PolarAxes, orGeographicAxesobject. - A standalone visualization that has a
GridVisibleproperty. For example, aheatmap chart has aGridVisibleproperty. - An array of axes or standalone visualizations that belong to the same class. To determine the class, use the class function.
If you do not specify the target, then the grid function affects the graphics object returned by the gca command.
Tips
When working with Cartesian axes, some axes properties affect the appearance of the grid lines. This table lists a subset of axes properties related to the grid lines.
When working with polar axes, some polar axes properties affect the appearance of the grid lines. This table lists a subset of polar axes properties related to the grid lines.
When working with geographic axes, some geographic axes properties affect the appearance of the grid lines. This table lists a subset of geographic axes properties related to the grid lines. Note that
GeographicAxesobjects do not support minor grid lines.GeographicAxes Property Description Grid Display of latitude and longitude grid lines LineWidth Line width of grid lines, box outline, and tick marks GridLineStyle Grid line style GridColor Color of grid lines GridAlpha Grid line transparency
Algorithms
The grid function sets these graphics object properties to either 'on' or 'off':
- XGrid, YGrid, and ZGrid when working with Cartesian
Axesobjects. - ThetaGrid and RGrid when working with
PolarAxesobjects. - Grid when working with
GeographicAxesobjects. GridVisiblewhen working with other types of graphics objects, such as aHeatmapChartobject.
Version History
Introduced before R2006a
R2024a: Display or hide grid lines by specifying logical or OnOffSwitchState value
Display or hide the grid lines by specifying the visibility input argument as a logical value or as a matlab.lang.OnOffSwitchState value. The values 1 and true are equivalent to"on", and 0 and false are equivalent to "off".
The values "on" and "off" are still supported.