light - Create a light object - MATLAB (original) (raw)
Syntax
Description
light creates a Light object in the current axes.
You cannot see Light objects themselves, but you can see their effects on any patch and surface objects present in the axes containing the lights. A number of functions create patch and surface objects, including surf, mesh, pcolor, fill, and fill3, as well as the surface and patch functions.
light([Name,Value](#namevaluepairarguments)) sets light properties using one or more name-value arguments. For example, you can specify the color of a light as green by using light("Color","green"). For a list of properties, seeLight Properties.
light([ax](#mw%5F307ece5e-da8e-4c5f-831e-596e5b86edc5),___) creates the light in the axes specified by ax instead of in the current axes (gca). Specify ax as the first input argument followed by any of the input argument combinations in the previous syntaxes.
lt = light(___) returns a Light object. Use lt to modify properties of the light after creating it. For a list of properties, see Light Properties.
Examples
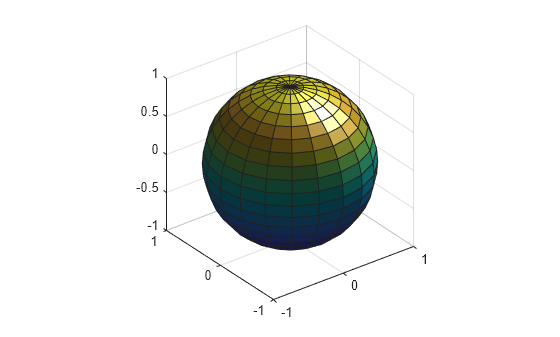
Create a Light Source
Create a sphere and light it using a Light object.
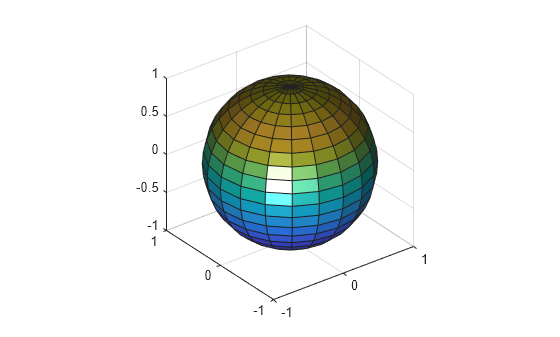
Create Local Light Source
Create a sphere and light it with a local light source directed straight at the sphere from the negative corner of the _x_- and _y_-axes.
sphere axis equal
light("Style","local","Position",[-10 -10 0]);
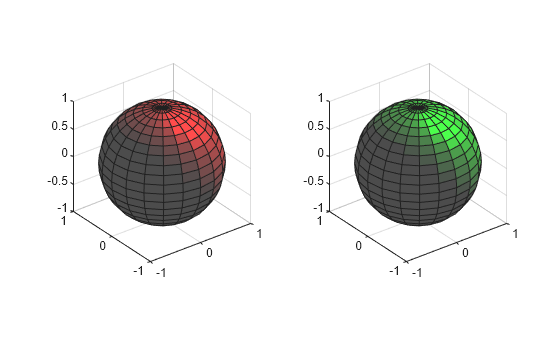
Specify Target Axes and Customize Light
You can display a tiling of plots using the tiledlayout and nexttile functions. Call the tiledlayout function to create a 1-by-2 tiled chart layout. Call the nexttile function to create the axes objects ax1 and ax2. Create a sphere and corresponding light in each plot by specifying each axes object as the first argument to sphere and light.
In the left axes, create a sphere and light it with a red light by specifying the Color property. In the right axes, create a sphere and light it with a green light.
colormap([1 1 1]) tiledlayout(1,2)
% Left sphere ax1 = nexttile; sphere(ax1) axis equal lt1 = light(ax1); lt1.Color = "r";
% Right sphere ax2 = nexttile; sphere(ax2) axis equal lt2 = light(ax2); lt2.Color = "g";
Input Arguments
ax — Axes object
axes object
Axes object. If you do not specify an axes object, then light creates the Light object in the current axes.
Name-Value Arguments
Specify optional pairs of arguments asName1=Value1,...,NameN=ValueN, where Name is the argument name and Value is the corresponding value. Name-value arguments must appear after other arguments, but the order of the pairs does not matter.
Example: light(Position=[-1 0 0],Style="local")
Before R2021a, use commas to separate each name and value, and enclose Name in quotes.
Example: light("Position",[-1 0 0],"Style","local")
Color — Color of light
[1 1 1] (default) | RGB triplet | hexadecimal color code | 'r' | 'g' | 'b' | ...
Color of light, specified as an RGB triplet, a hexadecimal color code, a color name, or a short name. The default RGB triplet of [1 1 1] corresponds to white.
RGB triplets and hexadecimal color codes are useful for specifying custom colors.
- An RGB triplet is a three-element row vector whose elements specify the intensities of the red, green, and blue components of the color. The intensities must be in the range
[0,1]; for example,[0.4 0.6 0.7]. - A hexadecimal color code is a character vector or a string scalar that starts with a hash symbol (
#) followed by three or six hexadecimal digits, which can range from0toF. The values are not case sensitive. Thus, the color codes"#FF8800","#ff8800","#F80", and"#f80"are equivalent.
Alternatively, you can specify some common colors by name. This table lists the named color options, the equivalent RGB triplets, and hexadecimal color codes.
| Color Name | Short Name | RGB Triplet | Hexadecimal Color Code | Appearance |
|---|---|---|---|---|
| "red" | "r" | [1 0 0] | "#FF0000" |  |
| "green" | "g" | [0 1 0] | "#00FF00" |  |
| "blue" | "b" | [0 0 1] | "#0000FF" |  |
| "cyan" | "c" | [0 1 1] | "#00FFFF" |  |
| "magenta" | "m" | [1 0 1] | "#FF00FF" |  |
| "yellow" | "y" | [1 1 0] | "#FFFF00" |  |
| "black" | "k" | [0 0 0] | "#000000" |  |
| "white" | "w" | [1 1 1] | "#FFFFFF" |  |
Here are the RGB triplets and hexadecimal color codes for the default colors MATLAB® uses in many types of plots.
| RGB Triplet | Hexadecimal Color Code | Appearance |
|---|---|---|
| [0 0.4470 0.7410] | "#0072BD" | ![Sample of RGB triplet [0 0.4470 0.7410], which appears as dark blue](https://www.mathworks.com/help/matlab/ref/colororder1.png) |
| [0.8500 0.3250 0.0980] | "#D95319" | ![Sample of RGB triplet [0.8500 0.3250 0.0980], which appears as dark orange](https://www.mathworks.com/help/matlab/ref/colororder2.png) |
| [0.9290 0.6940 0.1250] | "#EDB120" | ![Sample of RGB triplet [0.9290 0.6940 0.1250], which appears as dark yellow](https://www.mathworks.com/help/matlab/ref/colororder3.png) |
| [0.4940 0.1840 0.5560] | "#7E2F8E" | ![Sample of RGB triplet [0.4940 0.1840 0.5560], which appears as dark purple](https://www.mathworks.com/help/matlab/ref/colororder4.png) |
| [0.4660 0.6740 0.1880] | "#77AC30" | ![Sample of RGB triplet [0.4660 0.6740 0.1880], which appears as medium green](https://www.mathworks.com/help/matlab/ref/colororder5.png) |
| [0.3010 0.7450 0.9330] | "#4DBEEE" | ![Sample of RGB triplet [0.3010 0.7450 0.9330], which appears as light blue](https://www.mathworks.com/help/matlab/ref/colororder6.png) |
| [0.6350 0.0780 0.1840] | "#A2142F" | ![Sample of RGB triplet [0.6350 0.0780 0.1840], which appears as dark red](https://www.mathworks.com/help/matlab/ref/colororder7.png) |
Example: 'green'
Style — Type of light source
"infinite" (default) | "local"
Type of light source, specified as one of these values:
"infinite"— Place the light at infinity. Use thePosition property to specify the direction from which the light shines in parallel rays."local"— Place the light at the location specified by thePositionproperty. The light is a point source that radiates from the location in all directions.
Position — Location of light source
[1 0 1] (default) | three-element vector of the form [x y z]
Location of light source, specified as a three-element vector of the form[x y z]. Define the vector elements in data units from the axes origin to the (x, y, z) coordinate. The actual location of the light depends on the value of theStyle property.
Example: [-40 -4 140]
Version History
Introduced before R2006a