surface - Primitive surface plot - MATLAB (original) (raw)
Syntax
Description
surface([X](#mw%5F8e41d75c-2d91-4ce5-a031-67968b72dc07),[Y](#mw%5F4d70d4d6-e7be-4551-bb6d-02a11ddd45e4),[Z](#mw%5Fac3abbb8-7942-4b4f-baec-e6fadcc505de)) creates a primitive, three-dimensional surface plot. The function plots the values in matrix Z as heights above a grid in the_x_-y plane defined byX and Y. The color of the surface varies according to the heights specified by Z.
Unlike the surf function, the primitivesurface function does not call newplot before plotting and does not respect the value of the NextPlot property for the figure or axes. Instead, it adds the surface plot to the current axes without deleting other graphics objects or resetting axes properties.
surface([X](#mw%5F8e41d75c-2d91-4ce5-a031-67968b72dc07),[Y](#mw%5F4d70d4d6-e7be-4551-bb6d-02a11ddd45e4),[Z](#mw%5Fac3abbb8-7942-4b4f-baec-e6fadcc505de),[C](#mw%5Fd64a35c5-4287-4c45-af8f-41f697503175)) additionally specifies the surface color.
surface([Z](#mw%5Fac3abbb8-7942-4b4f-baec-e6fadcc505de)) creates a primitive surface plot and uses the column and row indices of the elements inZ as the _x_- and_y_-coordinates.
surface([Z](#mw%5Fac3abbb8-7942-4b4f-baec-e6fadcc505de),[C](#mw%5Fd64a35c5-4287-4c45-af8f-41f697503175)) additionally specifies the surface color.
surface([ax](#mw%5Fc5366089-0bb8-4d6b-ad0a-27d3b443ae7e),___) plots into the axes specified by ax instead of the current axes. Specify the axes as the first input argument.
surface(___,[Name,Value](#namevaluepairarguments)) specifies surface properties using one or more name-value pair arguments. For example, 'FaceAlpha',0.5 creates a semitransparent surface.
s = surface(___) returns the chart primitive surface object. Use s to modify the surface after it is created. For a list of properties, see Surface Properties.
Examples
Create Surface Plot
Create three matrices of the same size. Then plot them as a surface. The surface uses Z for both height and color.
[X,Y] = meshgrid(1:0.5:10,1:20); Z = sin(X) + cos(Y); surface(X,Y,Z)
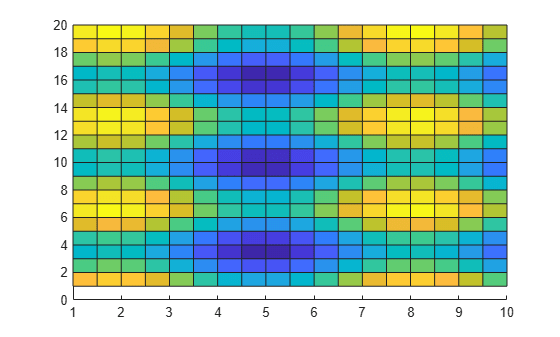
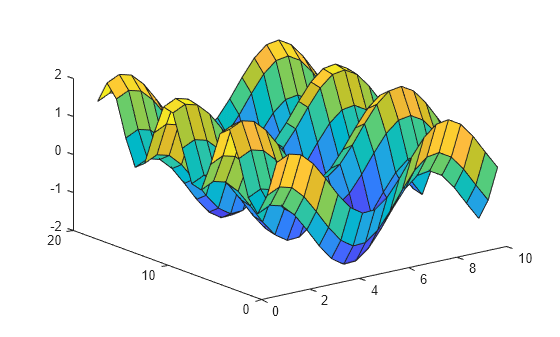
By default, surface displays in the axes using a two-dimensional view. Change the axes to a three-dimensional view.
Specify Colormap Colors for Surface Plot
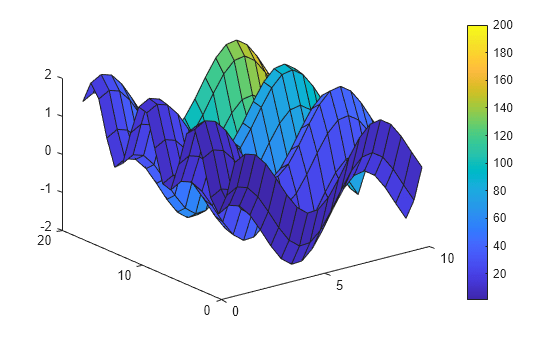
Specify the colors for a surface plot by including a fourth matrix input, C. The mesh plot uses Z for height and C for color. Specify the colors using a colormap, which uses single numbers to stand for colors on a spectrum. When you use a colormap, C is the same size as Z. Add a color bar to the graph to show how the data values in C correspond to the colors in the colormap, and set the view of the plot to the default three-dimensional view.
[X,Y] = meshgrid(1:0.5:10,1:20); Z = sin(X) + cos(Y); C = X.*Y; surface(X,Y,Z,C) colorbar view(3)
Modify Surface Plot Appearance
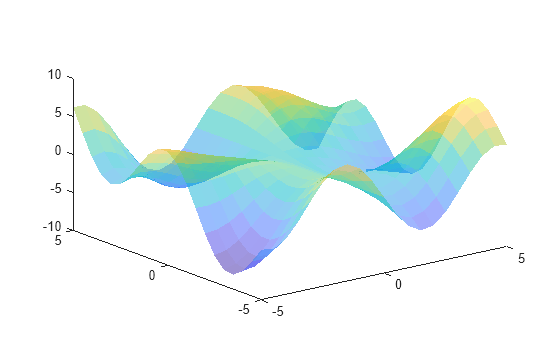
Create a semitransparent surface by specifying the FaceAlpha name-value pair with 0.5 as the value. To allow further modifications, assign the surface object to the variable s.
[X,Y] = meshgrid(-5:.5:5); Z = Y.*sin(X) - X.*cos(Y); s = surface(X,Y,Z,'FaceAlpha',0.5); view(3)
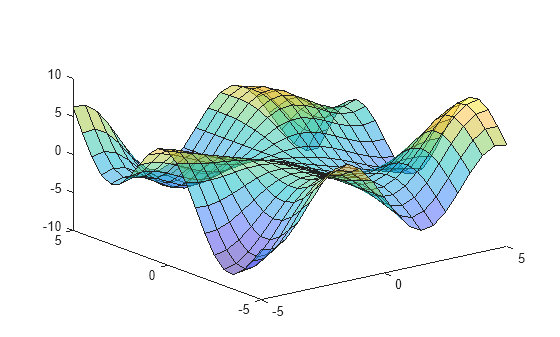
Use s to access and modify properties of the surface object after it is created. For example, hide the edges by setting the EdgeColor property.
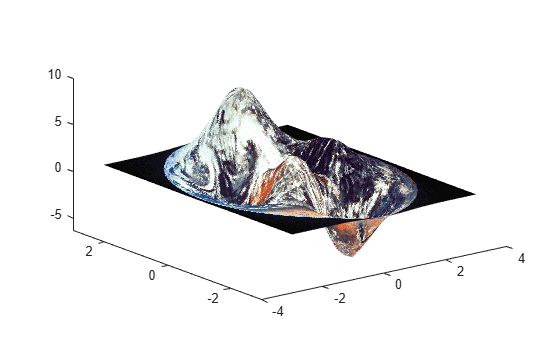
Display Image Along Surface Plot
Create a surface and display an image along it.
Create three matrices of the same size.
Load a data set containing an image of the Earth. The image data appears in a workspace variable X, and the associated colormap appears in map.
Your variables are:
X map pX pY pZ
Create a surface plot and display the image along the surface. Since the surface data pZ and the color data X have different sizes, set the surface FaceColor to 'texturemap'. Set the view of the plot to the default three-dimensional view.
surface(pX,pY,pZ,X,'FaceColor','texturemap', ... 'EdgeColor','none','CDataMapping','direct') colormap(map) view(3)
Input Arguments
X — _x_-coordinates
matrix | vector
_x_-coordinates, specified as a matrix the same size asZ, or as a vector with length n, where [m,n] = size(Z). If you do not specify values forX and Y,surface uses the vectors (1:n) and (1:m).
You can use the meshgrid function to createX and Y matrices.
The XData property of the Surface object stores the _x_-coordinates.
Example: X = 1:10
Example: X = [1 2 3; 1 2 3; 1 2 3]
Example: [X,Y] = meshgrid(-5:0.5:5)
Data Types: single | double | int8 | int16 | int32 | int64 | uint8 | uint16 | uint32 | uint64 | categorical | datetime | duration
Y — _y_-coordinates
matrix | vector
_y_-coordinates, specified as a matrix the same size asZ or as a vector with length m, where [m,n] = size(Z). If you do not specify values forX and Y,surface uses the vectors (1:n) and (1:m).
You can use the meshgrid function to create the X and Y matrices.
The YData property of the surface object stores the_y_-coordinates.
Example: Y = 1:10
Example: Y = [1 1 1; 2 2 2; 3 3 3]
Example: [X,Y] = meshgrid(-5:0.5:5)
Data Types: single | double | int8 | int16 | int32 | int64 | uint8 | uint16 | uint32 | uint64 | categorical | datetime | duration
Z — _z_-coordinates
matrix
_z_-coordinates, specified as a matrix.Z must have at least two rows and two columns.
Z specifies the height of the surface plot at each_x_-y coordinate. If you do not specify the colors, then Z also specifies the surface colors.
The ZData property of the surface object stores the_z_-coordinates.
Example: Z = [1 2 3; 4 5 6]
Example: Z = sin(x) + cos(y)
Data Types: single | double | int8 | int16 | int32 | int64 | uint8 | uint16 | uint32 | uint64 | categorical | datetime | duration
C — Color array
matrix | m-by-n-by-3 array of RGB triplets
Color array, specified as an m-by-n matrix of colormap indices or as anm-by-n-by-3 array of RGB triplets, where Z ism-by-n.
- To use colormap colors, specify
Cas a matrix. For each grid point on the surface,Cindicates a color in the colormap. TheCDataMappingproperty of the surface object controls how the values inCcorrespond to colors in the colormap. - To use truecolor colors, specify
Cas an array of RGB triplets.
For more information, see Differences Between Colormaps and Truecolor.
The CData property of the surface object stores the color array. For additional control over the surface coloring, use theFaceColor and EdgeColor properties.
ax — Axes to plot in
axes object
Axes to plot in, specified as an axes object. If you do not specify the axes, then surface plots into the current axes.
Name-Value Arguments
Specify optional pairs of arguments asName1=Value1,...,NameN=ValueN, where Name is the argument name and Value is the corresponding value. Name-value arguments must appear after other arguments, but the order of the pairs does not matter.
Before R2021a, use commas to separate each name and value, and enclose Name in quotes.
Example: surface(X,Y,Z,'FaceAlpha',0.5,'EdgeColor','none') creates a semitransparent surface with no edges drawn.
Note
The properties listed here are only a subset. For a full list, see Surface Properties.
Edge line color, specified as one of the values listed here. The default color of [0 0 0] corresponds to black edges.
| Value | Description |
|---|---|
| 'none' | Do not draw the edges. |
| 'flat' | Use a different color for each edge based on the values in the CData property. First you must specify the CData property as a matrix the same size as ZData. The color value at the first vertex of each face (in the positive x and y directions) determines the color for the adjacent edges. You cannot use this value when the EdgeAlpha property is set to 'interp'.  |
| 'interp' | Use interpolated coloring for each edge based on the values in theCData property. First you must specify theCData property as a matrix the same size asZData. The color varies across each edge by linearly interpolating the color values at the vertices. You cannot use this value when theEdgeAlpha property is set to'flat'.  |
| RGB triplet, hexadecimal color code, or color name | Use the specified color for all the edges. This option does not use the color values in the CData property. 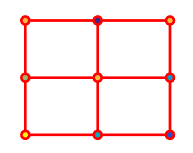 |
RGB triplets and hexadecimal color codes are useful for specifying custom colors.
- An RGB triplet is a three-element row vector whose elements specify the intensities of the red, green, and blue components of the color. The intensities must be in the range
[0,1]; for example,[0.4 0.6 0.7]. - A hexadecimal color code is a character vector or a string scalar that starts with a hash symbol (
#) followed by three or six hexadecimal digits, which can range from0toF. The values are not case sensitive. Thus, the color codes"#FF8800","#ff8800","#F80", and"#f80"are equivalent.
Alternatively, you can specify some common colors by name. This table lists the named color options, the equivalent RGB triplets, and hexadecimal color codes.
| Color Name | Short Name | RGB Triplet | Hexadecimal Color Code | Appearance |
|---|---|---|---|---|
| "red" | "r" | [1 0 0] | "#FF0000" |  |
| "green" | "g" | [0 1 0] | "#00FF00" |  |
| "blue" | "b" | [0 0 1] | "#0000FF" |  |
| "cyan" | "c" | [0 1 1] | "#00FFFF" |  |
| "magenta" | "m" | [1 0 1] | "#FF00FF" |  |
| "yellow" | "y" | [1 1 0] | "#FFFF00" |  |
| "black" | "k" | [0 0 0] | "#000000" |  |
| "white" | "w" | [1 1 1] | "#FFFFFF" |  |
Here are the RGB triplets and hexadecimal color codes for the default colors MATLAB® uses in many types of plots.
| RGB Triplet | Hexadecimal Color Code | Appearance |
|---|---|---|
| [0 0.4470 0.7410] | "#0072BD" | ![Sample of RGB triplet [0 0.4470 0.7410], which appears as dark blue](https://www.mathworks.com/help/matlab/ref/colororder1.png) |
| [0.8500 0.3250 0.0980] | "#D95319" | ![Sample of RGB triplet [0.8500 0.3250 0.0980], which appears as dark orange](https://www.mathworks.com/help/matlab/ref/colororder2.png) |
| [0.9290 0.6940 0.1250] | "#EDB120" | ![Sample of RGB triplet [0.9290 0.6940 0.1250], which appears as dark yellow](https://www.mathworks.com/help/matlab/ref/colororder3.png) |
| [0.4940 0.1840 0.5560] | "#7E2F8E" | ![Sample of RGB triplet [0.4940 0.1840 0.5560], which appears as dark purple](https://www.mathworks.com/help/matlab/ref/colororder4.png) |
| [0.4660 0.6740 0.1880] | "#77AC30" | ![Sample of RGB triplet [0.4660 0.6740 0.1880], which appears as medium green](https://www.mathworks.com/help/matlab/ref/colororder5.png) |
| [0.3010 0.7450 0.9330] | "#4DBEEE" | ![Sample of RGB triplet [0.3010 0.7450 0.9330], which appears as light blue](https://www.mathworks.com/help/matlab/ref/colororder6.png) |
| [0.6350 0.0780 0.1840] | "#A2142F" | ![Sample of RGB triplet [0.6350 0.0780 0.1840], which appears as dark red](https://www.mathworks.com/help/matlab/ref/colororder7.png) |
Line style, specified as one of the options listed in this table.
| Line Style | Description | Resulting Line |
|---|---|---|
| "-" | Solid line |  |
| "--" | Dashed line |  |
| ":" | Dotted line |  |
| "-." | Dash-dotted line |  |
| "none" | No line | No line |
Face color, specified as one of the values in this table.
| Value | Description |
|---|---|
| 'flat' | Use a different color for each face based on the values in the CData property. First you must specify the CData property as a matrix the same size as ZData. The color value at the first vertex of each face (in the positive x and y directions) determines the color for the entire face. You cannot use this value when the FaceAlpha property is set to 'interp'. 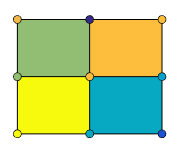 |
| 'interp' | Use interpolated coloring for each face based on the values in theCData property. First you must specify theCData property as a matrix the same size asZData. The color varies across each face by interpolating the color values at the vertices. You cannot use this value when theFaceAlpha property is set to 'flat'. 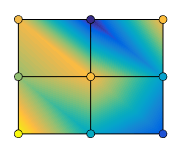 |
| RGB triplet, hexadecimal color code, or color name | Use the specified color for all the faces. This option does not use the color values in the CData property. 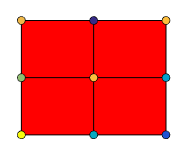 |
| 'texturemap' | Transform the color data in CData so that it conforms to the surface. |
| 'none' | Do not draw the faces. |
RGB triplets and hexadecimal color codes are useful for specifying custom colors.
- An RGB triplet is a three-element row vector whose elements specify the intensities of the red, green, and blue components of the color. The intensities must be in the range
[0,1]; for example,[0.4 0.6 0.7]. - A hexadecimal color code is a character vector or a string scalar that starts with a hash symbol (
#) followed by three or six hexadecimal digits, which can range from0toF. The values are not case sensitive. Thus, the color codes"#FF8800","#ff8800","#F80", and"#f80"are equivalent.
Alternatively, you can specify some common colors by name. This table lists the named color options, the equivalent RGB triplets, and hexadecimal color codes.
| Color Name | Short Name | RGB Triplet | Hexadecimal Color Code | Appearance |
|---|---|---|---|---|
| "red" | "r" | [1 0 0] | "#FF0000" | |
| "green" | "g" | [0 1 0] | "#00FF00" | |
| "blue" | "b" | [0 0 1] | "#0000FF" | |
| "cyan" | "c" | [0 1 1] | "#00FFFF" | |
| "magenta" | "m" | [1 0 1] | "#FF00FF" | |
| "yellow" | "y" | [1 1 0] | "#FFFF00" | |
| "black" | "k" | [0 0 0] | "#000000" | |
| "white" | "w" | [1 1 1] | "#FFFFFF" | |
Here are the RGB triplets and hexadecimal color codes for the default colors MATLAB uses in many types of plots.
| RGB Triplet | Hexadecimal Color Code | Appearance |
|---|---|---|
| [0 0.4470 0.7410] | "#0072BD" | |
| [0.8500 0.3250 0.0980] | "#D95319" | |
| [0.9290 0.6940 0.1250] | "#EDB120" | |
| [0.4940 0.1840 0.5560] | "#7E2F8E" | |
| [0.4660 0.6740 0.1880] | "#77AC30" | |
| [0.3010 0.7450 0.9330] | "#4DBEEE" | |
| [0.6350 0.0780 0.1840] | "#A2142F" | |
Face transparency, specified as one of these values:
- Scalar in range
[0,1]— Use uniform transparency across all the faces. A value of1is fully opaque and0is completely transparent. Values between0and1are semitransparent. This option does not use the transparency values in theAlphaDataproperty. 'flat'— Use a different transparency for each face based on the values in theAlphaDataproperty. The transparency value at the first vertex determines the transparency for the entire face. First you must specify theAlphaDataproperty as a matrix the same size as theZDataproperty. The FaceColor property also must be set to'flat'.'interp'— Use interpolated transparency for each face based on the values inAlphaDataproperty. The transparency varies across each face by interpolating the values at the vertices. First you must specify theAlphaDataproperty as a matrix the same size as theZDataproperty. TheFaceColorproperty also must be set to'interp'.'texturemap'— Transform the data inAlphaDataso that it conforms to the surface.
Effect of light objects on faces, specified as one of these values:
'flat'— Apply light uniformly across each face. Use this value to view faceted objects.'gouraud'— Vary the light across the faces. Calculate the light at the vertices and then linearly interpolate the light across the faces. Use this value to view curved surfaces.'none'— Do not apply light from light objects to the faces.
To add a light object to the axes, use the light function.
Note
The 'phong' value has been removed. Use 'gouraud' instead.
Version History
Introduced before R2006a