NumericRuler - Control axis with numeric values - MATLAB (original) (raw)
NumericRuler Properties
Control axis with numeric values
NumericRuler properties control the appearance and behavior of an _x_-axis, _y_-axis, or _z_-axis that shows numeric values. Each individual axis has its own ruler object. By changing property values of the ruler, you can modify certain aspects of a specific axis.
Use dot notation to refer to a particular ruler and property. Access the ruler objects through the XAxis, YAxis, andZAxis properties of the Axes object.
ax = gca; co = ax.XAxis.Color; ax.XAxis.Color = 'blue';
Appearance
Color of the axis line and labels, specified as an RGB triplet, a hexadecimal color code, a color name, or a short name.
For a custom color, specify an RGB triplet or a hexadecimal color code.
- An RGB triplet is a three-element row vector whose elements specify the intensities of the red, green, and blue components of the color. The intensities must be in the range
[0,1], for example,[0.4 0.6 0.7]. - A hexadecimal color code is a string scalar or character vector that starts with a hash symbol (
#) followed by three or six hexadecimal digits, which can range from0toF. The values are not case sensitive. Therefore, the color codes"#FF8800","#ff8800","#F80", and"#f80"are equivalent.
Alternatively, you can specify some common colors by name. This table lists the named color options, the equivalent RGB triplets, and hexadecimal color codes.
| Color Name | Short Name | RGB Triplet | Hexadecimal Color Code | Appearance |
|---|---|---|---|---|
| "red" | "r" | [1 0 0] | "#FF0000" |  |
| "green" | "g" | [0 1 0] | "#00FF00" |  |
| "blue" | "b" | [0 0 1] | "#0000FF" |  |
| "cyan" | "c" | [0 1 1] | "#00FFFF" |  |
| "magenta" | "m" | [1 0 1] | "#FF00FF" |  |
| "yellow" | "y" | [1 1 0] | "#FFFF00" |  |
| "black" | "k" | [0 0 0] | "#000000" |  |
| "white" | "w" | [1 1 1] | "#FFFFFF" |  |
| "none" | Not applicable | Not applicable | Not applicable | No color |
Here are the RGB triplets and hexadecimal color codes for the default colors MATLAB® uses in many types of plots.
| RGB Triplet | Hexadecimal Color Code | Appearance |
|---|---|---|
| [0 0.4470 0.7410] | "#0072BD" | ![Sample of RGB triplet [0 0.4470 0.7410], which appears as dark blue](https://www.mathworks.com/help/matlab/ref/colororder1.png) |
| [0.8500 0.3250 0.0980] | "#D95319" | ![Sample of RGB triplet [0.8500 0.3250 0.0980], which appears as dark orange](https://www.mathworks.com/help/matlab/ref/colororder2.png) |
| [0.9290 0.6940 0.1250] | "#EDB120" | ![Sample of RGB triplet [0.9290 0.6940 0.1250], which appears as dark yellow](https://www.mathworks.com/help/matlab/ref/colororder3.png) |
| [0.4940 0.1840 0.5560] | "#7E2F8E" | ![Sample of RGB triplet [0.4940 0.1840 0.5560], which appears as dark purple](https://www.mathworks.com/help/matlab/ref/colororder4.png) |
| [0.4660 0.6740 0.1880] | "#77AC30" | ![Sample of RGB triplet [0.4660 0.6740 0.1880], which appears as medium green](https://www.mathworks.com/help/matlab/ref/colororder5.png) |
| [0.3010 0.7450 0.9330] | "#4DBEEE" | ![Sample of RGB triplet [0.3010 0.7450 0.9330], which appears as light blue](https://www.mathworks.com/help/matlab/ref/colororder6.png) |
| [0.6350 0.0780 0.1840] | "#A2142F" | ![Sample of RGB triplet [0.6350 0.0780 0.1840], which appears as dark red](https://www.mathworks.com/help/matlab/ref/colororder7.png) |
Note
The Color property for the ruler and the associatedXColor, YColor, orZColor property for the parent axes always have the same value. Setting one also sets the other.
Width of axis line and tick marks, specified as a positive value in point units. One point equals 1/72 inch.
Example: ax.XAxis.LineWidth = 2;
Note
Setting the LineWidth property for the parent axes sets the LineWidth property for the ruler to the same value. However, setting the ruler property does not set the axes property. To prevent the axes property value from overriding the ruler property value, set the axes value first, and then set the ruler value.
Axis label, which is a text object. To display text or change existing text, set the String property for the text object. Use other properties to change the text appearance, such as the font style or color.
ax = gca; ax.XAxis.Label.String = 'X Axis'; ax.XAxis.Label.FontSize = 12;
For a full list of options, see Text Properties.
Alternatively, add or modify the axis labels using the xlabel, ylabel, and zlabel functions.
Note
- The text object is not a child of the ruler object, so it cannot be returned by findobj and it does not use the default text property values.
- The text object stored in this property is the same as the text object stored in the parent object’s label property. Thus, you can modify the text object using either the ruler or the parent object’s property. For example, setting the font size on a text object stored in an_x_-axis ruler’s
Labelproperty is the same as setting the font size on the text object stored in theXLabelproperty of the parent axes.
LabelHorizontalAlignment — Axis label horizontal alignment
'center' (default) | 'left' | 'right'
Axis label horizontal alignment, specified as one of the values from the table.
| LabelHorizontalAlignment Value | Description | Appearance |
|---|---|---|
| 'center' | For a horizontal axis, the label is centered between the left and right edges of the plot box.For a vertical axis, the label is centered between the top and bottom edges of the plot box. | 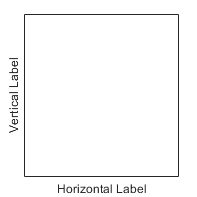 |
| 'left' | For a horizontal axis, the label is aligned with the left edge of the plot box.For a vertical axis, the label is aligned with the bottom edge of the plot box. | 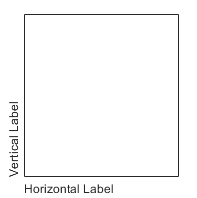 |
| 'right' | For a horizontal axis, the label is aligned with the right edge of the plot box.For a vertical axis, the label is aligned with the top edge of the plot box. | 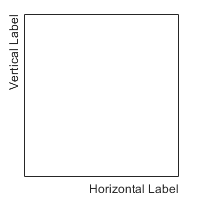 |
Axis visibility, specified as 'on' or 'off', or as numeric or logical 1 (true) or0 (false). A value of 'on' is equivalent to true, and 'off' is equivalent tofalse. Thus, you can use the value of this property as a logical value. The value is stored as an on/off logical value of type matlab.lang.OnOffSwitchState.
'on'— Display the axis.'off'— Hide the axis without deleting it. You still can access properties of an invisible axis using the ruler object.
Example: ax.XAxis.Visible = 'off';
Scale and Direction
Minimum and maximum axis limits, specified as a two-element vector of the form [min max].
If you assign a value to this property, then MATLAB sets the associated mode to 'manual'.
Alternatively, set the limits using the xlim, ylim, and zlim functions.
Note
The Limits property for the ruler and the associated XLim, YLim, or ZLim property for the parent axes always have the same value. Setting one also sets the other.
Example: ax.XAxis.Limits = [-10 10];
Selection mode for the Limits property, specified as one of these values:
'auto'— Automatically select the axis limits based on the data plotted.'manual'— Use axis limit values that you specify. To specify the axis limits, set theLimitsproperty.
Note
The LimitsMode property for the ruler and the associated XLimMode, YLimMode, or ZLimMode property for the parent axes always have the same value. Setting one also sets the other.
Scale of values along axis, specified as 'linear' or 'log'.
Note
The Scale property for the ruler and the associated XScale, YScale, or ZScale property for the parent axes always have the same value. Setting one also sets the other.
Example: ax.XAxis.Scale = 'log';
Direction of increasing values, specified as one of these values:
'normal'— Values increase from left to right or bottom to top.'reverse'— Values increase from right to left or top to bottom.
Note
The Direction property for the ruler and the associated XDir, YDir, or ZDir property for the parent axes always have the same value. Setting one also sets the other.
Example: ax.XAxis.Direction = 'reverse';
Tick Values and Labels
Tick mark locations along the axis, specified as a vector of increasing values.
Example: ax.XAxis.TickValues = [2 4 6 8 10];
Example: ax.XAxis.TickValues = 0:10:100;
If you assign a value to this property, then MATLAB sets the TickValuesMode property to 'manual'.
Alternatively, use the xticks, yticks, and zticks functions.
Note
The TickValues property for the ruler and the associated XTick, YTick, or ZTick property for the parent axes always have the same value. Setting one also sets the other.
Selection mode for the TickValues property, specified as one of these values:
'auto'— Automatically select the tick values based on the data plotted.'manual'— Use tick values that you specify. To specify the values, set theTickValuesproperty.
Note
The TickValuesMode property for the ruler and the associated XTickMode, YTickMode, or ZTickMode property for the parent axes always have the same value. Setting one also sets the other.
Exponent — Exponential notation common to all tick values
integer value
Exponential notation common to all tick values, specified as an integer value. The axis displays the secondary label 105.
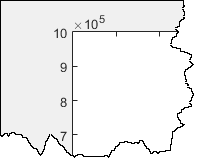
The base value is always 10. However, you can change the exponent value by setting the Exponent property. For example, change the exponent to 2.
ax = gca; ax.YAxis.Exponent = 2;
If the exponent value is 0, then the exponent label does not display.
If you assign a value to this property, then MATLAB sets the ExponentMode property to'manual'. If the axis has a log scale, then theExponent property has no effect.
ExponentMode — Selection mode for Exponent property
'auto' (default) | 'manual'
Selection mode for the Exponent property, specified as one of these values:
'auto'— Automatically select the exponent value based on the axis limits.'manual'— Use an exponent value that you specify. To specify the value, set theExponentproperty.
Tick mark labels, specified as a cell array of character vectors, string array, or categorical array. If you do not specify enough labels for all of the tick values, then the labels repeat. The labels support TeX and LaTeX markup. See theTickLabelInterpreter property for more information.
Example: ax.XAxis.TickLabels = {'January','February','March','April','May'}';
Example: ax.YAxis.TickLabels = {'\pi','2\pi','3\pi'}'
If you set this property, then MATLAB sets the TickLabelsMode property to 'manual'.
Alternatively, specify the tick labels using the xticklabels, yticklabels, and zticklabels functions.
Note
- If you specify this property as a categorical array, MATLAB uses the values in the array, not the categories.
- The
TickLabelsproperty for the ruler and the associatedXTickLabel,YTickLabel, orZTickLabelproperty for the parent axes always have the same value. Setting one also sets the other.
Data Types: char | string | categorical
Selection mode for the TickLabels property, specified as one of these values:
'auto'— Automatically select the tick labels.'manual'— Use tick labels that you specify. To specify the labels, set theTickLabelsproperty.
Note
The TickLabelsMode property for the ruler and the associated XTickLabelMode, YTickLabelMode, or ZTickLabelMode property for the parent axes always have the same value. Setting one also sets the other.
TickLabelColor — Tick label color
[0.15 0.15 0.15] (default) | RGB triplet | hexadecimal color code | 'r' | 'g' | 'b' | ...
Tick label color, specified as an RGB triplet, a hexadecimal color code, a color name, or a short name.
For a custom color, specify an RGB triplet or a hexadecimal color code.
- An RGB triplet is a three-element row vector whose elements specify the intensities of the red, green, and blue components of the color. The intensities must be in the range
[0,1], for example,[0.4 0.6 0.7]. - A hexadecimal color code is a string scalar or character vector that starts with a hash symbol (
#) followed by three or six hexadecimal digits, which can range from0toF. The values are not case sensitive. Therefore, the color codes"#FF8800","#ff8800","#F80", and"#f80"are equivalent.
Alternatively, you can specify some common colors by name. This table lists the named color options, the equivalent RGB triplets, and hexadecimal color codes.
| Color Name | Short Name | RGB Triplet | Hexadecimal Color Code | Appearance |
|---|---|---|---|---|
| "red" | "r" | [1 0 0] | "#FF0000" | |
| "green" | "g" | [0 1 0] | "#00FF00" | |
| "blue" | "b" | [0 0 1] | "#0000FF" | |
| "cyan" | "c" | [0 1 1] | "#00FFFF" | |
| "magenta" | "m" | [1 0 1] | "#FF00FF" | |
| "yellow" | "y" | [1 1 0] | "#FFFF00" | |
| "black" | "k" | [0 0 0] | "#000000" | |
| "white" | "w" | [1 1 1] | "#FFFFFF" | |
| "none" | Not applicable | Not applicable | Not applicable | No color |
Here are the RGB triplets and hexadecimal color codes for the default colors MATLAB uses in many types of plots.
| RGB Triplet | Hexadecimal Color Code | Appearance |
|---|---|---|
| [0 0.4470 0.7410] | "#0072BD" | |
| [0.8500 0.3250 0.0980] | "#D95319" | |
| [0.9290 0.6940 0.1250] | "#EDB120" | |
| [0.4940 0.1840 0.5560] | "#7E2F8E" | |
| [0.4660 0.6740 0.1880] | "#77AC30" | |
| [0.3010 0.7450 0.9330] | "#4DBEEE" | |
| [0.6350 0.0780 0.1840] | "#A2142F" | |
Note
Setting the ruler’s Color property also sets theTickLabelColor property to the same value. However, setting the TickLabelColor property does not change theColor property. To prevent the Color property value from overriding the TickLabelColor property value, set the Color property first, and then set theTickLabelColor property.
Tick label interpreter, specified as one of these values:
'tex'— Interpret characters using a subset of TeX markup.'latex'— Interpret characters using LaTeX markup. When you specify the tick labels, use dollar signs around each element in the cell array.'none'— Display literal characters.
Note
Setting the TickLabelInterpreter property for the parent axes sets the TickLabelInterpreter property for the ruler to the same value. However, setting the ruler property does not set the axes property. To prevent the axes property value from overriding the ruler property value, set the axes value first, and then set the ruler value.
TeX Markup
By default, MATLAB supports a subset of TeX markup. Use TeX markup to add superscripts and subscripts, modify the text type and color, and include special characters in the text.
Modifiers remain in effect until the end of the text. Superscripts and subscripts are an exception because they modify only the next character or the characters within the curly braces. When you set the interpreter to 'tex', the supported modifiers are as follows.
| Modifier | Description | Example |
|---|---|---|
| ^{ } | Superscript | 'text^{superscript}' |
| _{ } | Subscript | 'text_{subscript}' |
| \bf | Bold font | '\bf text' |
| \it | Italic font | '\it text' |
| \sl | Oblique font (usually the same as italic font) | '\sl text' |
| \rm | Normal font | '\rm text' |
| \fontname{specifier} | Font name — Replace_specifier_ with the name of a font family. You can use this in combination with other modifiers. | '\fontname{Courier} text' |
| \fontsize{specifier} | Font size —Replace_specifier_ with a numeric scalar value in point units. | '\fontsize{15} text' |
| \color{specifier} | Font color — Replace_specifier_ with one of these colors: red, green,yellow, magenta,blue, black,white, gray,darkGreen, orange, orlightBlue. | '\color{magenta} text' |
| \color[rgb]{specifier} | Custom font color — Replace_specifier_ with a three-element RGB triplet. | '\color[rgb]{0,0.5,0.5} text' |
This table lists the supported special characters for the'tex' interpreter.
| Character Sequence | Symbol | Character Sequence | Symbol | Character Sequence | Symbol |
|---|---|---|---|---|---|
| \alpha | α | \upsilon | υ | \sim | ~ |
| \angle | ∠ | \phi | ϕ | \leq | ≤ |
| \ast | * | \chi | χ | \infty | ∞ |
| \beta | β | \psi | ψ | \clubsuit | ♣ |
| \gamma | γ | \omega | ω | \diamondsuit | ♦ |
| \delta | δ | \Gamma | Γ | \heartsuit | ♥ |
| \epsilon | ϵ | \Delta | Δ | \spadesuit | ♠ |
| \zeta | ζ | \Theta | Θ | \leftrightarrow | ↔ |
| \eta | η | \Lambda | Λ | \leftarrow | ← |
| \theta | θ | \Xi | Ξ | \Leftarrow | ⇐ |
| \vartheta | ϑ | \Pi | Π | \uparrow | ↑ |
| \iota | ι | \Sigma | Σ | \rightarrow | → |
| \kappa | κ | \Upsilon | ϒ | \Rightarrow | ⇒ |
| \lambda | λ | \Phi | Φ | \downarrow | ↓ |
| \mu | µ | \Psi | Ψ | \circ | º |
| \nu | ν | \Omega | Ω | \pm | ± |
| \xi | ξ | \forall | ∀ | \geq | ≥ |
| \pi | π | \exists | ∃ | \propto | ∝ |
| \rho | ρ | \ni | ∍ | \partial | ∂ |
| \sigma | σ | \cong | ≅ | \bullet | • |
| \varsigma | ς | \approx | ≈ | \div | ÷ |
| \tau | τ | \Re | ℜ | \neq | ≠ |
| \equiv | ≡ | \oplus | ⊕ | \aleph | ℵ |
| \Im | ℑ | \cup | ∪ | \wp | ℘ |
| \otimes | ⊗ | \subseteq | ⊆ | \oslash | ∅ |
| \cap | ∩ | \in | ∈ | \supseteq | ⊇ |
| \supset | ⊃ | \lceil | ⌈ | \subset | ⊂ |
| \int | ∫ | \cdot | · | \o | ο |
| \rfloor | ⌋ | \neg | ¬ | \nabla | ∇ |
| \lfloor | ⌊ | \times | x | \ldots | ... |
| \perp | ⊥ | \surd | √ | \prime | ´ |
| \wedge | ∧ | \varpi | ϖ | \0 | ∅ |
| \rceil | ⌉ | \rangle | 〉 | \mid | | |
| \vee | ∨ | \langle | 〈 | \copyright | © |
LaTeX Markup
To use LaTeX markup, set the TickLabelInterpreter property to'latex'. Use dollar symbols around the labels, for example, use '$\int_1^{20} x^2 dx$' for inline mode or'$$\int_1^{20} x^2 dx$$' for display mode.
The displayed text uses the default LaTeX font style. TheFontName, FontWeight, andFontAngle properties do not have an effect. To change the font style, use LaTeX markup within the text. The maximum size of the text that you can use with the LaTeX interpreter is 1200 characters. For multiline text, the maximum size of the text reduces by about 10 characters per line.
For examples that use TeX and LaTeX, see Greek Letters and Special Characters in Chart Text. For more information about the LaTeX system, see The LaTeX Project website at https://www.latex-project.org/.
TickLabelFormat — Tick label format and decimal precision
character vector | string
Tick label format and decimal precision, specified as a character vector or string. For example, you can display the tick labels in a currency format, control the number of decimals that appear in each label, or add text after all the labels.
Example: ax.XAxis.TickLabelFormat = '%g%%'; displays a percent sign after all the tick labels.
This table lists some common formats.
| Common Format | Character Vector to Use | Examples of Resulting Format |
|---|---|---|
| Currency — Display dollar sign before values, use two decimal places, and use commas. | '$%,.2f' | 0.010.01 0.011.00 $1,000.00 |
| Temperatures — Display degree symbol after values. | '%g\\circ' | 0.01o 1o 1000o |
| Percentages — Display percent sign after values. | '%g%%' | 0.01% 1% 1000% |
| Commas — Display commas in the thousandth place. | '%,g' | 0.01 1 1,000 |
Alternatively, specify the tick label format using the xtickformat, ytickformat, and ztickformat functions.
Custom Format
If none of the formats mentioned in the table gives your desired format, then create a custom character vector or string with identifiers.
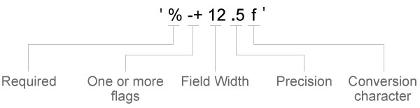
Identifiers are optional, except the percent sign and conversion character. Construct the format in this order:
- One or more flags — Options such as adding a plus sign before positive values. For a full list of options, see the table of Optional Flags.
- Field width — Minimum number of characters to print in the tick label. Specify the field width as an integer value. If the number of significant digits in the tick value is smaller than the field width, then the label is padded with spaces.
- Precision — Number of digits to the right of the decimal point or the number of significant digits, depending on the conversion character. Specify the precision as an integer value.
- Conversion character — Value type. For a full list of options, see the table of Conversion Characters. If you specify a conversion that does not fit the data, MATLAB overrides the specified conversion and uses
%e.
Also, you can specify literal text at the beginning or end of the format. To print a single quotation mark, use ''. To print a percent character, use %%.
'$%.2f'— Display a dollar sign before each value and use fixed-point notation with two decimal values.'%.3f Million'— DisplayMillionafter each value and use fixed-point notation with three decimal values.
Optional Flags
| Identifier | Description | Example of Numeric Format |
|---|---|---|
| , | Display commas every three digits, such as'1,000'. | '%,4.4g' |
| + | Print the sign character (+) for positive values, such as '+100'. | '%+4.4g' |
| 0 | Pad the field width with leading zeros instead of spaces, such as '0100'. | '%04.4g' |
| – | Left-justify, which pads the end of the value with spaces instead of the beginning. For example, if the field width is 4, then this flag formats the label as '100 ' instead of ' 100'. | '%-4.4g' |
| # | For the %f,%e, and %g conversion characters, print the decimal point even when the precision is 0, such as'100.'. For%g, do not remove trailing zeros. | '%#4.4g' |
Conversion Characters
| Identifier | Description | Example |
|---|---|---|
| d or i | Signed integer with base 10. The precision value indicates the number of significant digits. | '%.4d' displays π as0003. |
| f | Fixed-point notation. The precision value indicates the number of decimal places. | '%.4f' displays π as3.1416. |
| e | Exponential notation. The precision value indicates the number of decimal places. | '%.4e' displays π as3.1416x100. |
| g | The more compact version of e orf, with no trailing zeros. The precision value indicates the maximum number of decimal places. | '%.4g' displays π as3.1416. |
Rotation of tick labels, specified as a scalar value in degrees. Positive values give counterclockwise rotation. Negative values give clockwise rotation.
Alternatively, you can rotate the tick labels using the xtickangle, ytickangle, and ztickangle functions.
Note
The TickLabelRotation property for the ruler and the associated XTickLabelRotation, YTickLabelRotation, or ZTickLabelRotation property for the parent axes always have the same value. Setting one also sets the other.
Example: ax.XAxis.TickLabelRotation = 45;
Example: ax.YAxis.TickLabelRotation = -45;
Selection mode for the TickLabelRotation property, specified as one of these values:
'auto'— Automatically select the tick label rotation.'manual'— Use a tick label rotation that you specify. To specify the rotation, set theTickLabelRotationproperty.
Note
The TickLabelRotationMode property for the ruler and the corresponding mode property of the parent axes always have the same value. Setting one also sets the other.
Tick mark direction, specified as one of these values:
'in'— Direct the tick marks inward from the axis lines. This is the default for 2-D views.'out'— Direct the tick marks outward from the axis lines. This is the default for 3-D views.'both'— Center the tick marks over the axis lines.'none'— Do not display any tick marks.
If you assign a value to this property, then MATLAB sets the TickDirectionMode property to 'manual'.
Note
Setting the TickDir property for the parent axes sets the TickDirection property for the ruler to the same value. However, setting the ruler property does not set the axes property. To prevent the axes property value from overriding the ruler property value, set the axes value first, and then set the ruler value.
Selection mode for the TickDirection property, specified as one of these values:
'auto'— Automatically select the tick direction.'manual'— Use a tick direction that you specify. To specify the tick direction, set theTickDirectionproperty.
Tick mark length, specified as a two-element vector of the form [2Dlength 3Dlength]. The first element is the tick mark length in 2-D views. The second element is the tick mark length in 3-D views. Specify the values in units normalized relative to the longest axes dimension.
Note
Setting the TickLength property for the parent axes sets the TickLength property for the ruler to the same value. However, setting the ruler property does not set the axes property. To prevent the axes property value from overriding the ruler property value, set the axes value first, and then set the ruler value.
Example: ax.YAxis.TickLength = [0.02 0.035];
Minor tick mark display, specified as 'on' or 'off', or as numeric or logical 1 (true) or0 (false). A value of 'on' is equivalent to true, and 'off' is equivalent tofalse. Thus, you can use the value of this property as a logical value. The value is stored as an on/off logical value of type matlab.lang.OnOffSwitchState.
'on'— Display minor tick marks between the major tick marks on the axis. This is the default value for an axis with a log scale. The space between the major tick marks determines the number of minor tick marks. If theMinorTickValuesproperty is set to empty[], then no minor tick marks appear. Specify the tick mark locations by setting theMinorTickValuesproperty.'off'— Do not display minor tick marks. This is the default value for an axis with a linear scale.
Note
The MinorTick property for the ruler and the associated XMinorTick, YMinorTick, or ZMinorTick property for the parent axes always have the same value. Setting one also sets the other.
Example: ax.XAxis.MinorTick = 'on';
Minor tick mark locations, specified as a vector of increasing values.
Example: ax.XAxis.MinorTickValues = [0 0.5 1 1.5 2 2.5];
Example: ax.YAxis.MinorTickValues = 0:5:100;
If you assign values to this property, then MATLAB sets the MinorTickValuesMode property to 'manual'.
Selection mode for the MinorTickValues property, specified as one of these values:
'auto'— Use automatically calculated minor tick values.'manual'— Use minor tick values that you specify. To specify the values, set theMinorTickValuesproperty.
Font
Font name, specified as a system supported font name or 'FixedWidth'. The default font depends on the specific system and locale. To use a fixed-width font that renders well, specify 'FixedWidth'. The actual fixed-width font used depends on the FixedWidthFontName property of the root object.
Note
Setting the FontName property for the parent axes sets the FontName property for the ruler to the same value. However, setting the ruler property does not set the axes property. To prevent the axes property value from overriding the ruler property value, set the axes value first, and then set the ruler value.
Example: ax.XAxis.FontName = 'Cambria';
Font size, specified as a scalar numeric value. The default font size depends on the specific operating system and locale.
Note
- Setting the
FontSizeproperty for the parent axes sets theFontSizeproperty for the ruler to the same value. However, setting the ruler property does not set the axes property. To prevent the axes property value from overriding the ruler property value, set the axes value first, and then set the ruler value. - Setting the
FontSizeproperty on the ruler changes the size of the tick labels. MATLAB also updates the font size of the corresponding axes label using theLabelFontSizeMultiplierof the parent axes. For example, setting the font size of an _x_-axis ruler to12sets the font size for theXLabelproperty of the parent axes to12times the value of theLabelFontSizeMultiplierproperty.
Example: ax.XAxis.FontSize = 12;
Thickness of the text characters, specified as one of these values:
'normal'— Default weight as defined by the particular font.'bold'— Thicker character outlines than normal.
MATLAB uses the FontWeight property to select a font from those available on your system. Not all fonts have a bold font weight. Therefore, specifying a bold font weight still can result in the normal font weight.
Note
Setting the FontWeight property for the parent axes sets the FontWeight property for the ruler to the same value. However, setting the ruler property does not set the axes property. To prevent the axes property value from overriding the ruler property value, set the axes value first, and then set the ruler value.
Example: ax.XAxis.FontWeight = 'bold';
Character slant, specified as 'normal' or 'italic'. Not all fonts have both font styles. Therefore, the italic font can look the same as the normal font.
Note
Setting the FontAngle property for the parent axes sets the FontAngle property for the ruler to the same value. However, setting the ruler property does not set the axes property. To prevent the axes property value from overriding the ruler property value, set the axes value first, and then set the ruler value.
Example: ax.XAxis.FontAngle = 'italic';
Text smoothing, specified as 'on' or 'off', or as numeric or logical 1 (true) or0 (false). A value of 'on' is equivalent to true, and 'off' is equivalent tofalse. Thus, you can use the value of this property as a logical value. The value is stored as an on/off logical value of type matlab.lang.OnOffSwitchState.
'on'— Enable text antialiasing to reduce the jagged appearance of text characters and make the text easier to read. In certain cases, smoothed text blends against the background color and can make the text appear blurry.'off'— Disable text antialiasing. Use this setting if the text seems blurry.
Note
- Setting the
FontSmoothingproperty for the parent axes sets theFontSmoothingproperty for the ruler to the same value. However, setting the ruler property does not set the axes property. To prevent the axes property value from overriding the ruler property value, set the axes value first, and then set the ruler value. - The
FontSmoothingproperty will have no effect in a future release. Font smoothing will be enabled regardless of the value of the property.
Example: ax.XAxis.FontSmoothing = 'off';
Callbacks
LimitsChangedFcn — Axis limits changed callback
'' (default) | function handle | cell array | character vector
Axis limits changed callback, specified as one of these values:
- A function handle.
- A cell array in which the first element is a function handle. Subsequent elements in the cell array are the arguments to pass to the callback function.
- A character vector containing a valid MATLAB expression (not recommended). MATLAB evaluates this expression in the base workspace.
This callback executes after the axis limits have changed, either programmatically or using an interaction such as panning within the axes. It can also execute if MATLAB changes the axis limits to encompass the range of your data when you call a plotting function.
This callback function can access specific information about the axis limits. MATLAB passes this information in a LimitsChanged object as the second argument to your callback function. If you are developing an app in App Designer, the argument is calledevent. You can query the object properties using dot notation. For example, event.NewLimits returns the new axis limits. TheLimitsChanged object is not available to callback functions specified as character vectors.
The following table lists the properties of the LimitsChanged object.
| Property | Description |
|---|---|
| Source | Ruler object that executes the callback |
| EventName | 'LimitsChanged' |
| OldLimits | Two-element vector containing the previous axis limits |
| NewLimits | Two-element vector containing the new axis limits |
For more information about writing callbacks in apps, see Callbacks in App Designer.
Parent/Child
Ruler parent, specified as an Axes object.
Note
Ruler objects are not listed in the Children property of the parent Axes object.
Children — Ruler children
empty GraphicsPlaceholder array
The ruler has no children. You cannot set this property.
Version History
Introduced in R2015b
R2022a: The FontSmoothing property will have no effect in a future release
The FontSmoothing property will have no effect in a future release. Font smoothing will be enabled regardless of the value of the property.