zoom - Enable zoom mode - MATLAB (original) (raw)
Description
You can use zoom mode to explore data by interactively changing the limits of axes. Enable or disable zoom mode, and set other basic options, by using thezoom function. To further control zoom mode behavior, return and use azoom object.
Most charts support zoom mode, including line, bar, histogram, and surface charts. Charts that support zoom mode typically display the zoom in ![]() and zoom out
and zoom out ![]() icons in the axes toolbar.
icons in the axes toolbar.
You can also interactively explore data using built-in axes interactions that are enabled by default. For example, you can zoom in and out of the view of the axes by scrolling or pinching. Built-in interactions do not require you to enable an interaction mode and respond faster than interaction modes. However, you can enable zoom mode to customize the zooming behavior. For more information about built-in interactions, see Control Chart Interactivity.
Creation
Syntax
Description
zoom [option](#mw%5F93cea585-4eee-4991-b400-aa1250c170d1) sets the zoom mode for all axes in the current figure. For example, zoom on enables zoom mode,zoom xon enables zoom mode for the _x_-dimension only, and zoom off disables zoom mode.
When zoom mode is enabled, zoom the view of the axes using the cursor, the scroll wheel, or the keyboard.
- Cursor — To zoom in, position your cursor where you want the center of the axes to be and click. To zoom out, hold Shift and click. To zoom into a rectangular region, click and drag. To return an axes object to its baseline zoom level, double-click within the axes.
- Scroll wheel — To zoom in, scroll up. To zoom out, scroll down.
- Keyboard — To zoom in, press the up arrow (↑) key. To zoom out, press the down arrow (↓) key.
Some built-in interactions remain enabled by default, regardless of the current interaction mode. To disable built-in zoom interactions that are independent of the zoom mode, use the disableDefaultInteractivity function.
zoom toggles the zoom mode. If zoom mode is disabled, then calling zoom restores the most recently used zoom option ofon, xon, or yon.
zoom([factor](#mw%5F4ce92345-814d-4658-97f4-c4e749a861ef)) zooms the current axes by the specified zoom factor without affecting the zoom mode. Zoom in by specifyingfactor as a value greater than 1, for example,zoom(3). Zoom out by specifying factor as a value between 0 and 1, for example, zoom(0.5).
zoom([fig](#mw%5Fd1b2a085-f382-48aa-b6bc-8deefa7a4005),___) sets the zoom mode for all axes in the specified figure for any of the previous syntaxes. Specify the additional argument as a zoom mode option or a zoom factor. For example, to enable zoom mode for all axes in the figure fig, usezoom(fig,'on'). To zoom all of the axes by a factor of 2, usezoom(fig,2).
zoom([ax](#mw%5Fede9d832-aef0-4b54-a0ec-a2140e38eb11),___) sets the zoom mode for the specified axes. Specify the additional argument as a zoom mode option or a zoom factor. For example, to enable zoom mode for the axes ax, usezoom(ax,'on'). To zoom the axes ax by a factor of 2, use zoom(ax,2). Use this syntax with apps created in App Designer and using the uifigure function. (since R2023a)
z = zoom creates a zoom object for the current figure. This syntax is useful for customizing the zoom mode, motion, and direction.
z = zoom([fig](#mw%5Fd1b2a085-f382-48aa-b6bc-8deefa7a4005)) creates azoom object for the specified figure.
Input Arguments
option — Zoom mode option
'on' | 'off' | 'reset' | 'out' | 'xon' | 'yon' | 'toggle'
Zoom mode option, specified as one of these values:
'on'— Enable zoom mode.'off'— Disable zoom mode. Some built-in interactions remain enabled by default, regardless of the current interaction mode. To disable built-in zoom interactions that are independent of the zoom mode, use the disableDefaultInteractivity function.'reset'— Set the current zoom level as the baseline zoom level. Once you set the baseline zoom level, callingzoom out, double-clicking in the axes, or clicking the Restore View icon from the axes toolbar returns axes to this zoom level.
'out'— Return the current axes to its baseline zoom level.'xon'— Enable zoom mode for the_x_-dimension only.'yon'— Enable zoom mode for the_y_-dimension only.'toggle'— Toggle the zoom mode. If zoom mode is disabled, then'toggle'restores the most recently used zoom option of'on','xon', or'yon'. Using this option is the same as callingzoomwithout any arguments.
factor — Zoom factor
positive number
Zoom factor, specified as a positive number. Zoom in by specifyingfactor as a number greater than 1. Zoom out by specifyingfactor as a number between 0 and 1. In this case, the axes zoom out by 1/factor.
fig — Target figure
Figure object
Target figure, specified as a Figure object. Specifying a target figure sets the mode for all current or future Axes children.
ax — Target axes
Axes object
Target axes, specified as an Axes object.
Properties
Motion — Dimension
'both' (default) | 'horizontal' | 'vertical'
Dimension to allow zooming in and out, specified as one of these values:
'both'— Allow zooming in the_x_-dimension and the _y_-dimension.'horizontal'— Allow zooming in the_x_-dimension only.'vertical'— Allow zooming in the_y_-dimension only.
This property affects only axes in a 2-D view, such as when you callview([0 90]). To control the zoom dimension in 3-D views, use aZoomInteraction object.
Direction — Direction
'in' (default) | 'out'
Direction of zooming, specified as one of these values:
'in'— Click to zoom in.'out'— Click to zoom out.
When zoom mode is enabled, you can use the scroll wheel to zoom in or out, regardless of the value of Direction.
RightClickAction — Action to perform on right-click
'PostContextMenu' (default) | 'InverseZoom'
Action to perform on right-click, specified as one of these values:
'PostContextMenu'— Display a context menu.'InverseZoom'— Zoom out on right-click.
Setting the RightClickAction property sets the default for future zoom objects. The value ofRightClickAction persists between MATLAB® sessions.
— Context menu
empty GraphicsPlaceholder array (default) | ContextMenu object
Context menu, specified as a ContextMenu object. Use this property to display a context menu when you right-click in axes where zoom mode is enabled. Create the context menu using the uicontextmenu function.
This property has no effect if the RightClickAction property has a value of 'InverseZoom'.
ButtonDownFilter — Zoom suppression callback
[ ] (default) | function handle | cell array | character vector
Zoom suppression callback, specified as one of these values:
- Function handle
- Cell array containing a function handle and additional arguments
- Character vector containing a valid MATLAB command or function, which is evaluated in the base workspace (not recommended)
Use this property to suppress zooming under conditions that you define. A numeric or logical output of 1 (true) suppresses zooming, and a numeric or logical output of 0 (false) allows zooming. If you specify this property using a function handle, then MATLAB passes two arguments to the callback function:
axes— The axes object in which you are zooming.eventData— Empty argument. Replace it with the tilde character (~) in the function definition to indicate that this argument is not used.
If you specify this property using a function handle, then you must assign the function output to a variable.
For more information about callbacks, see Create Callbacks for Graphics Objects.
ActionPreCallback — Function to execute before zooming
[ ] (default) | function handle | cell array | character vector
Function to execute before zooming, specified as one of these values:
- Function handle
- Cell array containing a function handle and additional arguments
- Character vector containing a valid MATLAB command or function, which is evaluated in the base workspace (not recommended)
Use this property to execute code as you start zooming in or out. If you specify this property using a function handle, then MATLAB passes two arguments to the callback function:
figure—Figureobject in which you are zooming.axesStruct— Structure that contains one field,Axes, the axes object in which you are zooming. If you do not use this argument in your callback function, then replace it with the tilde character (~).
For more information about callbacks, see Create Callbacks for Graphics Objects.
ActionPostCallback — Function to execute after zooming
[ ] (default) | function handle | cell array | character vector
Function to execute after zooming, specified as one of these values:
- Function handle
- Cell array containing a function handle and additional arguments
- Character vector containing a valid MATLAB command or function, which is evaluated in the base workspace (not recommended)
Use this property to execute code after you finish zooming. If you specify this property using a function handle, then MATLAB passes two arguments to the callback function:
figure—Figureobject in which you are zooming.axesStruct— Structure that contains one field,Axes, the axes object in which you are zooming. If you do not use this argument in your callback function, then replace it with the tilde character (~).
For more information about callbacks, see Create Callbacks for Graphics Objects.
Enable — Zoom mode state
'off' (default) | 'on' | on/off logical value
Zoom mode state, specified as 'on' or 'off', or as numeric or logical 1 (true) or0 (false). A value of 'on' is equivalent to true, and 'off' is equivalent tofalse. Thus, you can use the value of this property as a logical value. The value is stored as an on/off logical value of type OnOffSwitchState.
FigureHandle — Figure object
Figure object
This property is read-only.
Figure object that you specified when creating thezoom object. If you did not specify a figure, thenFigureHandle is the figure that was current when you created thezoom object.
UseLegacyExplorationModes — Legacy mode
'off' (default) | 'on' | on/off logical value
Legacy mode, specified as 'on' or 'off', or as numeric or logical 1 (true) or0 (false). A value of 'on' is equivalent to true, and 'off' is equivalent tofalse. Thus, you can use the value of this property as a logical value. The value is stored as an on/off logical value of type OnOffSwitchState.
This property applies only to zoom objects for figures created using the uifigure function or in MATLAB Online™. Setting this property to 'on' changes the behavior of interaction modes in UI figures so they match the behavior of modes in traditional figures. For more information, see enableLegacyExplorationModes.
Once this property is set to 'on', it cannot be changed back to'off'.
Object Functions
Use zoom object functions to customize the zooming behavior of axes objects within a figure. For all of these functions, the axes and zoom objects must be associated with the same figure.
| setAllowAxesZoom | The setAllowAxesZoom function sets permission to zoom axes.Calling setAllowAxesZoom(z,axes,tf) on the zoom object z, with a vector of axes objects axes and a logical scalar tf as inputs, either allows or disallows a zoom operation on the axes objects.Enabling zoom mode for axes usingsetAllowAxesZoom does not enable zoom mode for the figure. To do this, set the Enable property of the zoom object. |
|---|---|
| isAllowAxesZoom | The isAllowAxesZoom function queries permission to zoom axes.Calling tf = isAllowAxesZoom(z,axes) on the zoom object z, with a vector of axes objectsaxes as an input, returns a logical array tf of the same size as axes. tf indicates whether a zoom operation is permitted on the axes objects.Returning the zoom mode of axes using isAllowAxesZoom does not return the zoom mode for the figure. To do this, access the Enable property of the zoom object. |
| setAxesZoomConstraint | The setAxesZoomConstraint function sets the zoom dimension of axes.CallingsetAxesZoomConstraint(z,axes,d) on the zoom objectz, with a vector of axes objects axes and a dimension value scalar d as inputs, sets the zoom dimension of the axes objects as one of these dimension values: 'x','y', 'z', 'xy','xz', 'yz', or'unconstrained'.Setting the zoom dimension for axes using setAxesZoomConstraint does not set the zoom dimension for the figure. To do this, set the Motion property of the zoom object. |
| getAxesZoomConstraint | The getAxesZoomConstraint function returns the zoom dimension of axes.Calling d = getAxesZoomConstraint(z,axes) on the zoom object z, with a vector of axes objects axes as an input, returns a cell array d indicating the zoom dimension of each axes object.Returning the zoom dimension of axes usinggetAxesZoomConstraint does not return the zoom dimension for the figure. To do this, access the Motion property of the zoom object. |
| setAxes3DPanAndZoomStyle | The setAxes3DPanAndZoomStyle function sets the zoom style.Calling setAxes3DPanAndZoomStyle(z,axes,s) on the zoom object z, with a vector of axes objectsaxes and a zoom style character array s as inputs, sets the zoom style of the axes objects. By default, the zoom style is'limits', which zooms by modifying the axes limits. Specify the zoom style as 'camera' to zoom by modifying the camera view angle.For more information about the camera view angle, see Camera Graphics Terminology. |
| getAxes3DPanAndZoomStyle | The getAxes3DPanAndZoomStyle function returns the zoom style.Calling s = getAxes3DPanAndZoomStyle(z,axes) on the zoom object z, with a vector of axes objectsaxes as an input, returns a cell array s indicating the zoom style of each axes object. |
| setAxesZoomMotion (not recommended) | This function is not recommended. UsesetAxesZoomConstraint instead.CallingsetAxesZoomMotion(z,axes,d) on the zoom objectz, with a vector of axes objects axes and a zoom dimension d as inputs, sets the zoom dimension of the axes objects as one of these dimension values: 'horizontal','vertical', or 'both'.The axes zoom dimension that is set by setAxesZoomMotion is not the same as the figure zoom dimension that is set using the Motion property. |
| getAxesZoomMotion (not recommended) | This function is not recommended. UsegetAxesZoomConstraint instead.Calling d = getAxesZoomMotion(z,axes) on the zoom object z, with a vector of axes objects axes as an input, returns a cell arrayd indicating the zoom dimension of each axes object.The axes zoom dimension that is returned usinggetAxesZoomMotion is not the same as the figure zoom dimension that is returned using the Motion property. |
Examples
Set Baseline Zoom Level
Plot a surface and enable zoom mode.
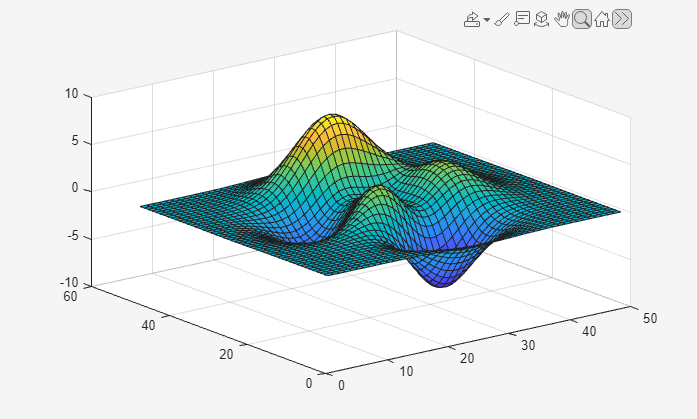
Zoom into the tallest peak by clicking on it. Then, set the baseline zoom level. Future calls to zoom out, double-clicking in the axes, or clicking the Restore View ![]() icon from the axes toolbar return axes to this baseline zoom level.
icon from the axes toolbar return axes to this baseline zoom level.
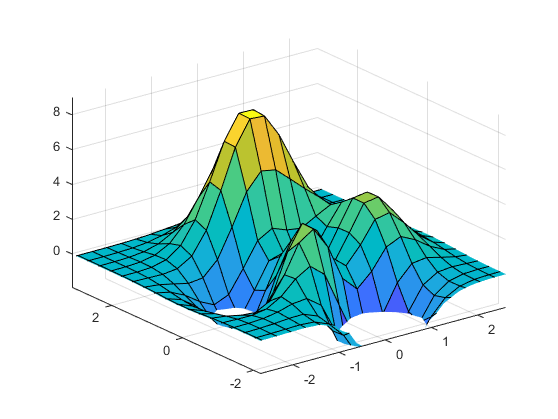
Zoom into the highest peak a second time by clicking on it. Then, return to the baseline zoom level you set by zooming out.
Constrain Zoom in Tiled Chart Layout
Create four axes in a tiled chart layout, and assign each a different zoom behavior. Then, interactively zoom the axes.
tiledlayout(2,2) ax1 = nexttile; plot(1:10); z = zoom;
ax2 = nexttile; plot(rand(3)); setAllowAxesZoom(z,ax2,false);
ax3 = nexttile; surf(peaks); setAxesZoomConstraint(z,ax3,'xy');
ax4 = nexttile; contour(peaks); setAxesZoomMotion(z,ax4,'horizontal');
Create Mode Context Menu
Plot a surface and create a context menu using the uicontextmenu function.
surf(peaks) cm = uicontextmenu;
Then, add an item to the menu. Specify a label and a callback that closes the figure.
m = uimenu(cm); m.Label = 'Close figure'; f = gcf; m.Callback = @(src,event)close(f);
Create a zoom object. Add the context menu to the zoom object by setting itsContextMenu property. Then, enable zoom mode.
z = zoom(f); z.ContextMenu = cm; z.Enable = 'on';
Close the figure by right-clicking and selecting .
More About
Changing Callback Functions
You can create a zoom object and use it to customize the behavior of different axes. You can also change its callback functions on the fly.
Note
Do not change figure callbacks within an interactive mode. While a mode is active (such as when zoom mode is enabled), you will receive a warning if you attempt to change any of the figure's keyboard callbacks or window callbacks, and the operation will not succeed. The one exception to this rule is the figure WindowButtonMotionFcn callback, which can be changed from within a mode. Therefore, if you are creating a UI that updates a figure's callbacks, the UI should keep track of and check which interactive mode is active, if any, before attempting to change a callback.
When you assign different zoom behaviors to different axes in a figure by using mode objects and then link them using the linkaxes function, the behavior of the axes you manipulate with the mouse carries over to the linked axes, regardless of the behavior you previously set for the other axes.
Alternative Functionality
Axes Toolbar
For some charts, enable zoom mode by clicking the zoom in ![]() or zoom out
or zoom out ![]() icons in the axes toolbar.
icons in the axes toolbar.
Version History
Introduced before R2006a
R2023a: Set zoom mode for specified axes in apps
For apps created in App Designer and using the uifigure function, set the zoom mode for axes by specifying the axes as the first input ofzoom. When setting the zoom mode for axes, the function does not return a zoom object.
R2020a: UIContextMenu property is not recommended
Starting in R2020a, using the UIContextMenu property to assign a context menu to a graphics object or UI component is not recommended. Use theContextMenu property instead. The property values are the same.
There are no plans to remove support for the UIContextMenu property at this time. However, the UIContextMenu property no longer appears in the list returned by calling the get function on a graphics object or UI component.
R2018b: Explore data with zooming enabled by default
Interactively explore your data using built-in axes interactions that are enabled by default. For example, you can use the scroll wheel to zoom into your data without enabling zoom mode. For more information, see Control Chart Interactivity.
Previously, no axes interactions were enabled by default.