Text - Tiled chart layout text appearance and behavior - MATLAB (original) (raw)
Text Properties
Tiled chart layout text appearance and behavior
Text properties control the appearance and behavior of the Text objects used for shared titles and axis labels in tiled chart layouts. By changing property values, you can modify certain aspects of the text.
t = tiledlayout(2,2); txt = title(t,'My Title'); txt.FontSize = 16;
Text to display, specified as a character vector, cell array of character vectors, string array, categorical array, or numeric value. Specify a value according to how you want the text to appear. This table lists the most common situations.
| Appearance of Text | Description of Value | Example |
|---|---|---|
| One line of text | Character vector or 1-by-1 string array. | str = 'My Text'orstr = "My Text" |
| Multiple lines of text | Cell array of character vectors or a string array. | str = {'First line','Second line'};orstr = ["First line", "Second line"]; |
| Text that includes a numeric variable | Array that includes the number converted to achar array. Use num2str to convert the value. | x = 42; str = ['The value is ',num2str(x)]; |
| Text that includes special characters such as Greek letters or mathematical symbols | Array that includes TeX markup. For a list of supported markup, see the Interpreter property. | str = 'x ranges from 0 to 2\pi' |
Note
- The words
default,factory, andremoveare reserved words that do not appear in text when quoted as normal characters. To display any of these words individually, precede them with a backslash, such as'\default'or'\remove'. - If you specify this property as a categorical array, MATLAB® uses the values in the array, not the categories.
- If you specify text that contains only a numeric value, the value is converted using
sprintf('%g',value). For example,12345678displays as1.23457e+07.
Text color, specified as an RGB triplet, a hexadecimal color code, a color name, or a short name. The default value of [0 0 0] corresponds to black.
For a custom color, specify an RGB triplet or a hexadecimal color code.
- An RGB triplet is a three-element row vector whose elements specify the intensities of the red, green, and blue components of the color. The intensities must be in the range
[0,1], for example,[0.4 0.6 0.7]. - A hexadecimal color code is a string scalar or character vector that starts with a hash symbol (
#) followed by three or six hexadecimal digits, which can range from0toF. The values are not case sensitive. Therefore, the color codes"#FF8800","#ff8800","#F80", and"#f80"are equivalent.
Alternatively, you can specify some common colors by name. This table lists the named color options, the equivalent RGB triplets, and hexadecimal color codes.
| Color Name | Short Name | RGB Triplet | Hexadecimal Color Code | Appearance |
|---|---|---|---|---|
| "red" | "r" | [1 0 0] | "#FF0000" |  |
| "green" | "g" | [0 1 0] | "#00FF00" |  |
| "blue" | "b" | [0 0 1] | "#0000FF" |  |
| "cyan" | "c" | [0 1 1] | "#00FFFF" |  |
| "magenta" | "m" | [1 0 1] | "#FF00FF" |  |
| "yellow" | "y" | [1 1 0] | "#FFFF00" |  |
| "black" | "k" | [0 0 0] | "#000000" |  |
| "white" | "w" | [1 1 1] | "#FFFFFF" |  |
| "none" | Not applicable | Not applicable | Not applicable | No color |
Here are the RGB triplets and hexadecimal color codes for the default colors MATLAB uses in many types of plots.
| RGB Triplet | Hexadecimal Color Code | Appearance |
|---|---|---|
| [0 0.4470 0.7410] | "#0072BD" | ![Sample of RGB triplet [0 0.4470 0.7410], which appears as dark blue](https://www.mathworks.com/help/matlab/ref/colororder1.png) |
| [0.8500 0.3250 0.0980] | "#D95319" | ![Sample of RGB triplet [0.8500 0.3250 0.0980], which appears as dark orange](https://www.mathworks.com/help/matlab/ref/colororder2.png) |
| [0.9290 0.6940 0.1250] | "#EDB120" | ![Sample of RGB triplet [0.9290 0.6940 0.1250], which appears as dark yellow](https://www.mathworks.com/help/matlab/ref/colororder3.png) |
| [0.4940 0.1840 0.5560] | "#7E2F8E" | ![Sample of RGB triplet [0.4940 0.1840 0.5560], which appears as dark purple](https://www.mathworks.com/help/matlab/ref/colororder4.png) |
| [0.4660 0.6740 0.1880] | "#77AC30" | ![Sample of RGB triplet [0.4660 0.6740 0.1880], which appears as medium green](https://www.mathworks.com/help/matlab/ref/colororder5.png) |
| [0.3010 0.7450 0.9330] | "#4DBEEE" | ![Sample of RGB triplet [0.3010 0.7450 0.9330], which appears as light blue](https://www.mathworks.com/help/matlab/ref/colororder6.png) |
| [0.6350 0.0780 0.1840] | "#A2142F" | ![Sample of RGB triplet [0.6350 0.0780 0.1840], which appears as dark red](https://www.mathworks.com/help/matlab/ref/colororder7.png) |
Example: 'blue'
Example: [0 0 1]
Example: '#0000FF'
Text interpreter, specified as one of these values:
'tex'— Interpret characters using a subset of TeX markup.'latex'— Interpret characters using LaTeX markup.'none'— Display literal characters.
TeX Markup
By default, MATLAB supports a subset of TeX markup. Use TeX markup to add superscripts and subscripts, modify the font type and color, and include special characters in the text.
Modifiers remain in effect until the end of the text. Superscripts and subscripts are an exception because they modify only the next character or the characters within the curly braces. When you set the interpreter to 'tex', the supported modifiers are as follows.
| Modifier | Description | Example |
|---|---|---|
| ^{ } | Superscript | 'text^{superscript}' |
| _{ } | Subscript | 'text_{subscript}' |
| \bf | Bold font | '\bf text' |
| \it | Italic font | '\it text' |
| \sl | Oblique font (usually the same as italic font) | '\sl text' |
| \rm | Normal font | '\rm text' |
| \fontname{specifier} | Font name — Replace_specifier_ with the name of a font family. You can use this in combination with other modifiers. | '\fontname{Courier} text' |
| \fontsize{specifier} | Font size —Replace_specifier_ with a numeric scalar value in point units. | '\fontsize{15} text' |
| \color{specifier} | Font color — Replace_specifier_ with one of these colors: red, green,yellow, magenta,blue, black,white, gray,darkGreen, orange, orlightBlue. | '\color{magenta} text' |
| \color[rgb]{specifier} | Custom font color — Replace_specifier_ with a three-element RGB triplet. | '\color[rgb]{0,0.5,0.5} text' |
This table lists the supported special characters for the'tex' interpreter.
| Character Sequence | Symbol | Character Sequence | Symbol | Character Sequence | Symbol |
|---|---|---|---|---|---|
| \alpha | α | \upsilon | υ | \sim | ~ |
| \angle | ∠ | \phi | ϕ | \leq | ≤ |
| \ast | * | \chi | χ | \infty | ∞ |
| \beta | β | \psi | ψ | \clubsuit | ♣ |
| \gamma | γ | \omega | ω | \diamondsuit | ♦ |
| \delta | δ | \Gamma | Γ | \heartsuit | ♥ |
| \epsilon | ϵ | \Delta | Δ | \spadesuit | ♠ |
| \zeta | ζ | \Theta | Θ | \leftrightarrow | ↔ |
| \eta | η | \Lambda | Λ | \leftarrow | ← |
| \theta | θ | \Xi | Ξ | \Leftarrow | ⇐ |
| \vartheta | ϑ | \Pi | Π | \uparrow | ↑ |
| \iota | ι | \Sigma | Σ | \rightarrow | → |
| \kappa | κ | \Upsilon | ϒ | \Rightarrow | ⇒ |
| \lambda | λ | \Phi | Φ | \downarrow | ↓ |
| \mu | µ | \Psi | Ψ | \circ | º |
| \nu | ν | \Omega | Ω | \pm | ± |
| \xi | ξ | \forall | ∀ | \geq | ≥ |
| \pi | π | \exists | ∃ | \propto | ∝ |
| \rho | ρ | \ni | ∍ | \partial | ∂ |
| \sigma | σ | \cong | ≅ | \bullet | • |
| \varsigma | ς | \approx | ≈ | \div | ÷ |
| \tau | τ | \Re | ℜ | \neq | ≠ |
| \equiv | ≡ | \oplus | ⊕ | \aleph | ℵ |
| \Im | ℑ | \cup | ∪ | \wp | ℘ |
| \otimes | ⊗ | \subseteq | ⊆ | \oslash | ∅ |
| \cap | ∩ | \in | ∈ | \supseteq | ⊇ |
| \supset | ⊃ | \lceil | ⌈ | \subset | ⊂ |
| \int | ∫ | \cdot | · | \o | ο |
| \rfloor | ⌋ | \neg | ¬ | \nabla | ∇ |
| \lfloor | ⌊ | \times | x | \ldots | ... |
| \perp | ⊥ | \surd | √ | \prime | ´ |
| \wedge | ∧ | \varpi | ϖ | \0 | ∅ |
| \rceil | ⌉ | \rangle | 〉 | \mid | | |
| \vee | ∨ | \langle | 〈 | \copyright | © |
LaTeX Markup
To use LaTeX markup, set the interpreter to 'latex'. For inline mode, surround the markup with single dollar signs ($). For display mode, surround the markup with double dollar signs ($$).
| LaTeX Mode | Example | Result |
|---|---|---|
| Inline | '$\int_1^{20} x^2 dx$' | 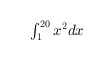 |
| Display | '$$\int_1^{20} x^2 dx$$' | 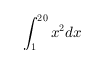 |
The displayed text uses the default LaTeX font style. TheFontName, FontWeight, andFontAngle properties do not have an effect. To change the font style, use LaTeX markup.
The maximum size of the text that you can use with the LaTeX interpreter is 1200 characters. For multiline text, this reduces by about 10 characters per line.
For examples that use TeX and LaTeX, see Greek Letters and Special Characters in Chart Text. For more information about the LaTeX system, see The LaTeX Project website at https://www.latex-project.org/.
HorizontalAlignment — Horizontal alignment
'center' (default) | 'left' | 'right'
Horizontal alignment of the text, specified as 'center','left', or 'right'.
VerticalAlignment — Vertical alignment
'middle' | 'top' | 'bottom' | 'baseline' | 'cap'
Vertical alignment of the text, specified as 'middle','top', 'bottom', 'baseline', or 'cap'. The default value is 'bottom' for shared titles and _y_-axis labels. For shared _x_-axis labels, the default value is 'top'.
Rotation — Text orientation
0 (default) | scalar value in degrees
Text orientation, specified as a scalar value in degrees. The default rotation of0 degrees makes the text horizontal. For vertical text, set this property to 90 or -90. Positive values rotate the text counterclockwise. Negative values rotate the text clockwise.
Font
Font name, specified as a supported font name or "FixedWidth". To display and print text properly, you must choose a font that your system supports. The default font depends on your operating system and locale.
To use a fixed-width font that looks good in any locale, use "FixedWidth". The fixed-width font relies on the root FixedWidthFontName property. Setting the root FixedWidthFontName property causes an immediate update of the display to use the new font.
FontSize — Font size
scalar value greater than zero
Font size, specified as a scalar value greater than zero in point units. One point equals 1/72 inch. The default font size for a shared title is13. For a shared x-axis or y-axis label, the default font size is12.
Character thickness, specified as 'normal' or'bold'.
MATLAB uses the FontWeight property to select a font from those available on your system. Not all fonts have a bold weight. Therefore, specifying a bold font weight can still result in the normal font weight.
Character slant, specified as 'normal' or'italic'.
Not all fonts have both font styles. Therefore, the italic font might look the same as the normal font.
Interactivity
State of visibility, specified as "on" or "off", or as numeric or logical 1 (true) or0 (false). A value of "on" is equivalent to true, and "off" is equivalent tofalse. Thus, you can use the value of this property as a logical value. The value is stored as an on/off logical value of type matlab.lang.OnOffSwitchState.
"on"— Display the object."off"— Hide the object without deleting it. You still can access the properties of an invisible object.
Parent/Child
Parent — Parent
TiledChartLayout object
Parent, specified as a TiledChartLayout object.
The object has no children. You cannot set this property.
Visibility of the object handle in the Children property of the parent, specified as one of these values:
"on"— Object handle is always visible."off"— Object handle is invisible at all times. This option is useful for preventing unintended changes by another function. SetHandleVisibilityto"off"to temporarily hide the handle during the execution of that function."callback"— Object handle is visible from within callbacks or functions invoked by callbacks, but not from within functions invoked from the command line. This option blocks access to the object at the command line, but permits callback functions to access it.
If the object is not listed in the Children property of the parent, then functions that obtain object handles by searching the object hierarchy or querying handle properties cannot return it. Examples of such functions include theget, findobj, gca, gcf, gco, newplot, cla, clf, and close functions.
Hidden object handles are still valid. Set the root ShowHiddenHandles property to "on" to list all object handles regardless of theirHandleVisibility property setting.
Version History
Introduced in R2019b