TreeNode - Tree node UI component - MATLAB (original) (raw)
Description
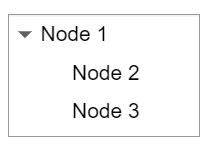
A tree node UI component displays an item in a tree hierarchy within an app. Use the TreeNode object to modify the appearance and behavior of a tree node after you create it.
Creation
Create a tree node in an app using the uitreenode function.
Properties
Node
Node text, specified as a character vector or string scalar.
Node data, specified as an array of any type. Specify NodeData to share node-relevant data within your app code.
Icon source or file, specified as a character vector, a string scalar, or anm-by-n-by-3 truecolor image array. If you specify a file name, it can be an image file name on the MATLAB® path or a full path to an image file. If you plan to share an app with others, put the image file on the MATLAB path to facilitate app packaging.
Supported image formats include JPEG, PNG, GIF, SVG, or m-by-n-by-3 truecolor image array. For more information about truecolor image arrays, see Working with Image Types in MATLAB.
Example: 'icon.png' specifies an icon file on the MATLAB path.
Example: 'C:\Documents\icon.png' specifies a full path to an image file.
Interactivity
Context menu, specified as a ContextMenu object created using the uicontextmenu function. Use this property to display a context menu when you right-click on a component.
Callbacks
Callback Execution Control
This property is read-only.
Parent/Child
Parent object, specified as a Tree orTreeNode object.
Children, returned as an array of TreeNode objects.
You cannot add or remove children using the Children property, but you can use the property to view the list of children. The order of the children reflects the order of the child nodes displayed on the screen. To add a child to this list, set the Parent property of the child component to be the TreeNode object.
To reorder the children, use the move function.
Objects with the HandleVisibility property set to 'off' are not listed in the Children property.
Identifiers
This property is read-only.
Type of graphics object, returned as 'uitreenode'.
Object identifier, specified as a character vector or string scalar. You can specify a unique Tag value to serve as an identifier for an object. When you need access to the object elsewhere in your code, you can use the findobj function to search for the object based on the Tag value.
Object Functions
Examples
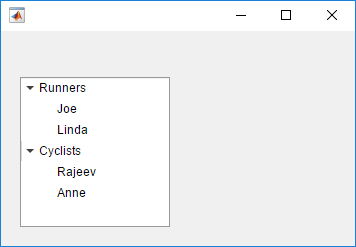
Create an app that displays athlete names grouped by sport. When the app user clicks on a name, MATLAB displays data about the athlete.
Create a program file called mytreeapp.m that contains the following commands to create a tree, a set of nested tree nodes, and a callback function for the tree. The SelectionChangedFcn property specifies the function to execute when the user clicks a node in the tree.
function mytreeapp fig = uifigure; t = uitree(fig,"Position",[20 20 150 150]);
% Assign callback in response to node selection
t.SelectionChangedFcn = @nodechange;

% First level nodes
category1 = uitreenode(t,"Text","Runners","NodeData",[]);
category2 = uitreenode(t,"Text","Cyclists","NodeData",[]);

% Second level nodes.
% Node data is age (y), height (m), weight (kg)
p1 = uitreenode(category1,"Text","Joe","NodeData",[40 1.67 58] );
p2 = uitreenode(category1,"Text","Linda","NodeData",[49 1.83 90]);
p3 = uitreenode(category2,"Text","Rajeev","NodeData",[25 1.47 53]);
p4 = uitreenode(category2,"Text","Anne","NodeData",[88 1.92 100]);

% Expand the tree
expand(t);

% Create the function for the SelectionChangedFcn callback
% When the function is executed, it displays the data of the selected item
function nodechange(src,event)
    node = event.SelectedNodes;
    display(node.NodeData);
end
end
When the user runs mytreeapp and clicks a node in the tree, MATLAB displays the NodeData for that node.
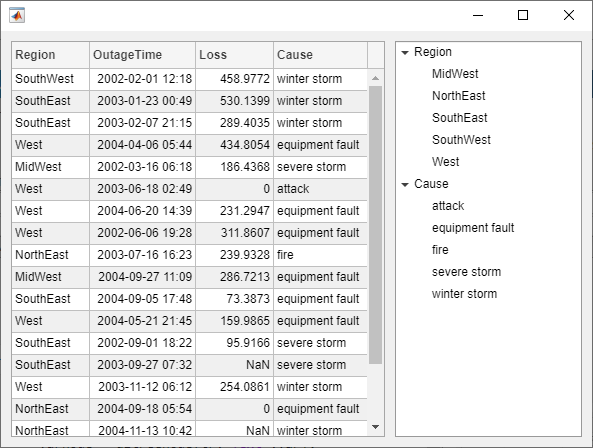
Create a tree that populates nodes based on the data in a table.
Create a figure with a grid layout manager to hold the UI components. Load sample data on electric utility outages and create a table UI component to display the data. Then, create a tree to hold nodes listing the regions and causes of the outages.
fig = uifigure; gl = uigridlayout(fig,[1 2]); gl.ColumnWidth = {'2x','1x'};
T = readtable("outages.csv"); T = T(1:20,["Region","OutageTime","Loss","Cause"]); tbl = uitable(gl,"Data",T);
tr = uitree(gl);
Specify the table variables to display in the tree. For each of those variables, create a top-level node whose text is the variable name. Extract the relevant data by converting the table entries for the variable to a categorical array and returning the list of categories as names. Then, loop through the categories. For each element, add a node to the tree under the appropriate parent node.
vars = ["Region","Cause"];
for k1 = 1:length(vars) var = vars{k1}; varnode = uitreenode(tr,"Text",var); rows = T{:,var}; names = categories(categorical(rows));
for k2 = 1:length(names)
    text = names{k2};
    uitreenode(varnode,"Text",text);
end
end
Expand the tree to see all the nodes.
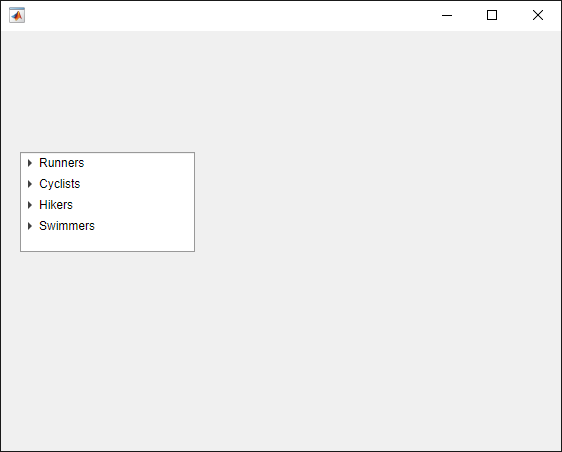
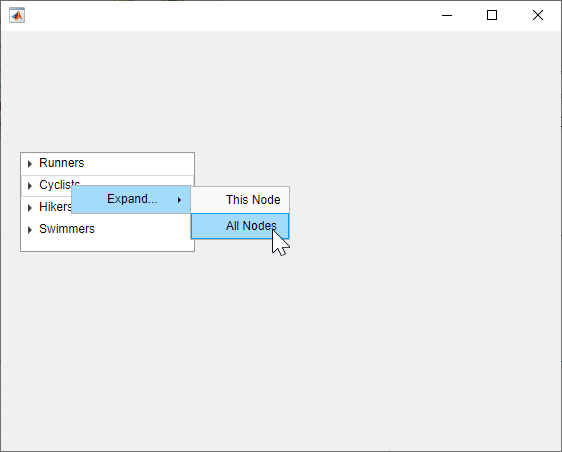
Create a context menu for a tree component. Assign the context menu to all of the top-level nodes in the tree.
In a new script in your current folder, create a UI figure. Then, create a tree with four top-level nodes and a set of nested nodes.
fig = uifigure;
t = uitree(fig,"Position",[20 200 175 100]);
category1 = uitreenode(t,"Text","Runners"); r1 = uitreenode(category1,"Text","Joe"); r2 = uitreenode(category1,"Text","Linda");
category2 = uitreenode(t,"Text","Cyclists"); c1 = uitreenode(category2,"Text","Rajeev");
category3 = uitreenode(t,"Text","Hikers"); h1 = uitreenode(category3,"Text","Jack");
category4 = uitreenode(t,"Text","Swimmers"); s1 = uitreenode(category4,"Text","Logan");
Create a context menu with one menu item and two submenus that users can click to expand a single tree node or all of the tree nodes. For each submenu, specify aMenuSelectedFcn callback function to execute when a user selects the menu option. Pass the relevant app object as input to each function to access app data from within the callback function.
cm = uicontextmenu(fig); m1 = uimenu(cm,"Text","Expand...");
sbm1 = uimenu(m1,"Text","This Node", ... "MenuSelectedFcn",{@expandSingle,fig}); sbm2 = uimenu(m1,"Text","All Nodes", ... "MenuSelectedFcn",{@expandAll,t});
Assign the context menu to the top-level tree nodes by setting theContextMenu property of each node to theContextMenu object.
category1.ContextMenu = cm; category2.ContextMenu = cm; category3.ContextMenu = cm; category4.ContextMenu = cm;
At the bottom of the file, define the expandSingle andexpandAll callback functions. Define the functions to accept the source and event data that MATLAB passes to all callback functions.
Define the expandSingle function to also accept the UI figure object containing the tree, and use the CurrentObject property of the figure to determine which tree node was clicked to bring up the context menu. Then, expand that node.
Define the expandAll function to also accept the tree object, and expand all of the nodes in the tree.
function expandSingle(src,event,f) node = f.CurrentObject; expand(node) end
function expandAll(src,event,t) expand(t) end
Save and run the script. Right-click any of the top-level tree nodes to view the context menu.
Version History
Introduced in R2017b