uitreenode - Create tree node component - MATLAB (original) (raw)
Create tree node component
Syntax
Description
`node` = uitreenode creates a tree node UI component inside a tree within a new figure window and returns theTreeNode object. MATLAB® calls the uifigure function to create the figure.
`node` = uitreenode([parent](#d126e1508291)) creates a tree node in the specified parent container. The parent container can be aTree or TreeNode object.
`node` = uitreenode([parent](#d126e1508291),[sibling](#d126e1508319)) creates a tree node in the specified parent container, after the specified sibling node.
`node` = uitreenode([parent](#d126e1508291),[sibling](#d126e1508319),[location](#d126e1508340)) creates a tree node, and places it after or before the sibling node. Specifylocation as "after" or"before".
`node` = uitreenode(___,[Name,Value](#namevaluepairarguments)) specifies TreeNode property values using one or moreName,Value pair arguments. SpecifyName,Value as the last set of arguments when you use any of the previous syntaxes.
Examples
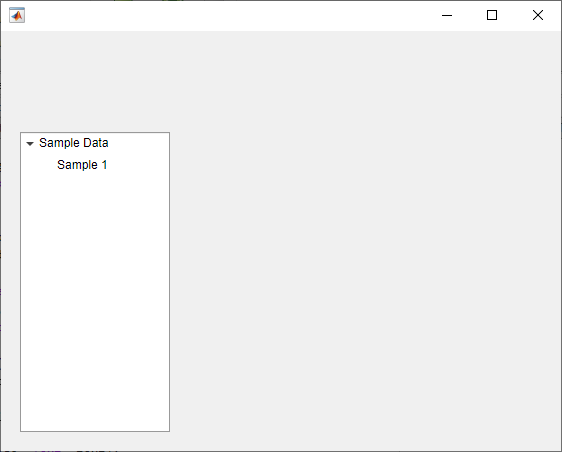
Create a tree that contains a parent node called Sample Data with a child node called Sample 1. Expand the tree to see both nodes.
fig = uifigure; t = uitree(fig); parent = uitreenode(t,"Text","Sample Data"); child = uitreenode(parent,"Text","Sample 1"); expand(t)
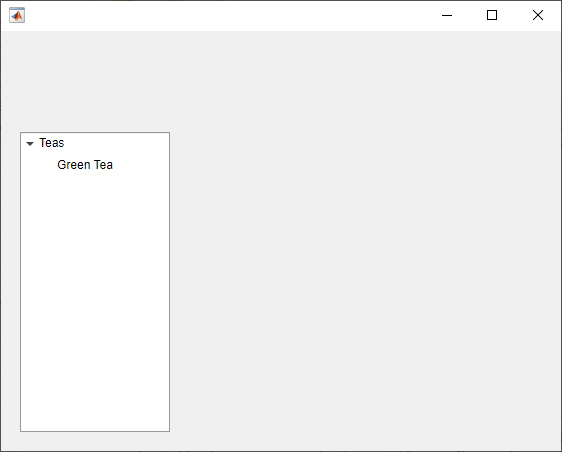
Create a tree with a parent and child node. Expand the tree to see both nodes.
fig = uifigure; t = uitree; p = uitreenode(t,"Text","Teas"); c1 = uitreenode(p,"Text","Green Tea"); expand(t);
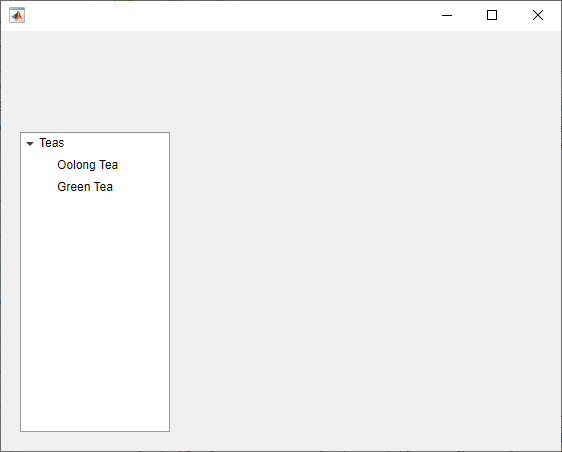
Add a new child node to the tree above the c1 node.
c2 = uitreenode(p,c1,"before","Text","Oolong Tea");
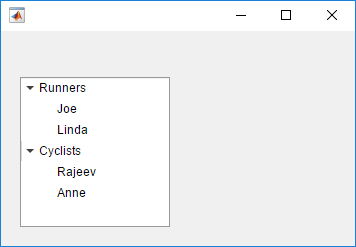
Create an app that displays athlete names grouped by sport. When the app user clicks on a name, MATLAB displays data about the athlete.
Create a program file called mytreeapp.m that contains the following commands to create a tree, a set of nested tree nodes, and a callback function for the tree. The SelectionChangedFcn property specifies the function to execute when the user clicks a node in the tree.
function mytreeapp fig = uifigure; t = uitree(fig,"Position",[20 20 150 150]);
% Assign callback in response to node selection
t.SelectionChangedFcn = @nodechange;

% First level nodes
category1 = uitreenode(t,"Text","Runners","NodeData",[]);
category2 = uitreenode(t,"Text","Cyclists","NodeData",[]);

% Second level nodes.
% Node data is age (y), height (m), weight (kg)
p1 = uitreenode(category1,"Text","Joe","NodeData",[40 1.67 58] );
p2 = uitreenode(category1,"Text","Linda","NodeData",[49 1.83 90]);
p3 = uitreenode(category2,"Text","Rajeev","NodeData",[25 1.47 53]);
p4 = uitreenode(category2,"Text","Anne","NodeData",[88 1.92 100]);

% Expand the tree
expand(t);

% Create the function for the SelectionChangedFcn callback
% When the function is executed, it displays the data of the selected item
function nodechange(src,event)
    node = event.SelectedNodes;
    display(node.NodeData);
end
end
When the user runs mytreeapp and clicks a node in the tree, MATLAB displays the NodeData for that node.
Style nodes in a tree that showcases a file structure to visually distinguish different file types.
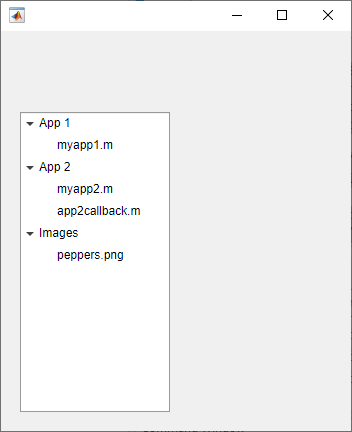
Create a tree UI component. Each top-level node represents a folder. Each child node represents a file in that folder. Expand the tree to see all the nodes.
fig = uifigure("Position",[300 300 350 400]); t = uitree(fig);
% Parent nodes n1 = uitreenode(t,"Text","App 1"); n2 = uitreenode(t,"Text","App 2"); n3 = uitreenode(t,"Text","Images");
% Child nodes n11 = uitreenode(n1,"Text","myapp1.m"); n21 = uitreenode(n2,"Text","myapp2.m"); n22 = uitreenode(n2,"Text","app2callback.m"); n31 = uitreenode(n3,"Text","peppers.png");
expand(t)
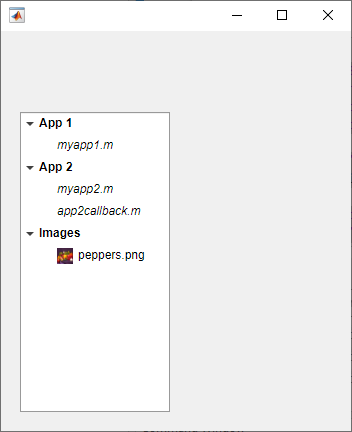
Create three styles: one with a bold font weight, one with an italic font angle, and one with an icon.
dirStyle = uistyle("FontWeight","bold"); mStyle = uistyle("FontAngle","italic"); imgStyle = uistyle("Icon","peppers.png");
Apply the bold style to the top-level nodes to distinguish the nodes that represent folders. Apply the italic style to the children of the App 1 and App 2 nodes to distinguish the nodes that represent MATLAB program files. Finally, apply the icon style to the node that represents an image file to show a preview of the image.
addStyle(t,dirStyle,"level",1) addStyle(t,mStyle,"node",[n1.Children;n2.Children]) addStyle(t,imgStyle,"node",n31)
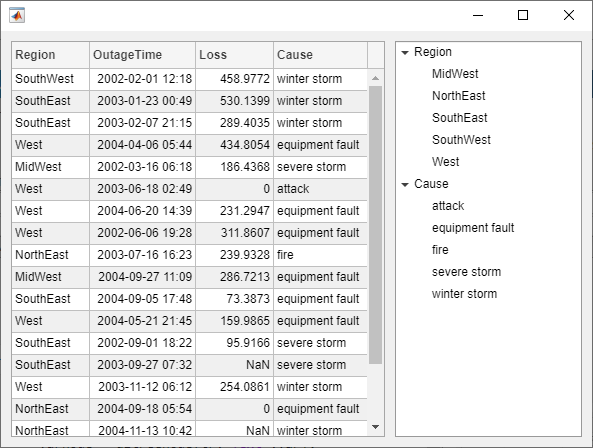
Create a tree that populates nodes based on the data in a table.
Create a figure with a grid layout manager to hold the UI components. Load sample data on electric utility outages and create a table UI component to display the data. Then, create a tree to hold nodes listing the regions and causes of the outages.
fig = uifigure; gl = uigridlayout(fig,[1 2]); gl.ColumnWidth = {'2x','1x'};
T = readtable("outages.csv"); T = T(1:20,["Region","OutageTime","Loss","Cause"]); tbl = uitable(gl,"Data",T);
tr = uitree(gl);
Specify the table variables to display in the tree. For each of those variables, create a top-level node whose text is the variable name. Extract the relevant data by converting the table entries for the variable to a categorical array and returning the list of categories as names. Then, loop through the categories. For each element, add a node to the tree under the appropriate parent node.
vars = ["Region","Cause"];
for k1 = 1:length(vars) var = vars{k1}; varnode = uitreenode(tr,"Text",var); rows = T{:,var}; names = categories(categorical(rows));
for k2 = 1:length(names)
    text = names{k2};
    uitreenode(varnode,"Text",text);
end
end
Expand the tree to see all the nodes.
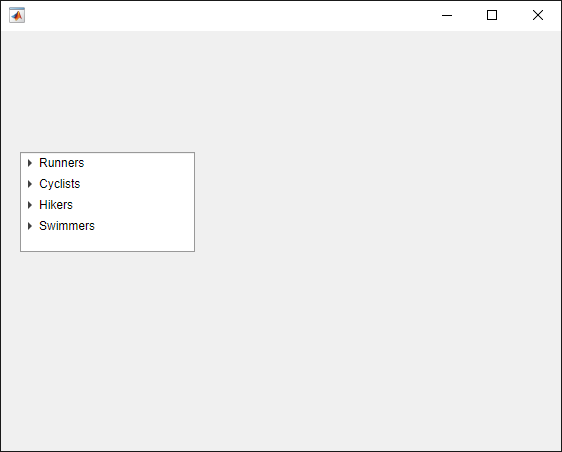
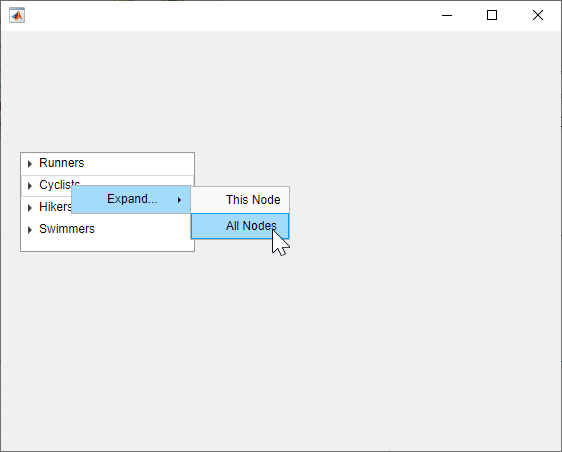
Create a context menu for a tree component. Assign the context menu to all of the top-level nodes in the tree.
In a new script in your current folder, create a UI figure. Then, create a tree with four top-level nodes and a set of nested nodes.
fig = uifigure;
t = uitree(fig,"Position",[20 200 175 100]);
category1 = uitreenode(t,"Text","Runners"); r1 = uitreenode(category1,"Text","Joe"); r2 = uitreenode(category1,"Text","Linda");
category2 = uitreenode(t,"Text","Cyclists"); c1 = uitreenode(category2,"Text","Rajeev");
category3 = uitreenode(t,"Text","Hikers"); h1 = uitreenode(category3,"Text","Jack");
category4 = uitreenode(t,"Text","Swimmers"); s1 = uitreenode(category4,"Text","Logan");
Create a context menu with one menu item and two submenus that users can click to expand a single tree node or all of the tree nodes. For each submenu, specify a MenuSelectedFcn callback function to execute when a user selects the menu option. Pass the relevant app object as input to each function to access app data from within the callback function.
cm = uicontextmenu(fig); m1 = uimenu(cm,"Text","Expand...");
sbm1 = uimenu(m1,"Text","This Node", ... "MenuSelectedFcn",{@expandSingle,fig}); sbm2 = uimenu(m1,"Text","All Nodes", ... "MenuSelectedFcn",{@expandAll,t});
Assign the context menu to the top-level tree nodes by setting theContextMenu property of each node to theContextMenu object.
category1.ContextMenu = cm; category2.ContextMenu = cm; category3.ContextMenu = cm; category4.ContextMenu = cm;
At the bottom of the file, define the expandSingle andexpandAll callback functions. Define the functions to accept the source and event data that MATLAB passes to all callback functions.
Define the expandSingle function to also accept the UI figure object containing the tree, and use theCurrentObject property of the figure to determine which tree node was clicked to bring up the context menu. Then, expand that node.
Define the expandAll function to also accept the tree object, and expand all of the nodes in the tree.
function expandSingle(src,event,f) node = f.CurrentObject; expand(node) end
function expandAll(src,event,t) expand(t) end
Save and run the script. Right-click any of the top-level tree nodes to view the context menu.
Input Arguments
Parent object, specified as a Tree orTreeNode object.
Sibling node, specified as a TreeNode object.
Location of the node relative to its sibling, specified as"after" or "before".
Name-Value Arguments
Specify optional pairs of arguments asName1=Value1,...,NameN=ValueN, where Name is the argument name and Value is the corresponding value. Name-value arguments must appear after other arguments, but the order of the pairs does not matter.
Example: node = uitreenode(t,Text="Measurements") creates a tree node with the label "Measurements".
Before R2021a, use commas to separate each name and value, and enclose Name in quotes.
Example: node = uitreenode(t,"Text","Measurements") creates a tree node with the label "Measurements".
Note
The properties listed here are a subset of the available properties. For a full list, see TreeNode.
Node text, specified as a character vector or string scalar.
Icon source or file, specified as a character vector, a string scalar, or anm-by-n-by-3 truecolor image array. If you specify a file name, it can be an image file name on the MATLAB path or a full path to an image file. If you plan to share an app with others, put the image file on the MATLAB path to facilitate app packaging.
Supported image formats include JPEG, PNG, GIF, SVG, or m-by-n-by-3 truecolor image array. For more information about truecolor image arrays, see Working with Image Types in MATLAB.
Example: 'icon.png' specifies an icon file on the MATLAB path.
Example: 'C:\Documents\icon.png' specifies a full path to an image file.
Node data, specified as an array of any type. Specify NodeData to share node-relevant data within your app code.
Version History
Introduced in R2017b