rectangle - Create rectangle with sharp or curved corners - MATLAB (original) (raw)
Create rectangle with sharp or curved corners
Syntax
Description
rectangle('Position',[pos](#f66-515573-pos)) creates a rectangle in 2-D coordinates. Specify pos as a four-element vector of the form [x y w h] in data units. The x and y elements determine the location and the w and h elements determine the size. The function plots into the current axes without clearing existing content from the axes.
rectangle('Position',[pos](#f66-515573-pos),'Curvature',[cur](#f66-515573-cur)) adds curvature to the sides of the rectangle. For different curvatures along the horizontal and vertical sides, specify cur as a two-element vector of the form [horizontal vertical]. For the same length of curvature along all sides, specify cur as a scalar value. Specify values between 0 (no curvature) and 1 (maximum curvature). Use [1 1] to create an ellipse or circle.
rectangle(___,[Name,Value](#namevaluepairarguments)) specifies rectangle properties using one or more name-value pair arguments. For example, 'FaceColor','red' specifies a red fill color. You can specify rectangle properties with any of the input argument combinations in the previous syntaxes.
rectangle([ax](#f66-515573-ax),___) creates the rectangle in the axes specified by ax instead of in the current axes (gca). The option ax can precede any of the input argument combinations in the previous syntaxes.
`r` = rectangle(___) returns the rectangle object. Use r to modify properties of the rectangle after it is created. For a list of properties, see Rectangle Properties. You can return an output argument with any of the previous syntaxes.
Examples
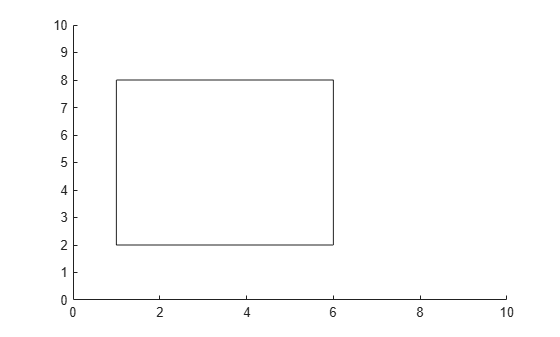
Draw Rectangle
Draw a rectangle that has a lower left corner at the point (1,2). Make the width of the rectangle 5 units and the height 6 units. Then, change the axis limits.
rectangle('Position',[1 2 5 6]) axis([0 10 0 10])
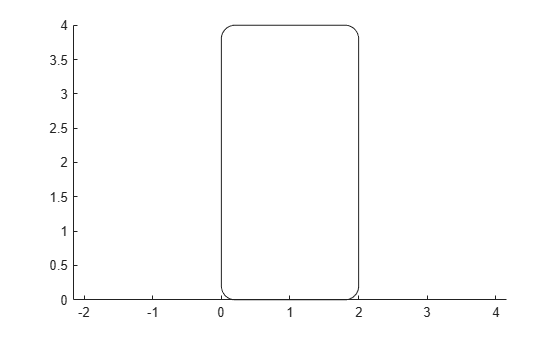
Draw Rectangle with Curved Edges
Draw a rectangle that has a lower left corner at (0,0) and an upper right corner at (2,4). Create the rectangle with curved corners by specifying the curvature as the scalar value 0.2. For data units of equal length along both the _x_-axis and _y_-axis, use axis equal.
figure rectangle('Position',[0 0 2 4],'Curvature',0.2) axis equal
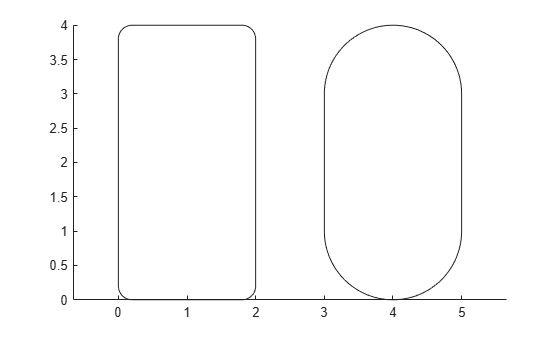
Add a second rectangle that has the shortest side completely curved by specifying the curvature as the scalar value 1.
rectangle('Position',[3 0 2 4],'Curvature',1)
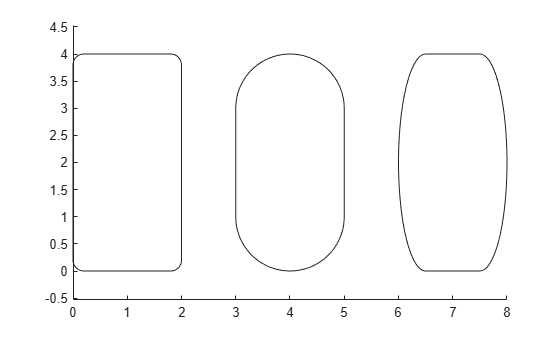
Add a third rectangle and use different curvatures along the horizontal and vertical sides. Use a horizontal curvature of 0.5 to make 50 percent of each horizontal side curved. Use a vertical curvature of 1 to make both vertical sides completely curved.
rectangle('Position',[6 0 2 4],'Curvature',[0.5,1])
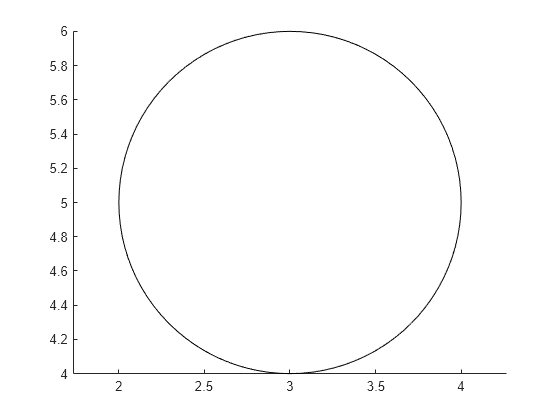
Draw Circle
Draw a circle by setting the Curvature property to [1 1]. Draw the circle so that it fills the rectangular area between the points (2,4) and (4,6). The Position property defines the smallest rectangle that contains the circle.
pos = [2 4 2 2]; rectangle('Position',pos,'Curvature',[1 1]) axis equal
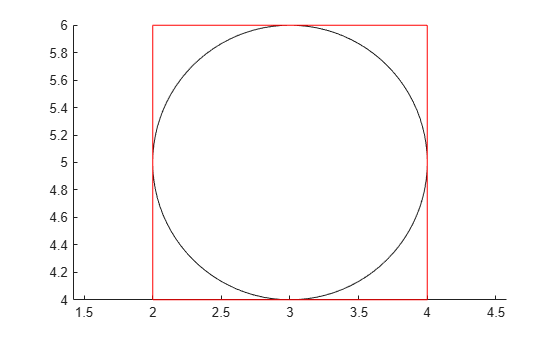
Draw a red rectangle using the same position values to show how the circle fills the rectangular area.
rectangle('Position',pos,'EdgeColor','r')
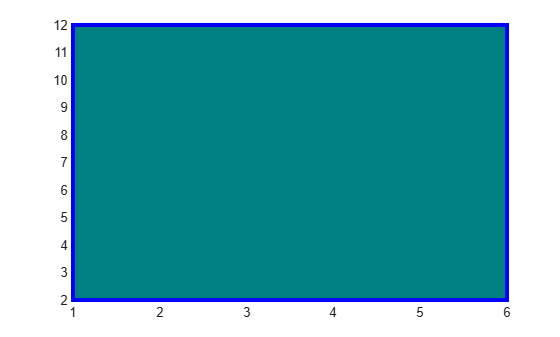
Specify Rectangle Outline and Fill Color
Draw a rectangle and specify the fill color, outline color, and outline width.
rectangle('Position',[1,2,5,10],'FaceColor',[0 .5 .5],'EdgeColor','b',... 'LineWidth',3)
Modify Rectangle After Creation
Add a rectangle to the current axes and return the rectangle object, r.
r = rectangle('Position',[0 0 1 1]')
r = Rectangle with properties:
FaceColor: 'none'
EdgeColor: [0 0 0]
LineWidth: 0.5000
LineStyle: '-'
Curvature: [0 0]
 Position: [0 0 1 1]
Use GET to show all properties
Modify the rectangle after creation using r. Change the fill color, outline color, and outline width.
r.FaceColor = [0 .5 .5]; r.EdgeColor = 'b'; r.LineWidth = 3;

Input Arguments
pos — Size and location of rectangle
four-element vector of the form [x y w h]
Size and location of the rectangle, specified as a four-element vector of the form [x y w h]. The x and y elements define the coordinate for the lower left corner of the rectangle. The w and h elements define the dimensions of the rectangle.
All values are in data units.
Example: rectangle('Position',[0.5 0.5 0.3 0.4])
Data Types: double | single | int8 | int16 | int32 | int64 | uint8 | uint16 | uint32 | uint64
cur — Amount of horizontal and vertical curvature
[0 0] (default) | two-element vector | scalar
Amount of horizontal and vertical curvature, specified as a two-element vector or a scalar value. Use this property to vary the shape of the rectangle from rectangular to ellipsoidal.
The horizontal curvature is the fraction of the width that is curved along the top and bottom edges. The vertical curvature is the fraction of the height that is curved along the left and right edges.
- To use different horizontal and vertical curvatures, specify a two-element vector of the form
[horizontal vertical]. Thehorizontalelement determines the horizontal curvature and theverticalelement determines the vertical curvature. Specify the values between 0 (no curvature) and 1 (maximum curvature). For example, a value of[0 0]creates a rectangle with square edges and value of[1 1]creates an ellipse. - To use the same curvature for the horizontal and vertical edges, specify a scalar value between 0 and 1, inclusive. The shorter dimension determines the length of the curvature.
Example: [0.5 0.6]
Example: 0.75
Data Types: double
ax — Axes object
axes object
Axes object. If you do not specify an axes object, then rectangle uses the current axes.
Name-Value Arguments
Specify optional pairs of arguments asName1=Value1,...,NameN=ValueN, where Name is the argument name and Value is the corresponding value. Name-value arguments must appear after other arguments, but the order of the pairs does not matter.
Before R2021a, use commas to separate each name and value, and enclose Name in quotes.
Example: rectangle('Position',[0 0 1 1],'EdgeColor','k','FaceColor',[0 .5 .5])
Fill color, specified as an RGB triplet, a hexadecimal color code, a color name, or a short name.
For a custom color, specify an RGB triplet or a hexadecimal color code.
- An RGB triplet is a three-element row vector whose elements specify the intensities of the red, green, and blue components of the color. The intensities must be in the range
[0,1], for example,[0.4 0.6 0.7]. - A hexadecimal color code is a string scalar or character vector that starts with a hash symbol (
#) followed by three or six hexadecimal digits, which can range from0toF. The values are not case sensitive. Therefore, the color codes"#FF8800","#ff8800","#F80", and"#f80"are equivalent.
Alternatively, you can specify some common colors by name. This table lists the named color options, the equivalent RGB triplets, and hexadecimal color codes.
| Color Name | Short Name | RGB Triplet | Hexadecimal Color Code | Appearance |
|---|---|---|---|---|
| "red" | "r" | [1 0 0] | "#FF0000" |  |
| "green" | "g" | [0 1 0] | "#00FF00" |  |
| "blue" | "b" | [0 0 1] | "#0000FF" |  |
| "cyan" | "c" | [0 1 1] | "#00FFFF" |  |
| "magenta" | "m" | [1 0 1] | "#FF00FF" |  |
| "yellow" | "y" | [1 1 0] | "#FFFF00" |  |
| "black" | "k" | [0 0 0] | "#000000" |  |
| "white" | "w" | [1 1 1] | "#FFFFFF" |  |
| "none" | Not applicable | Not applicable | Not applicable | No color |
Here are the RGB triplets and hexadecimal color codes for the default colors MATLAB® uses in many types of plots.
| RGB Triplet | Hexadecimal Color Code | Appearance |
|---|---|---|
| [0 0.4470 0.7410] | "#0072BD" | ![Sample of RGB triplet [0 0.4470 0.7410], which appears as dark blue](https://www.mathworks.com/help/matlab/ref/colororder1.png) |
| [0.8500 0.3250 0.0980] | "#D95319" | ![Sample of RGB triplet [0.8500 0.3250 0.0980], which appears as dark orange](https://www.mathworks.com/help/matlab/ref/colororder2.png) |
| [0.9290 0.6940 0.1250] | "#EDB120" | ![Sample of RGB triplet [0.9290 0.6940 0.1250], which appears as dark yellow](https://www.mathworks.com/help/matlab/ref/colororder3.png) |
| [0.4940 0.1840 0.5560] | "#7E2F8E" | ![Sample of RGB triplet [0.4940 0.1840 0.5560], which appears as dark purple](https://www.mathworks.com/help/matlab/ref/colororder4.png) |
| [0.4660 0.6740 0.1880] | "#77AC30" | ![Sample of RGB triplet [0.4660 0.6740 0.1880], which appears as medium green](https://www.mathworks.com/help/matlab/ref/colororder5.png) |
| [0.3010 0.7450 0.9330] | "#4DBEEE" | ![Sample of RGB triplet [0.3010 0.7450 0.9330], which appears as light blue](https://www.mathworks.com/help/matlab/ref/colororder6.png) |
| [0.6350 0.0780 0.1840] | "#A2142F" | ![Sample of RGB triplet [0.6350 0.0780 0.1840], which appears as dark red](https://www.mathworks.com/help/matlab/ref/colororder7.png) |
Example: "blue"
Example: [0 0 1]
Example: "#0000FF"
EdgeColor — Outline color
[0 0 0] (default) | RGB triplet | hexadecimal color code | 'r' | 'g' | 'b' | ...
Outline color, specified as an RGB triplet, a hexadecimal color code, a color name, or a short name. The default RGB triplet value of [0 0 0] corresponds to black.
For a custom color, specify an RGB triplet or a hexadecimal color code.
- An RGB triplet is a three-element row vector whose elements specify the intensities of the red, green, and blue components of the color. The intensities must be in the range
[0,1], for example,[0.4 0.6 0.7]. - A hexadecimal color code is a string scalar or character vector that starts with a hash symbol (
#) followed by three or six hexadecimal digits, which can range from0toF. The values are not case sensitive. Therefore, the color codes"#FF8800","#ff8800","#F80", and"#f80"are equivalent.
Alternatively, you can specify some common colors by name. This table lists the named color options, the equivalent RGB triplets, and hexadecimal color codes.
| Color Name | Short Name | RGB Triplet | Hexadecimal Color Code | Appearance |
|---|---|---|---|---|
| "red" | "r" | [1 0 0] | "#FF0000" | |
| "green" | "g" | [0 1 0] | "#00FF00" | |
| "blue" | "b" | [0 0 1] | "#0000FF" | |
| "cyan" | "c" | [0 1 1] | "#00FFFF" | |
| "magenta" | "m" | [1 0 1] | "#FF00FF" | |
| "yellow" | "y" | [1 1 0] | "#FFFF00" | |
| "black" | "k" | [0 0 0] | "#000000" | |
| "white" | "w" | [1 1 1] | "#FFFFFF" | |
| "none" | Not applicable | Not applicable | Not applicable | No color |
Here are the RGB triplets and hexadecimal color codes for the default colors MATLAB uses in many types of plots.
| RGB Triplet | Hexadecimal Color Code | Appearance |
|---|---|---|
| [0 0.4470 0.7410] | "#0072BD" | |
| [0.8500 0.3250 0.0980] | "#D95319" | |
| [0.9290 0.6940 0.1250] | "#EDB120" | |
| [0.4940 0.1840 0.5560] | "#7E2F8E" | |
| [0.4660 0.6740 0.1880] | "#77AC30" | |
| [0.3010 0.7450 0.9330] | "#4DBEEE" | |
| [0.6350 0.0780 0.1840] | "#A2142F" | |
Example: 'blue'
Example: [0 0 1]
Example: '#0000FF'
LineWidth — Line width
0.5 (default) | positive value
Line width, specified as a positive value in point units.
Example: 0.75
Line style, specified as one of the options listed in this table.
| Line Style | Description | Resulting Line |
|---|---|---|
| "-" | Solid line |  |
| "--" | Dashed line |  |
| ":" | Dotted line |  |
| "-." | Dash-dotted line |  |
| "none" | No line | No line |
Version History
Introduced before R2006a