Coupling of neural activity to blood flow in olfactory glomeruli is mediated by astrocytic pathways (original) (raw)
. Author manuscript; available in PMC: 2010 Aug 16.
SUMMARY
Functional neuroimaging uses activity-dependent changes in cerebral blood flow to map brain activity, but the contributions of pre- and postsynaptic activity are incompletely understood, as are the underlying cellular pathways. Using intravital multiphoton microscopy, we measured presynaptic activity, postsynaptic neuronal and astrocytic calcium responses, and erythrocyte velocity and flux in olfactory glomeruli during odor stimulation in mice. Odor-evoked functional hyperemia in glomerular capillaries was highly correlated with glutamate release, but did not require local postsynaptic activity. Odor stimulation induced calcium transients in astrocyte endfeet, and an associated dilation of upstream arterioles. Calcium elevations in astrocytes and functional hyperemia depended on astrocytic metabotropic glutamate receptor 5 and cyclooxygenase activation. Astrocytic glutamate transporters also contributed to functional hyperemia through mechanisms independent of calcium rises and cyclooxygenase activation. These local pathways initiated by glutamate account for a large part of the coupling between synaptic activity and functional hyperemia in the olfactory bulb.
INTRODUCTION
Synaptic activity induces a localized increase in cerebral blood flow (CBF) (Iadecola and Nedergaard, 2007). These hemodynamic changes are used to map brain function using functional neuroimaging (Raichle and Mintun, 2006). The steps from neural activity to CBF changes remain incompletely determined. Also unclear is how CBF changes should be used to make inferences regarding electrophysiological and metabolic changes in neural networks. In this regard, functional hyperemia has been variously correlated with neuronal input and local synaptic processing (Logothetis and Wandell, 2004; Lauritzen, 2005), or spiking activity of principal output neurons (Rees et al., 2000), or a combination of the two (Mukamel et al., 2005). Part of the uncertainty arises from the difficulty in disentangling presynaptic and postsynaptic contributions using traditional measures such as local field potentials. Therefore, there is a paucity of studies that individually probe the pre-, post- and extrasynaptic components of excitatory transmission under physiological conditions, and their contributions to functional hyperemia following physiological stimulation.
The cellular signaling pathways that underlie functional hyperemia are also incompletely understood. Astrocytes can dilate (Zonta et al., 2003a; Filosa et al., 2004) and constrict arterioles (Mulligan and MacVicar, 2004) in vitro. Vasodilation was mainly mediated by metabotropic glutamate receptors (mGluR) and prostaglandins (Zonta et al., 2003a). In vivo, calcium uncaging in astrocytes triggers arteriolar dilation via a cyclooxygenase (COX) 1-dependent mechanism (Takano et al., 2006). A fraction of the CBF response remained unresponsive to mGluR or COX inhibition in these studies, indicating that astrocytes might also employ additional pathways. It has also remained unclear whether these or other mechanisms contribute to functional hyperemia following physiological stimulation in vivo.
Here, we have investigated the contributions of pre-, post- and extrasynaptic activity to functional hyperemia, as well as the signaling pathways that underlie them, in a well-defined system using physiological stimulation. We used multiphoton microscopy to image local neuronal and astrocytic activity and CBF changes in olfactory bulb glomeruli. Glomeruli are ideally suited for this purpose, because they represent anatomical and functional units onto which all olfactory sensory axons that express the same odor receptor converge (Mombaerts et al., 1996). It has also been shown that odor-evoked functional hyperemia respects glomerular boundaries (Kida et al., 2002; Chaigneau et al., 2003).
To monitor glutamate release in glomeruli, we used mice that express the presynaptic probe synaptopHluorin (spH) (Miesenböck et al., 1998) in olfactory sensory neurons (Bozza et al., 2004). Odor stimulation results in graded fluorescence increases in activated glomeruli of these mice (Bozza et al., 2004; Wachowiak et al., 2005). We recorded spH, postsynaptic and astrocytic calcium responses and CBF parameters in glomeruli. We found that functional hyperemia is correlated with presynaptic glutamate release, but not with local postsynaptic activity. Through a series of imaging, electrophysiological and immunohistochemical experiments, we provide evidence that different astrocytic pathways mediate these CBF changes.
RESULTS
SynaptopHluorin fluorescence correlates with presynaptic electrical activity
Odor-evoked changes in spH fluorescence are linked to presynaptic activity (Bozza et al., 2004; Wachowiak et al., 2005), but the exact relation of spH signal to electrical activity in vivo has not been quantified. Therefore, we recorded multi-unit activity of olfactory sensory neurons and spH fluorescence from glomeruli in mice that express spH under control of the olfactory marker protein (OMP) promoter (Bozza et al., 2004). We recorded fluorescence with a CCD camera through a cranial window (Fig. 1A–B). Mice were stimulated with different concentrations of methyl tiglate (0.1 – 6.4 %). To avoid habituation, we presented 5 different odors between each concentration step. Each stimulus was preceded by pure air. We identified activated glomeruli by their fractional fluorescence change compared to air (0.61 ± 0.09 % ΔF/F; n = 18 glomeruli from 5 mice). Electrodes were then placed into responsive glomeruli (Fig. 1B). We observed a linear monotonic relation between spH fluorescence and the integrated olfactory nerve spike rate (Fig. 1C; r = 0.90, p < 0.001, Pearson correlation), indicating that spH fluorescence can be used as a marker of presynaptic activity over a wide dynamic range of physiological stimuli.
Figure 1. spH fluorescence correlates with presynaptic electric activity.
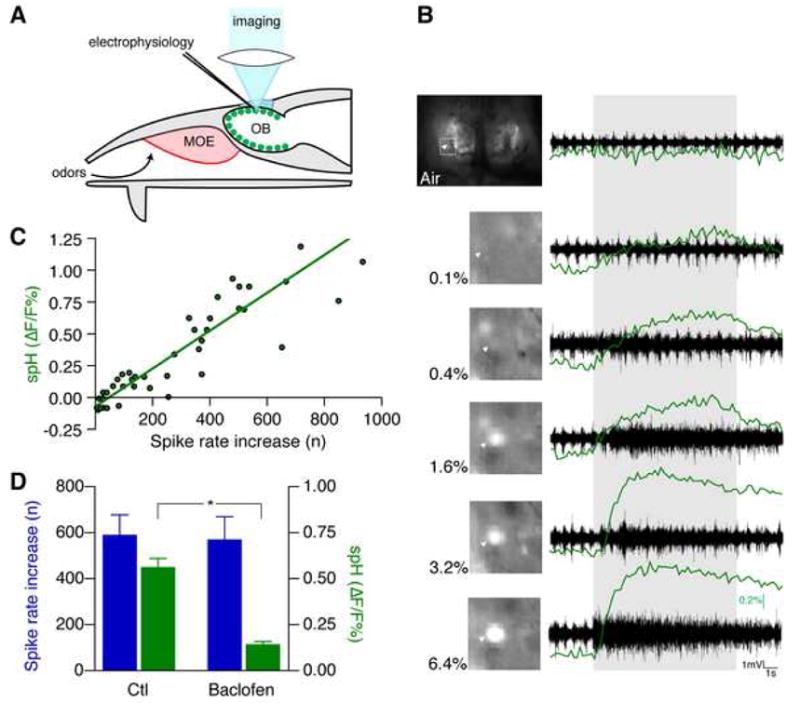
(A) Glomeruli (green) were visualized by exciting presynaptic spH with blue light through a cranial window over the olfactory bulbs (OB). Electrical activity was recorded with an electrode. MOE, main olfactory epithelium.
(B) Graded presynaptic fluorescence and electrical activity following odor stimulation. Bulbs were illuminated and imaged with a CCD camera. The highlighted glomerulus (arrowhead) responded to methyl tiglate at the indicated concentrations with a graded fluorescence increase (green traces). Presynaptic electrical activity recorded from this glomerulus showed a similar increase in spike rate. The duration of odor presentation is indicated by the gray area.
(C) The spike rate increase recorded from activated glomeruli shows a monotonic linear correlation with spH fluorescence. The line represents the Deming linear regression.
(D) Separation of presynaptic spiking activity and glutamate release by GABAB receptor modulation. Microinjection of the GABAB agonist baclofen strongly reduced odor-evoked OMP-spH increase, while the olfactory receptor neuron spiking rate increase remained unchanged (mean ± s.e.m., *p < 0.05, paired t-test).
To demonstrate that spH fluorescence indicates transmitter release, and not spike activity, we applied baclofen to the recording region by local microinjection (10 mM, n = 2 mice). Baclofen decreases glomerular glutamate release by activating presynaptic γ-aminobutyrate-B (GABAB) receptors (Wachowiak et al., 2005). spH fluorescence was strongly reduced, while presynaptic spike rate remained unchanged (Fig. 1D), consistent with the origins of the recorded multi-unit activity in the olfactory nerve layer, and that of spH signal in presynaptic terminals.
Simultaneous multiphoton imaging of CBF and presynaptic activity following physiological stimulation
We used multiphoton microscopy to monitor spH fluorescence and CBF simultaneously in glomeruli in vivo (Fig. 2A). We visualized blood vessels by tail vein injections of Texas Red dextran (Fig. 2B). Texas Red and spH could be excited at the same wavelength with minimal bleed-through in emission (Video S1). Vessels in the glomerular layer were capillaries (Fig. 2B) as previously reported (Chaigneau et al., 2003), while surface arteries and arterioles were located in the olfactory nerve layer (Fig. 2B and see below). Higher magnifications of the glomerular layer (Fig. 2C) revealed erythrocytes as dark objects moving in the fluorescently labeled plasma (Fig. 2D, Video S1). Their velocity and flux were determined by line scans along the central axis of glomerular capillaries (Dirnagl et al., 1992; Kleinfeld et al., 1998). By extending the line scans beyond the capillary length and into the glomerular tissue, we recorded changes in spH fluorescence and CBF simultaneously at high temporal and spatial resolution (Fig. 2E). Upon odor stimulation, velocity and flux increased (Fig. 2F–G).
Figure 2. Simultaneous multiphoton imaging of presynaptic activity and CBF in vivo.
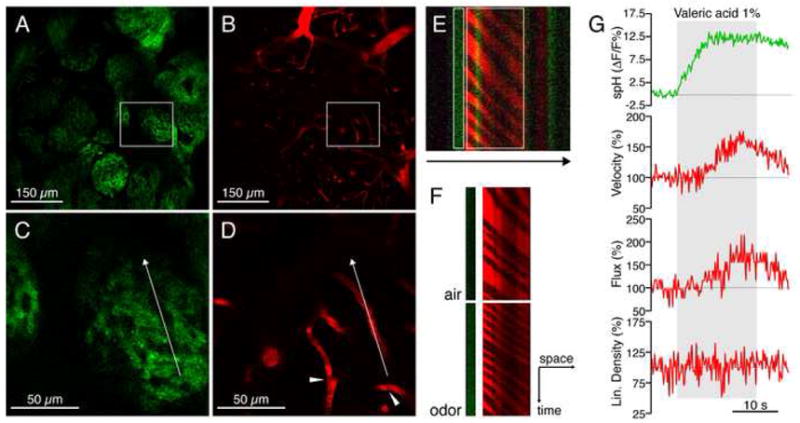
(A–B) Glomeruli were visualized by their spH expression and appeared at a depth of ~100–150 μm. Blood vessels were simultaneously imaged by labeling the plasma with Texas Red dextran. Vessels in the glomerular layer were capillaries (defined as diameter < 5 μm). Larger vessels are visible in upper layers at the border of the field of view because of the natural curvature of the bulb.
(C–D) Higher magnification (insets in A and B) revealed structural details of glomeruli, as well as erythrocytes as dark objects within the labeled plasma (arrowheads). The arrow indicates the length and orientation of the line scan.
(E) High frequency line scans of spH fluorescence (green) and plasma fluorescence (red) recorded from the glomerulus depicted in (C) and (D). Erythrocytes appear as bands in the labeled plasma (red). Extension of the line scan allowed for the simultaneous recording of presynaptic activity (green). The arrow indicates the direction of the scan. White rectangles indicate regions of interest in (F) and (G).
(F) Space-time matrix of erythrocyte ghosts demonstrates that velocity (inversely proportional to the slope of the dark bands), flux (proportional to the number of bands), and spH increase during odor presentation.
(G) Traces of the individual parameters measured in the glomerulus depicted in (C) and (D) during the presentation of valeric acid (gray area). spH fluorescence increased promptly, before the increase of velocity and flux. Linear density was calculated as the ratio of flux and velocity. Changes are relative to baseline levels, measured during air presentation preceding the stimulus.
Local glomerular CBF is correlated with presynaptic glutamate release
We used 25 different odorants (Table S1) to investigate the relation between spH intensity and functional hyperemia. Odors and recording regions were selected to achieve a sparse glomerular activation pattern (~1 activated glomeruli per field of view) to avoid possible overlap of neighboring co-activated glomeruli and to study responses of single glomeruli.
Stimulation led to an increase in spH fluorescence (5.8 ± 0.4 %; n = 103 glomeruli from 21 mice), with a large range from 0.3 % to 16.9 %. Baseline CBF parameters were obtained during the 10 s presentation of fresh air (velocity, 0.65 ± 0.11 mm/s; flux, 64.1 ± 9.8 s−1; n = 152 capillaries from 21 mice). An increase of velocity and flux was observed in 94 % of activated glomeruli. The onset of functional hyperemia, measured as the rise of flux to half-maximal amplitude, occurred later than the onset of the simultaneously recorded spH signal (difference of 2.2 ± 0.3 s, p < 0.05, paired t-test).
Following stimulation, velocity increased by 25.4 ± 3.6 % and flux by 34.5 ± 4.1 % (Video S3). The changes in velocity and flux showed a wide dynamic range (velocity 5.4 % to 71.3 %, flux 8.4 % to 76.9 %) and were correlated with the amplitude of spH increase (Fig. 3A). In addition, spH and CBF changes exhibited similar habituation when the same stimulus was intentionally presented in short temporal progression (Fig. 3B). The correlation between spH fluorescence and CBF changes was significant (velocity, r = 0.90; flux, r = 0.81, p < 0.001, Pearson correlation), and the data were well fitted by a linear regression (Fig. 3C–D).
Figure 3. Presynaptic glutamate release and CBF are highly correlated.
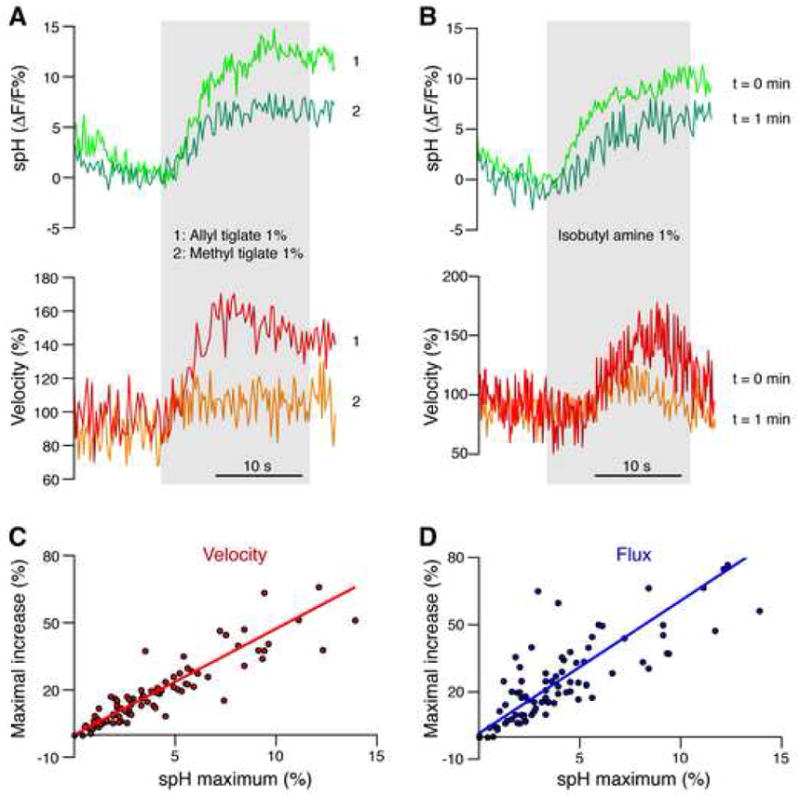
(A) A glomerulus responded to two different odors with different amplitudes of spH fluorescence, as expected from different binding affinities of a given odorant receptor to different odors. The amplitude of CBF increase, shown as velocity changes during odor presentations, was related to presynaptic activity. The gray area indicates the duration of odor presentation.
(B) Measuring spH fluorescence in a glomerulus during repeated presentation of the same odor in short intervals revealed habituation of the presynaptic response, indicated by the smaller response to the second stimulus. A similar habituation pattern was observed in the velocity changes.
(C–D) Velocity and flux changes were highly correlated with presynaptic activity. Lines represent the Deming linear regression.
Local postsynaptic blockade does not affect functional hyperemia in glomeruli
Since local CBF changes were correlated with presynaptic activity (and therefore, release of glutamate), we investigated the involvement of postsynaptic N-methyl-D-aspartate (NMDA) and α-amino-3-hydroxy-5-methylisoxazole-4-propionate (AMPA) receptors, which attenuate functional hyperemia in the neocortex and cerebellum (Lauritzen, 2005). To locally block these receptors, we injected antagonists into glomeruli. Injection pipettes were co-loaded with Texas Red to confirm localized injections into glomeruli of interest (Fig. S1).
To confirm blockade of ionotropic glutamate receptors, we recorded calcium changes in juxtaglomerular cells and mitral/tufted (M/T) cell dendrites following odor stimulation. Cells were labeled with the calcium indicator X-Rhod-1 acetoxymethyl ester (AM) by multicell bolus loading (Fig. 4A) (Stosiek et al., 2003). In responding glomeruli, we detected calcium transients in juxtaglomerular cells in all cases (Fig. 4A–B; ΔF/F 23 ± 6 %, n = 81 cells from 5 mice). Calcium increased 0.9 ± 0.2 s after the onset of the spH increase. Local injection of the NMDA receptor blocker APV (50 mM) and the AMPA receptor inhibitor 6-Cyano-7-nitroquinoxaline-2,3-dione (CNQX; 5 mM) abolished responses in 94 % of cells (Fig. 4A–B). A fraction of these cells likely represent astrocytes, which are sensitive to mGluR blockade (see below). Moreover, the spH increase following odor stimulation was significantly stronger after NMDA/AMPA blockade, consistent with presynaptic disinhibition (Fig. 4A–C) (McGann et al., 2005). This presynaptic augmentation was abolished when baclofen (100 μM) was coinjected with APV/CNQX (Fig. 4C).
Figure 4. Local postsynaptic activity is not required for functional hyperemia.
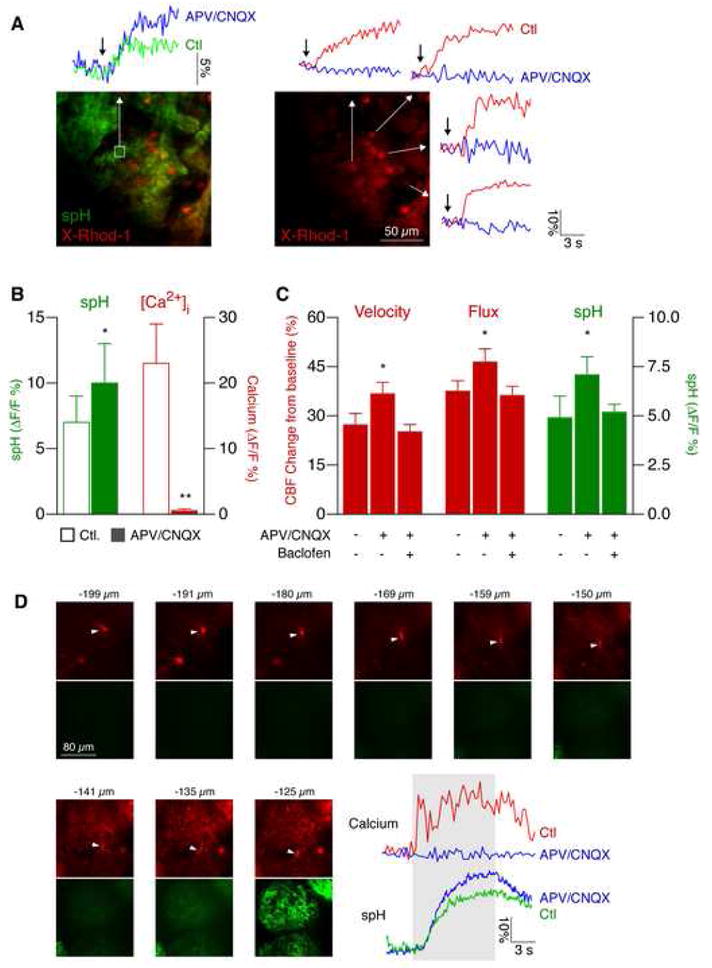
(A) Calcium imaging revealed block of postsynaptic responses in juxtaglomerular cells. Cells were labeled with the calcium indicator X-Rhod-1 AM (red) by multicell bolus loading. Presynaptic spH fluorescence (green trace) and postsynaptic calcium (red traces) increased following odor stimulation. After local injection of the NMDA receptor inhibitor APV and the AMPA receptor blocker CNQX, postsynaptic calcium changes were completely abolished (blue traces), while the presynaptic signal was augmented (blue trace), consistent with presynaptic disinhibition. Arrows indicate the start of stimulus.
(B) Analysis of presynaptic spH and postsynaptic calcium signals in juxtaglomerular cells before and after NMDA and AMPA receptor blockade (APV/CNQX) shows that calcium elevations are fully blocked, while the spH increase is augmented (mean ± s.e.m., **p < 0.001, *p < 0.05, paired t-test).
(C) Local postsynaptic activity does not contribute to functional hyperemia. Presynaptic activity was augmented after postsynaptic blockade with APV/CNQX. This presynaptic disinhibition was abolished by local GABAB receptor blockade with baclofen (100 μM). Velocity and flux increased to higher levels compared to control after local NMDA/AMPA blockade, and were not different from control after combined local NMDA/AMPA/GABAB blockade (mean ± s.e.m., *p < 0.05, Student’s t-test).
(D) Odor-evoked calcium responses in apical M/T cell dendrites are blocked by NMDA/AMPA receptor inhibition. M/T cells in OMP-spH mice were loaded with X-Rhod-1 AM (red). Their apical dendrites were followed up (arrowheads) to the glomerular layer (spH, green). The position of each optical section is indicated in microns below pial surface. Note that spH signals are only visible above ~135 μm. Odor stimulation (gray area) evoked calcium transients in M/T cell dendrites. Calcium responses were blocked by APV/CNQX, while the spH signal was augmented. Yellow boxes indicate regions of interest.
Although activity of periglomerular cells was abolished by injection of APV/CNQX, it remained possible that the dendrites of the principal M/T cells retained some responsiveness. We therefore labeled dendrites of M/T cells with X-Rhod-1 AM using a modified loading protocol (see Experimental Procedures). Optical sections starting from the glomerular region going towards the mitral cell body layer were used to identify apical dendrites of M/T cells (Fig. 4D). We then measured odor-evoked calcium responses in apical dendrites (Fig. 4D; peak ΔF/F 18 ± 3 %; n = 4 mice). These responses were fully blocked by local injection of APV and CNQX (Fig. 4D), again confirming blockade of postsynaptic activity by this treatment.
Although postsynaptic activity was blocked by local injection of APV/CNQX, odor-evoked hyperemia was not reduced (Fig 4C). In fact, it was slightly but significantly stronger, consistent with more glutamate released presynaptically and, accordingly, a stronger CBF response (Fig. 4C; n = 3 mice). When baclofen (100 μM) was injected together with APV/CNQX, the fractional spH increase and functional hyperemia were not different compared to control (Fig. 4C; n = 2 mice).
Astrocytes bridge glomerular synapses with blood vessels
Since release, but not local ionotropic activity of glutamate, was correlated with functional hyperemia, we next investigated the extrasynaptic contributions of glutamate. Because astrocytes detect glutamate released at glomerular synapses (De Saint Jan and Westbrook, 2005), we speculated that they act as an intermediary between glutamate and CBF changes. Staining for glial acidic fibrillary protein (GFAP) in fixed olfactory bulb slices demonstrated that each astrocyte sends its processes into a single glomerulus (Fig. 5A–B). Double immunostaining for GFAP and the vascular marker laminin B2/γ1 revealed that within glomeruli, astrocytic processes reach into the glomerular core and contact capillaries (Fig. 5C–D). Astrocytes contacted both glomerular capillaries as well as larger upstream vessels feeding into glomeruli (Fig. 5D, inset). Lower magnification images revealed that the complete vascular tree – i.e. large surface vessels, medium-sized vessels penetrating the olfactory nerve layer, and glomerular capillaries – is covered by astrocytes (Fig. 5E–F). Furthermore, staining for aquaporin-4, a marker for astrocytic endfeet (Simard et al., 2003), revealed a dense astrocytic network around blood vessels and throughout spH-negative portions of glomeruli (Fig. 5G–H).
Figure 5. Astrocytes couple synapses with the vasculature.
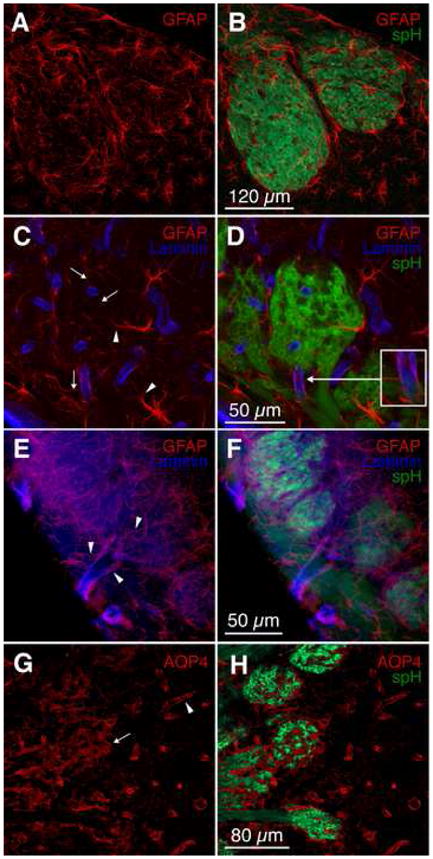
(A–B) Immunohistochemistry of olfactory bulb slices from OMP-spH mice showed that astrocytes (visualized with an antibody against GFAP, red) are located around and within glomeruli. Glomerular astrocytes are generally associated with a single glomerulus.
(C–D) Astrocytes (GFAP, red) send their processes into the glomerular core (arrowheads), and contact blood vessels (visualized with an antibody against laminin B2/γ1, blue) with multiple finer processes. The inset in (D) shows an astrocyte contacting a vessel feeding into the glomerulus from the overlying nerve layer.
(E–F) Astrocytes (GFAP, red) contact blood vessels (laminin B2/γ1, blue) throughout the vascular tree. Astrocytic processes (arrowheads) abundantly engulf large surface vessels, penetrating vessels in the olfactory nerve layer, and glomerular capillaries.
(G–H) Immunohistochemistry of astrocytic end-feet with an antibody against aquaporin-4 (AQP4, red) revealed the full coverage by astrocytes of olfactory bulb vessels (arrowhead) and spH-free zones within glomeruli (arrow).
Astrocytes throughout the vascular network show odor-selective calcium elevations
To probe astrocytic activity in vivo, we labeled the olfactory bulb of mice expressing GFP under the GFAP promotor with X-Rhod-1 AM by multicell bolus loading. Olfactory astrocytes are strongly labeled with GFP in these mice (De Saint Jan and Westbrook, 2005). Astrocytes exhibited calcium responses to odor stimulation (Fig. 6A) that commenced shortly after stimulus onset (0.9 ± 0.3 s). Glomerular astrocytes responded specifically to only one or very few odors (Fig. 6A), indicating that they are stimulated by glutamate released in activated glomeruli.
Figure 6. Astrocytic calcium responses in glomeruli are conveyed upstream and are associated with arteriolar dilation.
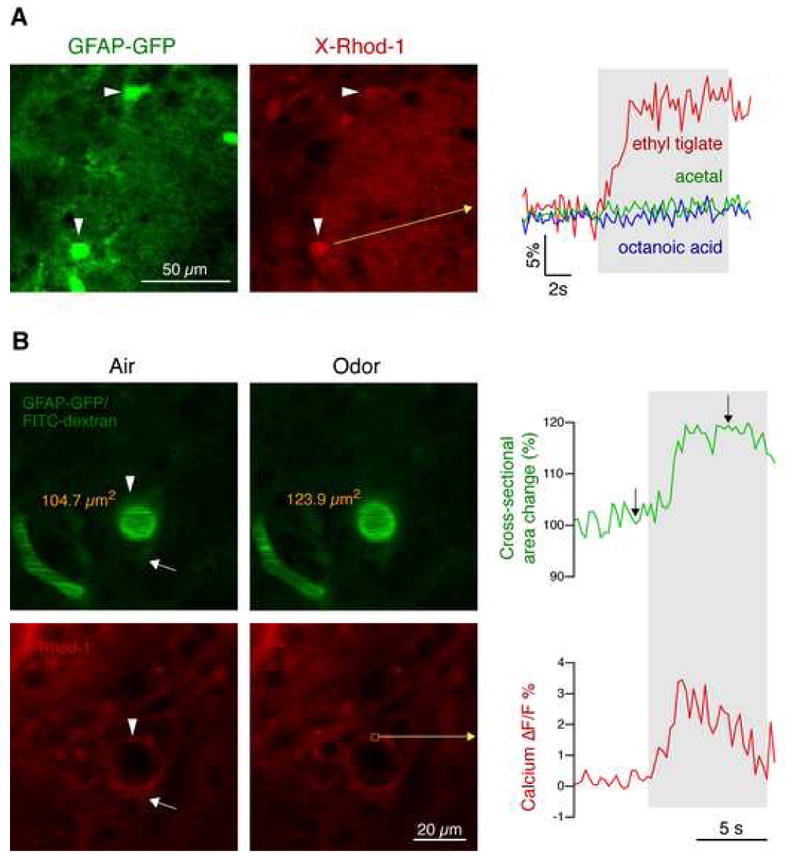
(A) Calcium imaging (X-Rhod-1 AM, red) in GFAP-GFP mice (green) revealed that glomerular astrocytes show odor-specific calcium responses. In this example, an astrocyte, identified by GFP expression (arrowheads), showed a strong response to ethyl tiglate, but not to acetal or octanoic acid (gray area, odor stimulation).
(B) Odor-evoked responses in astrocytic endfeet are associated with dilation of penetrating arterioles. Blood vessels were identified by tail vein injection of FITC dextran (green) in GFAP-GFP mice. GFP expression in astrocytes (arrow) and perivascular endfeet (arrowhead) appears dim because GFP is less fluorescent than FITC. Calcium imaging of astrocytic endfeet (arrowhead) using X-Rhod-1 AM (red) revealed that odor stimulation evoked calcium elevations similar to glomerular astrocytes. Perivascular astrocytic calcium responses were associated with arteriolar dilation, measured as change in cross-sectional area. In this example, cross-sectional area changed from 104.7 μm2 to 123.9 μm2, i.e. 18.3 %, corresponding to a flow increase of ~40 %. Images correspond to time points indicated by arrows in the graph.
To test whether periarteriolar astrocytes in the olfactory nerve layer also respond to odors, we labeled astrocytes by topical application of X-Rhod-1 AM (Hirase et al., 2004). Blood vessels were visualized by tail vein injections of fluorescein isothyocyanate (FITC) dextran. Arterioles were distinguished from venules by their thicker wall and by their direction of flow away from surface vessels. Similar to glomerular astrocytes, astrocytic endfeet located around upstream arterioles of the same vascular network also responded to odor stimulation (Fig. 6B; ΔF/F 4.3 ± 0.4 %). These calcium elevations appeared shortly after stimulus onset (1.0 ± 0.2 s). Because astrocytic endfeet moved rhythmically with heartbeat- and breathing-related movements, we could obtain successful recordings only in a subset of astrocytes (n = 11 endfeet from 6 mice).
Odor-evoked calcium responses in astrocytic endfeet are associated with arteriolar dilation
The main mechanism regulating CBF in capillaries is a change in the diameter of upstream arterioles. We hypothesized that astrocytic endfeet around penetrating arterioles would receive odor-evoked signals from glomerular astrocytes and convey these signals onto arterioles. To test this possibility, we measured changes in arteriolar cross-sectional area by labeling the vasculature with FITC dextran. We found that odor stimulation resulted in a significant increase in the cross-sectional area of penetrating arterioles between 13.4 % and 35.1 % (mean: 21.9 ± 4.2 %), corresponding to a flow increase between 29 % and 81 % (assuming Poiseuille’s law). Baseline fluctuations in cross-sectional area without stimulation were significantly lower (3.4 ± 1.1 %).
We then combined calcium imaging of astrocytes in GFAP-GFP mice with arteriolar cross-sectional area recordings. We found that odor-evoked calcium elevations in periarteriolar astrocytic endfeet were accompanied by increases in arteriolar cross-sectional area (Fig. 6B). The two signals were strongly correlated temporally and spatially: Invariably, calcium elevations in astrocytic endfeet preceded or coincided with arteriolar dilation, and non-reacting arterioles showed no calcium changes in surrounding endfeet. Small baseline fluctuations of arteriolar area were not associated with astrocytic calcium changes.
Glutamate mediates functional hyperemia via astrocytic mGluR5
We then sought to determine the intracellular pathways responsible for the vascular changes. These experiments were carried out in glomerular capillaries rather than in arterioles to simultaneously monitor spH responses and ensure that they were not altered in non-specific ways. Arterioles are above glomeruli and therefore spH cannot be recorded in those optical sections.
We tested whether mGluRs are involved in functional hyperemia following sensory stimulation. Topical application of the group I/II mGluR antagonist (S)-α-methyl-4-carboxyphenylglycine (MCPG, 50 mM) significantly reduced the odor-evoked increase of velocity by 48 ± 3 % and flux by 52 ± 4 % (n = 13 glomeruli from 4 mice; p < 0.05, paired t-test). Since topically applied drugs may not adequately penetrate brain tissue, we also microinjected MCPG into the bulb, which also reduced velocity and flux responses at two different concentrations (1 mM and 50 mM; Fig. 7A). Importantly, spH fluorescence remained unchanged (Fig. 7A).
Figure 7. Astrocytes mediate functional hyperemia through mGluR5 and glutamate uptake.
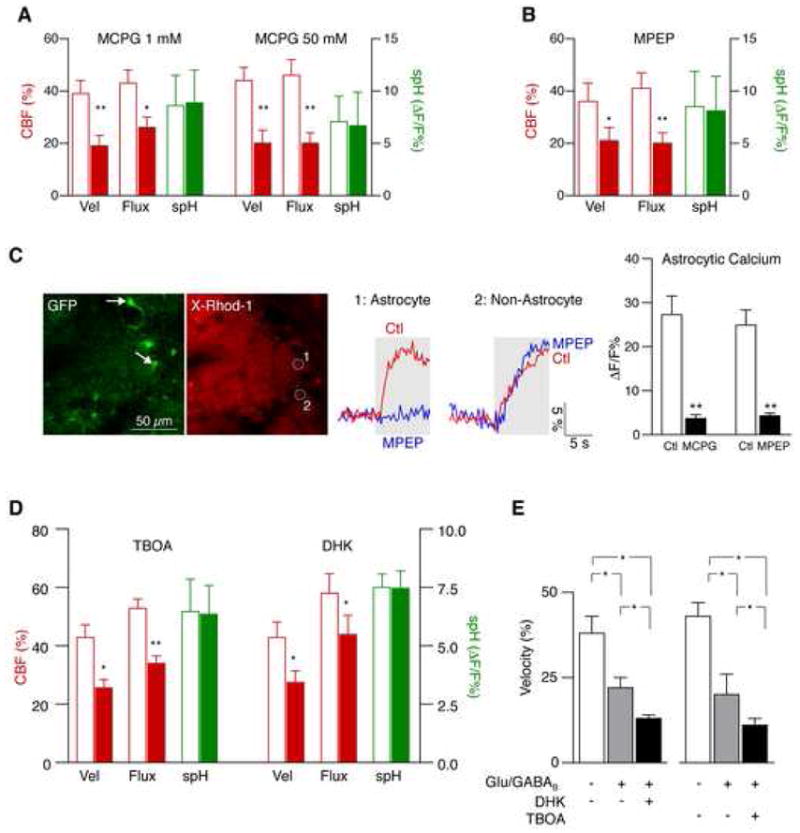
(A–B) Functional hyperemia is mediated in part by astrocytic mGluR5. The broad-spectrum mGluR inhibitor MCPG reduced functional hyperemia at different concentrations (A). The mGluR5 inhibitor MPEP attenuated functional hyperemia to a similar extent (B). Both drugs were applied by local microinjection into the glomerular layer. CBF parameters are relative to baseline. spH responses remained unchanged (mean ± s.e.m.; **p < 0.001, *p < 0.05, paired t-test).
(C) Local mGluR inhibition blocks odor-evoked astrocytic calcium responses. Juxtaglomerular cells (and presynaptic fibers) in GFAP-GFP mice were labeled with X-Rhod-1 AM (red). Astrocytes were identified by their expression of GFP (green, arrows). MCPG and MPEP both blocked calcium responses in astrocytes. MCPG reduced calcium in different cell types, whereas the effect of MPEP was specific for astrocytes, consistent with exclusive expression of mGluR5 in astrocytes in the glomerular layer (mean ± s.e.m., **p < 0.001, paired t-test). Areas 1 and 2 represent calcium signals from an astrocyte (identified by GFP expression) and a GFP-negative cell, respectively. Gray areas represent the duration of odor stimulation.
(D) Astrocytic glutamate uptake also contributes to functional hyperemia. Changes of spH and velocity/flux before and after application of the broad-spectrum glutamate transporter inhibitor TBOA, and dihydrokainate (DHK), a specific blocker of the astrocytic glutamate transporter GLT-1 (mean ± s.e.m.; **p < 0.001, *p < 0.05, paired t-test).
(E) Glutamate transport contributes to functional hyperemia independently from glutamatergic and GABAB receptors. Local inhibition of NMDA, AMPA, mGluR and GABAB receptors reduced functional hyperemia. An additional reduction was observed after blockade of glutamate transporters with TBOA, or by inhibition of astrocytic GLT-1 with DHK (mean ± s.e.m.; *p < 0.05, Repeated Measures ANOVA followed by Tukey Test).
Several mGluR subtypes are also expressed by M/T cells (Ennis et al., 2006), and astrocytes respond to currents generated by mGluR located on these cells (De Saint Jan and Westbrook, 2005). Therefore, we performed additional experiments with 6-methyl-2-(phenylethynyl)-pyridine (MPEP), a selective antagonist of mGluR5, which in the glomerular layer is exclusively expressed by astrocytes (van den Pol, 1995). MPEP (100 μM) injected into the bulb led to a significant reduction (~40%) of functional hyperemia (Fig. 7B). Again, spH fluorescence was not altered (Fig. 7B, paired t-test).
To ascertain that sufficient concentrations of mGluR blockers had been applied, we recorded calcium signals from glomerular astrocytes in GFAP-GFP mice (Fig. 7C). MCPG (1 mM) and MPEP (100 μM) both suppressed odor-evoked calcium responses in astrocytes (Fig. 7C). MCPG reduced responses in most juxtaglomerular cells, while MPEP was specific for astrocytes (Fig. 7C).
Astrocytic glutamate uptake represents an additional pathway of functional hyperemia
Because a significant fraction of the CBF response remained unresponsive to mGluR inhibition, we explored the involvement of additional astrocytic signaling pathways. Another major pathway for glutamatergic actions on astrocytes involves uptake through amino acid transporters (Marcaggi and Attwell, 2004). Glutamate uptake has been implicated in the initiation of astrocytic glucose utilization (Voutsinos-Porche et al., 2003), and in the generation of intrinsic optical signals in the olfactory bulb (Gurden et al., 2006).
To investigate whether glutamate uptake into astrocytes represents an additional neurovascular signaling pathway, we first applied the broad-spectrum glutamate transporter inhibitor DL-_threo_-_β_-Benzyloxyaspartic acid (TBOA) topically to the olfactory bulb (10 mM; n = 5 mice). This treatment reduced odor-evoked velocity increase by 40 ± 3 % and flux increase by 35 ± 3 % (Fig. 7D; n = 18 glomeruli from 6 mice; p < 0.05, paired t-test). A similar effect was observed when TBOA was injected into the glomerular region (100 μM, velocity 39 ± 3 %, flux 35 ± 5 % reduction from control; n = 8 glomeruli from 3 mice). SpH responses remained similar to control (Fig. 7D).
TBOA inhibits both astrocytic and neuronal glutamate transporters, both of which are expressed in glomeruli (Utsumi et al., 2001). To achieve higher selectivity for astrocytic glutamate uptake, we applied dihydrokainate (400 μM) by local microinjection. Dihydrokainate selectively inhibits the astrocytic glutamate transporter GLT-1, which is also expressed in glomeruli (Utsumi et al., 2001). Dihydrokainate reduced the odor-evoked CBF response, while the spH increase remained unchanged (Fig. 7D; n = 15 glomeruli from 5 mice; p < 0.05, paired t-test). A similar reduction was also observed at a higher concentration (1 mM; velocity, 32 ± 4 %; flux, 26 ± 4 %; n = 3 mice).
Inhibition of glutamate uptake into astrocytes increases the extracellular concentration and half-life of glutamate, which could alter its action on glutamate receptors. We indeed observed this effect in initial experiments, which showed stronger postsynaptic responses after local TBOA injection (data not shown). To control for potentially higher ionotropic and metabotropic receptor activity after glutamate transport blockade, we blocked glutamate receptors by combined local injection of APV (50 mM), CNQX (5 mM), and MCPG (50 mM), and presynaptic GABAB receptors with baclofen (100 μM). This treatment reduced odor-evoked CBF responses (Fig. 7E). However, functional hyperemia decreased even further after subsequent injection of dihydrokainate (1 mM; Fig. 7E; n = 7 glomeruli from 3 mice) or TBOA (1 mM; Fig. 7E; n = 6 glomeruli from 3 mice), indicating that glutamate uptake contributes to functional hyperemia independently of ionotropic and metabotropic glutamate receptors, as well as presynaptic GABAB receptors. The effects of TBOA and MPEP were found for all odors without apparent spatial or odor-specific differences.
Functional hyperemia mediated by mGluR, but not by glutamate uptake, depends on cyclooxygenase
As noted above, the calcium increase in glomerular astrocytes was dependent on mGluR5 (Fig. 7C). However, in accordance with other reports (Bernardinelli et al., 2004), we observed no significant changes of the astrocytic calcium response when TBOA or dihydrokainate were injected locally into glomeruli of GFAP-GFP mice (TBOA, 19.3 ± 3.2 vs. 22.5 ± 3.4 ΔF/F %; DHK, 17.1 ± 4.2 vs. 19.1 ± 3.7 % ΔF/F %; paired t-test; n = 26 astrocytes from 4 mice). There was a slight tendency for the calcium responses to increase, but this effect did not reach statistical significance.
Direct activation of astrocytes induces vasodilation by COX1 activation and prostaglandin synthesis (Zonta et al., 2003a; Takano et al., 2006). We asked whether the pathways mediated by mGluR and glutamate uptake are also COX1-dependent. Immunohistochemistry of bulb slices from GFAP-GFP mice revealed that COX1 is strongly and exclusively expressed by astrocytes in the glomerular layer (Fig. 8A), indicating that COX1 inhibitors can be used to selectively target glomerular astrocytes. In contrast, COX2 expression was sparse and mostly observed in neurons below the glomerular layer (Figure S2).
Figure 8. Functional hyperemia mediated by mGluR and glutamate uptake is controlled by separate pathways.
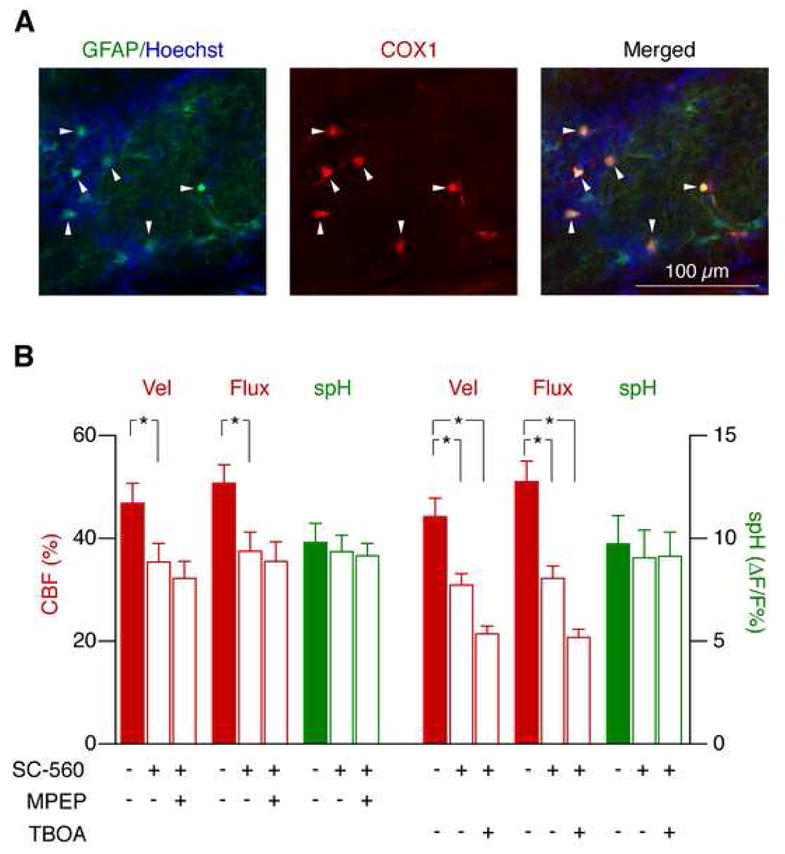
(A) COX1 is exclusively expressed by astrocytes in the glomerular layer. GFAP-GFP mice were used to identify astrocytes (green). Glomeruli were identified as cell-poor areas surrounded by juxtaglomerular cells (Hoechst 33258, blue). COX1 (red) was only detected in astrocytes (merged images, right).
(B) Functional hyperemia mediated by mGluR5, but not by glutamate uptake, depends on COX1 activation. SC-560 reduced the odor-evoked CBF response. Application of MPEP after SC-560 had no additional effect, indicating that mGluR5 affects CBF predominantly through COX activation. In contrast, TBOA reduced functional hyperemia even further after SC-560 application (mean ± s.e.m., *p < 0.05, Repeated Measures ANOVA followed by Tukey Test).
The COX1 inhibitor SC-560, applied by local microinjection (500 μM), reduced odor-evoked velocity and flux increase by 34 ± 6 % and by 36 ± 7 %, respectively (Fig. 8B; n = 12 glomeruli from 4 mice). No significant further reduction was seen after subsequent local injection of the mGluR5 antagonist MPEP (Fig. 8B), indicating that COX1 activation occurs downstream of mGluR5 activation. Moreover, the exclusive expression of both proteins in astrocytes indicates that they are part of a common astrocytic signaling pathway. In contrast, in mice treated with SC-560 in a separate group (n = 10 glomeruli from 4 mice), local injection of TBOA reduced functional hyperemia even further (Fig. 8B). Similarly, application of TBOA resulted in an additional reduction of functional hyperemia when applied after MPEP in the same animal (MPEP: velocity, 42 ± 3 %, flux 41 ± 6 %; TBOA: velocity 59 ± 5 %, flux 61 ± 3 %, reduction of hyperemia relative to control; n = 18 glomeruli from 3 mice; p < 0.05, Repeated Measures ANOVA followed by Tukey Test).
Cerebrovascular reactivity following local drug application
Finally, we ascertained that the observed changes of the CBF response were due to the specific modulation of functional hyperemia induced by neural activity. Baseline CBF values are reported in Table 1. Drugs were co-injected with FITC (Fig. S3). To test vascular reactivity, we bolus-injected the carbonic anhydrase inhibitor acetazolamide (14 mg/kg i.v.), which induces vasodilation independently of neural activity by increasing tissue pCO2. Acetazolamide induced an increase in velocity and flux in glomerular capillaries (Fig. S3). No differences were observed after injections of MPEP, DHK, TBOA, and APV/CNQX, but SC-560 reduced pCO2 reactivity (n = 2 mice for each; Fig. S3) as previously reported (Niwa et al., 2001). However, this reduced pCO2 reactivity is unlikely to be a confounding factor, because SC-560 interacted differently with TBOA and MPEP in terms of its effect on functional hyperemia.
Table 1.
Baseline CBF parameters.
| Ctl. vs. | |||||||
|---|---|---|---|---|---|---|---|
| MCPG | MPEP | TBOA | DHK | SC-560 | APV/CNQX | ||
| Systemic/Topical | Velocity (mm/min) | 0.65 ± 0.11 vs. 0.64 ± 0.14 | 0.64 ± 0.15 vs. 0.62 ± 0.11 | 0.58 ± 0.17 vs. 0.58 ± 0.13 | N/A | N/A | N/A |
| Flux (s−1) | 64.1 ± 9.8 vs. 72.4 ± 8.3 | 75.9 ± 8.6 vs. 68.3 ± 10.1 | 62.4 ± 6.8 vs. 61.9 ± 7.8 | ||||
| Local Microinj. | Velocity (mm/min) | 0.61 ± 0.13 vs. 0.59 ± 0.14 | 0.64 ± 0.16 vs. 0.62 ± 0.10 | 0.69 ± 0.17 vs. 0.67 ± 0.19 | 0.59 ± 0.16 vs. 0.60 ± 0.18 | 0.61 ± 0.22 vs. 0.58 ± 0.19 | 0.63 ± 0.15 vs. 0.63 ± 0.16 |
| Flux (s−1) | 68.2 ± 8.7 vs. 70.3 ± 9.4 | 72.5 ± 8.1 vs. 67.2 ± 7.6 | 63.4 ± 7.7 vs. 66.5 ± 8.1 | 64.6 ± 12.1 vs. 59.3 ± 11.3 | 59.8 ±10.2 vs. 55.6 ± 9.3 | 60.1 ± 9.6 vs. 63.7 ± 11.5 |
DISCUSSION
The aim of this study was to investigate the contribution of the individual components of excitatory synaptic transmission to functional hyperemia, as well as the underlying pathways, in the olfactory bulb using physiological stimuli. We find that presynaptic activity in glomeruli is highly correlated with functional hyperemia, and that arteriolar tone and local capillary perfusion are regulated by astrocytes. Two mechanisms contributed to this effect, mGluR5 and COX activation, and astrocytic glutamate uptake through GLT-1. These results suggest that astrocytes, by sensing released glutamate, regulate local CBF adaptation to neuronal activity. Furthermore, depending on the stimulus paradigm and system investigated, different mechanisms may prevail in the precise control of CBF.
Pre- and postsynaptic contributions to functional hyperemia
Because of the localized and prompt increase in CBF following neuronal activation, functional hyperemia is the most important marker to map regional brain activity and observe the brain “at work” in humans and animals (Raichle and Mintun, 2006). Despite this fundamental importance for basic and clinical neuroscience, it remains unclear which aspects of neural activity are relevant for functional hyperemia. One view holds that the output of principal neurons, measured as the efferent spiking activity, correlates with functional hyperemia (Rees et al., 2000). Other studies have demonstrated that the input to neurons and local synaptic processing (as measured by the local field potential), are better correlated with functional hyperemia (Logothetis and Wandell, 2004; Lauritzen, 2005). Yet another study suggested that local field potential and spiking activity can both predict CBF changes equally well (Mukamel et al., 2005).
The uncertainty regarding “local synaptic processing” may stem in part from the fact that the local field potential, i.e. the sum of all local synaptic events in a given area (Logothetis and Wandell, 2004), does not always differentiate local presynaptic from postsynaptic activity. In glomeruli, the local field potential is generated by postsynaptic currents (Aroniadou-Anderjaska et al., 1997), and therefore is not a direct indicator of presynaptic activity. Moreover, postsynaptic blockers can also influence transmitter release. For example, the present study and others (McGann et al., 2005) found that local postsynaptic blockade increased glutamate release by presynaptic disinhibition in the olfactory bulb. In other conditions, AMPA blockade can actually decrease glutamate release (Brickley et al., 2001), and systemic application of AMPA blockers not only blocks postsynaptic cortical receptors, but also glutamate release from afferent thalamocortical projections (Gsell et al., 2006). Furthermore, topical application of postsynaptic blockers will not only decrease activity of principal output neurons, but also presynaptic glutamate release from local excitatory neurons in that network, which are normally recruited by recurrent activity. It is therefore possible that the effect on functional hyperemia attributed to postsynaptic activity were in part related to presynaptic or extrasynaptic activity, neither of which was measured concomitantly. We have overcome this uncertainty by the use of gene-targeted mice in which presynaptic activity can be accurately measured, enabling us to introduce predictable perturbations downstream of neural activity – this has not always been the case in previous studies, which often monitored some mixture of pre- and postsynaptic activity. In addition, we have measured activation of many key steps, starting from transmitter release all the way to CBF, under natural sensory stimulation.
Using an optical marker of presynaptic vesicle exocytosis, we show that there is an exquisite analog coupling between neural activity and CBF, despite many steps between the two variables. Our data suggest that functional hyperemia in the olfactory bulb, and by inference functional neuroimaging signals, is representative of local synaptic processing, and specifically incoming neuronal activity, rather than spiking activity.
Functional hyperemia remained unchanged when local postsynaptic activity of juxtaglomerular and M/T cells was blocked. In contrast, ionotropic glutamate receptor blockade attenuated functional hyperemia in the cerebellum and neocortex (Yang and Iadecola, 1996; Offenhauser et al., 2005; Gsell et al., 2006). While the mechanisms outlined above may in part contribute to the differences, it is also possible that different pathways exist in the olfactory bulb, or that the prevailing mechanism controlling functional hyperemia is stimulus-dependent. In this regard, it is important to emphasize that we focused on local CBF responses in single glomeruli by using a very sparse activation paradigm. In another study, it was reported that clustered activation of more glomeruli, i.e. a stronger stimulus paradigm, resulted in CBF responses that were attenuated by global, but not local, postsynaptic blockade (Chaigneau et al., 2007). The long-range networks capable of controlling CBF between co-activated glomeruli are unknown, but may involve interglomerular excitatory or inhibitory connections. Interestingly, a quantitative analysis of glomerular metabolic demands (Nawroth et al., 2007) reported that the postsynaptic receptor response contributes to less than 0.3 % of the total energy budget during low activation comparable to our conditions, but increases exponentially to one-third with activation patterns comparable to those used by Chaigneau et al. (2007). It is intriguing to speculate that presynaptic and extrasynaptic actions of glutamate prevail at sparse glomerular activations, while the contribution of postsynaptic mechanisms to functional hyperemia increases with stronger activation. It will be an important issue in future research to investigate whether widespread or relatively strong stimuli affect functional hyperemia mainly by postsynaptic mechanisms, while localized or weak stimuli predominantly rely on pre- and extrasynaptic mechanisms.
Different astrocytic mechanisms control local glomerular CBF responses
A distinctive feature of the olfactory system is that activity-dependent CBF (Kida et al., 2002; Chaigneau et al., 2003) and metabolic signals (Lancet et al., 1982) follow glomerular boundaries. Moreover, glomeruli contain only capillaries, which depend on diameter changes of upstream arterioles. These upstream vessels must dilate to allow for hyperemia in an activated glomerulus. Given the distinctly stratified anatomy of the olfactory bulb, it is unlikely that postsynaptic ionotropic currents, which occur below the nerve layer, can mediate the necessary local upstream adaptations alone. We propose that astrocytes, which respond to glutamate in glomeruli, mediate these changes, for the following reasons. First, we show that astrocytes contact synapses and capillaries in glomeruli, as well as penetrating arterioles in the nerve layer. Second, we find that glomerular astrocytes respond to physiological stimulation in an odor-specific fashion. Third, we show that astrocytes form a functional syncytium –glomerular astrocytes activated by an odor convey these signals onto astrocytes located around upstream penetrating arterioles. Finally, we find that these odor-evoked calcium signals in periarteriolar astrocytic endfeet are associated with changes in arteriolar diameter. Therefore, by their distinctive association with single glomeruli, astrocytes convey the input from nerve fibers expressing a single odor receptor onto capillaries and upstream vessels, thus contributing to adequate local perfusion.
Earlier studies have shown that astrocytes respond to sensory stimulation (Wang et al., 2006) and change arteriolar tone when directly activated (Takano et al., 2006). Here we show that in the olfactory bulb, astrocytic calcium elevations evoked by physiological sensory stimulation also control functional hyperemia. Although we did not manipulate single astrocytes, we likely achieved adequate selectivity for astrocytes for the following reasons. First, drug targets such as mGluR5, COX1 and GLT-1, are exclusively expressed by glomerular astrocytes. Second, we showed that the effect of GLT-1 inhibition on functional hyperemia still existed after blockade of glutamate and GABAB receptors. Third, all experiments were carried out by local drug injections, to minimize systemic effects and achieve adequate drug levels.
We found that astrocytes contribute to functional hyperemia by at least two pathways –mGluR5 and COX1 activation, and a second pathway that includes glutamate uptake. The pathway mediated by mGluR5 and COX1 is also involved in vasodilation mediated by direct astrocytic stimulation in vitro (Zonta et al., 2003a) and in vivo (Takano et al., 2006), and possibly involves COX activation by mGluR5-induced calcium transients (Zonta et al., 2003b). However, other studies found that COX2 rather than COX1 contributes to functional hyperemia (Niwa et al., 2000; Niwa et al., 2001). Interestingly, SC-560 reduces resting CBF in the neocortex (Niwa et al., 2001), but had no significant effect on basal velocity and flux in glomeruli in our study. Moreover, olfactory bulb COX2 expression differed strongly from the neocortex (Fig. S2). Thus, the role of COX isoforms in cerebrovascular regulation may differ between the olfactory bulb and other regions. We note, however, that the selectivity of SC-560 for COX1 is lower in vivo (Brenneis et al., 2006), and we cannot completely exclude a role for COX2 in our experiments.
Uptake of glutamate into astrocytes constituted an additional pathway of functional hyperemia, accounting for about one third of the CBF response. A recent study showed that glutamate uptake also contributed to activity-dependent changes in intrinsic optical signals (Gurden et al., 2006), but it was not reported whether neuronal or glial uptake were associated with intrinsic signals. However, in the olfactory bulb, the response spectrum of intrinsic optical signals across different wavelengths is different from the absorption spectra of oxy-and deoxyhemoglobin (Meister and Bonhoeffer, 2001), indicating that cell swelling, and not CBF changes, is the predominant source of intrinsic signals in the olfactory bulb. Furthermore, mGluR activation, which accounted for a large fraction of functional hyperemia in our study, has no effect on intrinsic signals (Gurden et al., 2006).
The intracellular pathways by which astrocytic glutamate uptake mediates functional hyperemia remain to be elucidated. Although glutamate transport appeared independent of larger calcium changes in astrocytic somata, we cannot exclude the possibility that glutamate uptake induces small local calcium transients not detected by in vivo imaging. Moreover, glutamate transport consumes energy (Attwell and Laughlin, 2001) and may initiate astrocytic glycolysis and lactate release (Voutsinos-Porche et al., 2003). Astrocytes have been hypothesized to convert these metabolic signals into CBF changes (Vlassenko et al., 2006). Thus, astrocytes may contribute to the high temporal and spatial correlation of blood flow increase and glucose consumption observed in functional brain imaging (Raichle and Mintun, 2006).
EXPERIMENTAL PROCEDURES
Animal surgery and stimulation
Adult OMP-spH or GFAP-GFP mice (Jackson Laboratories) were anesthetized with urethane (1.5 mg/kg i.p.; Sigma) and were freely breathing room air. Body temperature was maintained at 37 °C by a heating blanket (Harvard Apparatus). An aluminum plate was glued to the skull, and the bulb was exposed using a dental drill. The dura was removed when drugs were applied topically. The surface was kept moist with artificial cerebrospinal fluid (aCSF, 135 mM NaCl, 5.4 mM KCl, 5 mM HEPES, 1.8 mM CaCl2, pH 7.4). Before imaging, 1.5 % agarose in aCSF was placed on the bulb and the window was closed with a coverslip. Respiration was monitored with a piezo transducer and remained constant throughout experiments. Oxygen saturation and heart rate were monitored with a pulse oximeter (Nonin). In a series of parallel experiments, the femoral artery was cannulated for blood pressure and blood gas determination (Radiometer; mean arterial pressure, 75 ± 6 mmHg; pO2, 81 ± 3; pCO2, 35 ± 4; pH, 7.33 ± 0.2; n = 18). All experiments were approved by the Standing Committee on the Use of Animals in Research of Harvard University.
Odorants (Sigma; Table S1) were delivered by a custom-built automated odor delivery system controlled by custom-written software in Labview (National Instruments). Inter-stimulus interval was >2 minutes.
Pharmacology
Topically applied drugs were dissolved in aCSF. MPEP (Tocris), dihydrokainate (Sigma), APV (Sigma), CNQX (Tocris), baclofen (Tocris), SC-560 (Cayman), TBOA (Tocris) and MCPG (Tocris) were dissolved in aCSF and injected locally into the bulb using a glass pipette (tip diameter 3 μm) connected to a Picospritzer II (10 p.s.i., 200 ms; Parker). Injections were monitored by co-loading pipettes with Texas Red (1 %; Fig. S1). Concentrations were based on initial experiments and reports (Westerink and De Vries, 2001; Gurden et al., 2006) that effective concentrations are 100–1000 fold reduced in the brain in vivo. The concentrations of baclofen (McGann et al., 2005), APV (Wang et al., 2006), CNQX (Takano et al., 2006), MCPG (Gurden et al., 2006), MPEP (Takano et al., 2006), TBOA (Gurden et al., 2006), dihydrokainate (Dawson et al., 2000), and SC-560 (Takano et al., 2006) correspond to those used in other in vivo studies. Acetazolamide (Sigma) was applied systemically by tail vein injection.
Multiphoton imaging
A custom-built two-photon microscope (Tsai et al., 2002) was used for in vivo imaging. Plasma was labeled with Texas Red dextran 70 kDa (5 % in saline, Invitrogen) or FITC dextran 100 kDa (Sigma). Fluorophores were excited and imaged with a water immersion objective (20x, 0.95 NA, Olympus) at 910 nm using a Ti:Sapphire laser (8 W, Coherent) with 150 fs pulse width and 76 MHz repetition rate. Image acquisition and scanning were controlled by custom-written software in Labview. Velocity and flux were determined by serial line scans. Cross-sectional area was determined semi-automatically from binarized image sequences using ImageJ (W. Rasband, National Institutes of Health). Radius, calculated from cross-sectional area, was used to determine relative changes in flow according to Poiseuille’s law (assuming constant pressure drop, viscosity and length during the imaging period). Baseline CBF parameters in glomerular capillaries were obtained during the presentation of pure air preceding a stimulus. Vascular reactivity was tested after injection of acetazolamide at intervals of 1 min for 20 min.
Wide-field imaging and electrophysiology
Glomeruli were visualized using a custom-built imaging device (Albeanu et al., in press) using blue light (LED arrays, 470 nm, Philips Lumiled). The emitted light was filtered with a 505 nm long pass filter and recorded with a CCD camera (CCD-1300, Vosskühler) at 4 Hz. For nerve layer recordings, glass electrodes were pulled (P-97, Sutter, 1–2 μm tip) and filled with saline and Alexa 488 (20 μM; Invitrogen). Electrodes were placed perpendicularly to the surface in glomeruli using a micromanipulator (MP-225, Sutter). Signals were filtered at 0.1–10 kHz and recorded with Spike2 software (CED).
Calcium dye loading
X-Rhod-1 AM (Invitrogen) was solubilized in 20 % Pluronic F-127 in DMSO (Invitrogen) to 10 mM, sonicated and diluted in aCSF to 1 mM. The mixture was filtered, loaded into glass pipettes (3–6 μm tip) and injected using a Picospritzer II (5-7 p.s.i., 30–60 s). For M/T cell labeling, X-Rhod-1 AM (2 mM) was injected into the M/T cell layer at lower pressure (2-3 p.s.i., 10 min). This technique resulted in sparse labeling of M/T cell bodies and apical dendrites. For perivascular astrocyte labeling, X-Rhod-1 AM (2 mM) was applied topically after dura removal for 70 min.
Immunohistochemistry
Mice were anesthetized with ketamine (100 mg/kg i.p.; Webster) and xylazine (10 mg/kg i.p.; Webster) and transcardially perfused with 4 % paraformaldehyde. Sagittal sections from the olfactory bulb (60 μm) were taken with a vibratome (Leica). They were permeabilized and blocked in 0.3 % Triton-X100 (Fisher) and 10 % horse serum for 1 h, and incubated with primary antibodies against GFAP (rabbit, 1:1000; Z0334, Dako), laminin B2/γ1 (rat, 1:1000, RT-795, Lab Vision), aquaporin-4 (rabbit, 1:200; AB3068, Chemicon), COX1 (mouse, 1:200; 160110, Cayman), COX2 (rabbit, 1:200; 160116, Cayman), or NeuN (mouse, 1:200; MAB377, Millipore) in 5 % horse serum and 0.05 % Triton-X100 at 4 °C for 24 h. Secondary antibodies (Alexa 568-conjugated goat anti-rabbit or goat anti-mouse, Alexa 647-conjugated goat anti-rat, 1:250; Invitrogen) were applied for 3 h at room temperature. Cell nuclei were stained with Hoechst 33258 (1:1000, Invitrogen). Sections were imaged with aconfocal microscope (Zeiss).
Data analysis
Raw spH fluorescence traces were corrected for photobleaching, assuming a single exponential decay. Raw Ca2+ indicator traces were corrected by subtracting trials with pure air presentation. Erythrocyte velocity was determined from the slope of the bands (Fig. 2F) by an automated routine in Matlab (Mathworks) provided to us by Dr. C. B. Schaffer (Cornell University) (Schaffer et al., 2006). Flux was calculated by binarizing and counting line scan bands with ImageJ. Maximal changes were calculated as the ratio of maximal value to mean value obtained during air presentation. Data are expressed as mean ± s.e.m. P < 0.05 was accepted as statistically significant.
Supplementary Material
Acknowledgments
We thank Nozomi Nishimura and Chris B. Schaffer (Cornell University) for the velocity calculation routine. We also thank David Kleinfeld (UCSD) and Florian Engert (Harvard University) for help with the design of the multiphoton microscope. This work was supported by funds from Harvard University (V.N.M.), Pew Scholars Program (V.N.M.), German Science Foundation DFG (G.C.P., Pe 1193/1-1) and Marie Curie Fellowship Program of the European Union (G.C.P.).
References
- Albeanu DF, Soucy E, Sato TF, Meister M, Murthy VN. LED Arrays as Cost Effective and Efficient Light Sources for Widefield Microscopy. PLoS One. doi: 10.1371/journal.pone.0002146. (in press) [DOI] [PMC free article] [PubMed] [Google Scholar]
- Aroniadou-Anderjaska V, Ennis M, Shipley MT. Glomerular synaptic responses to olfactory nerve input in rat olfactory bulb slices. Neuroscience. 1997;79:425–434. doi: 10.1016/s0306-4522(96)00706-3. [DOI] [PubMed] [Google Scholar]
- Attwell D, Laughlin SB. An energy budget for signaling in the grey matter of the brain. J Cereb Blood Flow Metab. 2001;21:1133–1145. doi: 10.1097/00004647-200110000-00001. [DOI] [PubMed] [Google Scholar]
- Bernardinelli Y, Magistretti PJ, Chatton JY. Astrocytes generate Na+-mediated metabolic waves. Proc Natl Acad Sci U S A. 2004;101:14937–14942. doi: 10.1073/pnas.0405315101. [DOI] [PMC free article] [PubMed] [Google Scholar]
- Bozza T, McGann JP, Mombaerts P, Wachowiak M. In vivo imaging of neuronal activity by targeted expression of a genetically encoded probe in the mouse. Neuron. 2004;42:9–21. doi: 10.1016/s0896-6273(04)00144-8. [DOI] [PubMed] [Google Scholar]
- Brenneis C, Maier TJ, Schmidt R, Hofacker A, Zulauf L, Jakobsson PJ, Scholich K, Geisslinger G. Inhibition of prostaglandin E2 synthesis by SC-560 is independent of cyclooxygenase 1 inhibition. FASEB J. 2006;20:1352–1360. doi: 10.1096/fj.05-5346com. [DOI] [PubMed] [Google Scholar]
- Brickley SG, Farrant M, Swanson GT, Cull-Candy SG. CNQX increases GABA-mediated synaptic transmission in the cerebellum by an AMPA/kainate receptor-independent mechanism. Neuropharmacology. 2001;41:730–736. doi: 10.1016/s0028-3908(01)00135-6. [DOI] [PubMed] [Google Scholar]
- Chaigneau E, Oheim M, Audinat E, Charpak S. Two-photon imaging of capillary blood flow in olfactory bulb glomeruli. Proc Natl Acad Sci U S A. 2003;100:13081–13086. doi: 10.1073/pnas.2133652100. [DOI] [PMC free article] [PubMed] [Google Scholar]
- Chaigneau E, Tiret P, Lecoq J, Ducros M, Knopfel T, Charpak S. The relationship between blood flow and neuronal activity in the rodent olfactory bulb. J Neurosci. 2007;27:6452–6460. doi: 10.1523/JNEUROSCI.3141-06.2007. [DOI] [PMC free article] [PubMed] [Google Scholar]
- Dawson LA, Djali S, Gonzales C, Vinegra MA, Zaleska MM. Characterization of transient focal ischemia-induced increases in extracellular glutamate and aspartate in spontaneously hypertensive rats. Brain Res Bull. 2000;53:767–776. doi: 10.1016/s0361-9230(00)00363-4. [DOI] [PubMed] [Google Scholar]
- De Saint Jan D, Westbrook GL. Detecting activity in olfactory bulb glomeruli with astrocyte recording. J Neurosci. 2005;25:2917–2924. doi: 10.1523/JNEUROSCI.5042-04.2005. [DOI] [PMC free article] [PubMed] [Google Scholar]
- Dirnagl U, Villringer A, Einhaupl KM. In-vivo confocal scanning laser microscopy of the cerebral microcirculation. J Microsc. 1992;165:147–157. doi: 10.1111/j.1365-2818.1992.tb04312.x. [DOI] [PubMed] [Google Scholar]
- Ennis M, Zhu M, Heinbockel T, Hayar A. Olfactory nerve-evoked, metabotropic glutamate receptor-mediated synaptic responses in rat olfactory bulb mitral cells. J Neurophysiol. 2006;95:2233–2241. doi: 10.1152/jn.01150.2005. [DOI] [PMC free article] [PubMed] [Google Scholar]
- Filosa JA, Bonev AD, Nelson MT. Calcium dynamics in cortical astrocytes and arterioles during neurovascular coupling. Circ Res. 2004;95:e73–81. doi: 10.1161/01.RES.0000148636.60732.2e. [DOI] [PubMed] [Google Scholar]
- Gsell W, Burke M, Wiedermann D, Bonvento G, Silva AC, Dauphin F, Buhrle C, Hoehn M, Schwindt W. Differential effects of NMDA and AMPA glutamate receptors on functional magnetic resonance imaging signals and evoked neuronal activity during forepaw stimulation of the rat. J Neurosci. 2006;26:8409–8416. doi: 10.1523/JNEUROSCI.4615-05.2006. [DOI] [PMC free article] [PubMed] [Google Scholar]
- Gurden H, Uchida N, Mainen ZF. Sensory-evoked intrinsic optical signals in the olfactory bulb are coupled to glutamate release and uptake. Neuron. 2006;52:335–345. doi: 10.1016/j.neuron.2006.07.022. [DOI] [PubMed] [Google Scholar]
- Hirase H, Qian L, Bartho P, Buzsaki G. Calcium dynamics of cortical astrocytic networks in vivo. PLoS Biol. 2004;2:E96. doi: 10.1371/journal.pbio.0020096. [DOI] [PMC free article] [PubMed] [Google Scholar]
- Iadecola C, Nedergaard M. Glial regulation of the cerebral microvasculature. Nat Neurosci. 2007;10:1369–1376. doi: 10.1038/nn2003. [DOI] [PubMed] [Google Scholar]
- Kida I, Xu F, Shulman RG, Hyder F. Mapping at glomerular resolution: fMRI of rat olfactory bulb. Magn Reson Med. 2002;48:570–576. doi: 10.1002/mrm.10248. [DOI] [PubMed] [Google Scholar]
- Kleinfeld D, Mitra PP, Helmchen F, Denk W. Fluctuations and stimulus-induced changes in blood flow observed in individual capillaries in layers 2 through 4 of rat neocortex. Proc Natl Acad Sci U S A. 1998;95:15741–15746. doi: 10.1073/pnas.95.26.15741. [DOI] [PMC free article] [PubMed] [Google Scholar]
- Lancet D, Greer CA, Kauer JS, Shepherd GM. Mapping of odor-related neuronal activity in the olfactory bulb by high-resolution 2-deoxyglucose autoradiography. Proc Natl Acad Sci U S A. 1982;79:670–674. doi: 10.1073/pnas.79.2.670. [DOI] [PMC free article] [PubMed] [Google Scholar]
- Lauritzen M. Reading vascular changes in brain imaging: is dendritic calcium the key? Nat Rev Neurosci. 2005;6:77–85. doi: 10.1038/nrn1589. [DOI] [PubMed] [Google Scholar]
- Logothetis NK, Wandell BA. Interpreting the BOLD signal. Annu Rev Physiol. 2004;66:735–769. doi: 10.1146/annurev.physiol.66.082602.092845. [DOI] [PubMed] [Google Scholar]
- Marcaggi P, Attwell D. Role of glial amino acid transporters in synaptic transmission and brain energetics. Glia. 2004;47:217–225. doi: 10.1002/glia.20027. [DOI] [PubMed] [Google Scholar]
- McGann JP, Pirez N, Gainey MA, Muratore C, Elias AS, Wachowiak M. Odorant representations are modulated by intra- but not interglomerular presynaptic inhibition of olfactory sensory neurons. Neuron. 2005;48:1039–1053. doi: 10.1016/j.neuron.2005.10.031. [DOI] [PubMed] [Google Scholar]
- Meister M, Bonhoeffer T. Tuning and topography in an odor map on the rat olfactory bulb. J Neurosci. 2001;21:1351–1360. [Google Scholar]
- Miesenböck G, De Angelis DA, Rothman JE. Visualizing secretion and synaptic transmission with pH-sensitive green fluorescent proteins. Nature. 1998;394:192–195. doi: 10.1038/28190. [DOI] [PubMed] [Google Scholar]
- Mombaerts P, Wang F, Dulac C, Chao SK, Nemes A, Mendelsohn M, Edmondson J, Axel R. Visualizing an olfactory sensory map. Cell. 1996;87:675–686. doi: 10.1016/s0092-8674(00)81387-2. [DOI] [PubMed] [Google Scholar]
- Mukamel R, Gelbard H, Arieli A, Hasson U, Fried I, Malach R. Coupling between neuronal firing, field potentials, and FMRI in human auditory cortex. Science. 2005;309:951–954. doi: 10.1126/science.1110913. [DOI] [PubMed] [Google Scholar]
- Mulligan SJ, MacVicar BA. Calcium transients in astrocyte endfeet cause cerebrovascular constrictions. Nature. 2004;431:195–199. doi: 10.1038/nature02827. [DOI] [PubMed] [Google Scholar]
- Nawroth JC, Greer CA, Chen WR, Laughlin SB, Shepherd GM. An energy budget for the olfactory glomerulus. J Neurosci. 2007;27:9790–9800. doi: 10.1523/JNEUROSCI.1415-07.2007. [DOI] [PMC free article] [PubMed] [Google Scholar]
- Niwa K, Araki E, Morham SG, Ross ME, Iadecola C. Cyclooxygenase-2 contributes to functional hyperemia in whisker-barrel cortex. J Neurosci. 2000;20:763–770. doi: 10.1523/JNEUROSCI.20-02-00763.2000. [DOI] [PMC free article] [PubMed] [Google Scholar]
- Niwa K, Haensel C, Ross ME, Iadecola C. Cyclooxygenase-1 participates in selected vasodilator responses of the cerebral circulation. Circ Res. 2001;88:600–608. doi: 10.1161/01.res.88.6.600. [DOI] [PubMed] [Google Scholar]
- Offenhauser N, Thomsen K, Caesar K, Lauritzen M. Activity-induced tissue oxygenation changes in rat cerebellar cortex: interplay of postsynaptic activation and blood flow. J Physiol. 2005;565:279–294. doi: 10.1113/jphysiol.2005.082776. [DOI] [PMC free article] [PubMed] [Google Scholar]
- Raichle ME, Mintun MA. Brain work and brain imaging. Annu Rev Neurosci. 2006;29:449–476. doi: 10.1146/annurev.neuro.29.051605.112819. [DOI] [PubMed] [Google Scholar]
- Rees G, Friston K, Koch C. A direct quantitative relationship between the functional properties of human and macaque V5. Nat Neurosci. 2000;3:716–723. doi: 10.1038/76673. [DOI] [PubMed] [Google Scholar]
- Schaffer CB, Friedman B, Nishimura N, Schroeder LF, Tsai PS, Ebner FF, Lyden PD, Kleinfeld D. Two-Photon Imaging of Cortical Surface Microvessels Reveals a Robust Redistribution in Blood Flow after Vascular Occlusion. PLoS Biol. 2006;4:e22. doi: 10.1371/journal.pbio.0040022. [DOI] [PMC free article] [PubMed] [Google Scholar]
- Simard M, Arcuino G, Takano T, Liu QS, Nedergaard M. Signaling at the gliovascular interface. J Neurosci. 2003;23:9254–9262. doi: 10.1523/JNEUROSCI.23-27-09254.2003. [DOI] [PMC free article] [PubMed] [Google Scholar]
- Stosiek C, Garaschuk O, Holthoff K, Konnerth A. In vivo two-photon calcium imaging of neuronal networks. Proc Natl Acad Sci U S A. 2003;100:7319–7324. doi: 10.1073/pnas.1232232100. [DOI] [PMC free article] [PubMed] [Google Scholar]
- Takano T, Tian GF, Peng W, Lou N, Libionka W, Han X, Nedergaard M. Astrocyte-mediated control of cerebral blood flow. Nat Neurosci. 2006;9:260–267. doi: 10.1038/nn1623. [DOI] [PubMed] [Google Scholar]
- Tsai PS, Nishimura N, Yoder EJ, White A, Dolnick E, Kleinfeld D. Principles, design and construction of a two photon scanning microscope for in vitro and in vivo studies. In: Frostig R, editor. Methods for In Vivo Optical Imaging. Boca Raton: CRC Press; 2002. pp. 113–171. [Google Scholar]
- Utsumi M, Ohno K, Onchi H, Sato K, Tohyama M. Differential expression patterns of three glutamate transporters (GLAST, GLT1 and EAAC1) in the rat main olfactory bulb. Brain Res Mol Brain Res. 2001;92:1–11. doi: 10.1016/s0169-328x(01)00098-5. [DOI] [PubMed] [Google Scholar]
- van den Pol AN. Presynaptic metabotropic glutamate receptors in adult and developing neurons: autoexcitation in the olfactory bulb. J Comp Neurol. 1995;359:253–271. doi: 10.1002/cne.903590206. [DOI] [PubMed] [Google Scholar]
- Vlassenko AG, Rundle MM, Raichle ME, Mintun MA. Regulation of blood flow in activated human brain by cytosolic NADH/NAD+ ratio. Proc Natl Acad Sci U S A. 2006;103:1964–1969. doi: 10.1073/pnas.0510632103. [DOI] [PMC free article] [PubMed] [Google Scholar]
- Voutsinos-Porche B, Bonvento G, Tanaka K, Steiner P, Welker E, Chatton JY, Magistretti PJ, Pellerin L. Glial glutamate transporters mediate a functional metabolic crosstalk between neurons and astrocytes in the mouse developing cortex. Neuron. 2003;37:275–286. doi: 10.1016/s0896-6273(02)01170-4. [DOI] [PubMed] [Google Scholar]
- Wachowiak M, McGann JP, Heyward PM, Shao Z, Puche AC, Shipley MT. Inhibition of olfactory receptor neuron input to olfactory bulb glomeruli mediated by suppression of presynaptic calcium influx. J Neurophysiol. 2005;94:2700–2712. doi: 10.1152/jn.00286.2005. [DOI] [PMC free article] [PubMed] [Google Scholar]
- Wang X, Lou N, Xu Q, Tian GF, Peng WG, Han X, Kang J, Takano T, Nedergaard M. Astrocytic Ca(2+) signaling evoked by sensory stimulation in vivo. Nat Neurosci. 2006;9:816–823. doi: 10.1038/nn1703. [DOI] [PubMed] [Google Scholar]
- Westerink BH, De Vries JB. A method to evaluate the diffusion rate of drugs from a microdialysis probe through brain tissue. J Neurosci Methods. 2001;109:53–58. doi: 10.1016/s0165-0270(01)00401-0. [DOI] [PubMed] [Google Scholar]
- Yang G, Iadecola C. Glutamate microinjections in cerebellar cortex reproduce cerebrovascular effects of parallel fiber stimulation. Am J Physiol. 1996;271:R1568–1575. doi: 10.1152/ajpregu.1996.271.6.R1568. [DOI] [PubMed] [Google Scholar]
- Zonta M, Angulo MC, Gobbo S, Rosengarten B, Hossmann KA, Pozzan T, Carmignoto G. Neuron-to-astrocyte signaling is central to the dynamic control of brain microcirculation. Nat Neurosci. 2003a;6:43–50. doi: 10.1038/nn980. [DOI] [PubMed] [Google Scholar]
- Zonta M, Sebelin A, Gobbo S, Fellin T, Pozzan T, Carmignoto G. Glutamate-mediated cytosolic calcium oscillations regulate a pulsatile prostaglandin release from cultured rat astrocytes. J Physiol. 2003b;553:407–414. doi: 10.1113/jphysiol.2003.046706. [DOI] [PMC free article] [PubMed] [Google Scholar]
Associated Data
This section collects any data citations, data availability statements, or supplementary materials included in this article.