High fat diet enhances stemness and tumorigenicity of intestinal progenitors (original) (raw)
. Author manuscript; available in PMC: 2016 Sep 3.
Published in final edited form as: Nature. 2016 Mar 3;531(7592):53–58. doi: 10.1038/nature17173
Abstract
Little is known about how pro-obesity diets regulate tissue stem and progenitor cell function. Here we find that high fat diet (HFD)-induced obesity augments the numbers and function of Lgr5+ intestinal stem-cells (ISCs) of the mammalian intestine. Mechanistically, HFD induces a robust peroxisome proliferator-activated receptor delta (PPAR-d) signature in intestinal stem and (non-ISC) progenitor cells, and pharmacologic activation of PPAR-d recapitulates the effects of a HFD on these cells. Like a HFD, ex vivo treatment of intestinal organoid cultures with fatty acid constituents of the HFD enhances the self-renewal potential of these organoid bodies in a PPAR-d dependent manner. Interestingly, HFD- and agonist-activated PPAR-d signaling endow organoid-initiating capacity to progenitors, and enforced PPAR-d signaling permits these progenitors to form in vivo tumors upon loss of the tumor suppressor Apc. These findings highlight how diet-modulated PPAR-d activation alters not only the function of intestinal stem and progenitor cells, but also their capacity to initiate tumors.
The mammalian intestine is known to respond to dietary signals1. Lgr5+ intestinal stem-cells (ISCs) remodel intestinal composition in response to diet-induced cues by adjusting their production of daughter stem-cells and (non-ISC, transit-amplifying cells) progenitor cells, the latter of which differentiate into the diverse cell-types of the intestine1–3. The Lgr5+ ISCs reside at the base of intestinal crypts adjacent to Paneth cells, which are a central component of the ISC niche and regulate stem cell biology in response to calorie-restricted diets1,4.
Although significant epidemiologic and rodent studies link obesity to colon cancer incidence3,5–7, little is known about how the adaptation of stem and progenitor cells to pro-obesity diets alters the potential of these cells to initiate tumors3. In the mouse intestine, Lgr5+ ISCs serve as the cell-of-origin for the precancerous adenomatous lesions caused by loss of the Apc tumor suppressor gene; yet, it is unclear whether this occurs in the context of obesity-linked intestinal tumorigenesis8,9. Here, we interrogate how long-term high fat diet (HFD)-induced obesity influences intestinal stem and progenitor cell function and the cellular origins of intestinal dysplasia.
HFD boosts ISC counts and crypt function
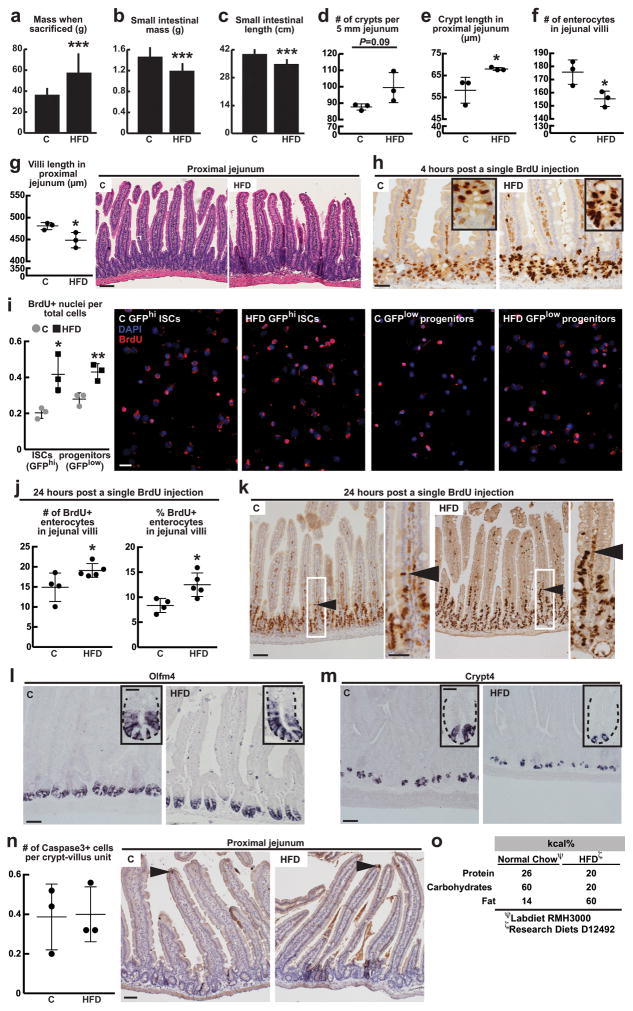
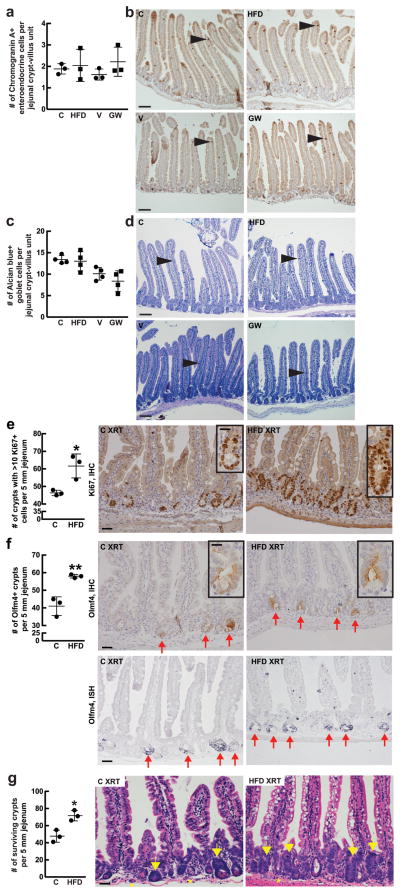
To assess the effects of obesity on intestinal homeostasis, we maintained mice on a long-term HFD (60% fat diet; Extended Data 1o) for 9–14 months, which is sufficient to observe many of the metabolic phenotypes associated with obesity10,11. Consistent with previous reports, HFD-fed mice gained considerably more mass than their standard chow-fed counterparts (Extended Data 1a). While the small intestines from HFD-fed mice were shorter in length (Extended Data 1c) and weighed less (Extended Data 1b), there was no change in the density of crypt-villous units (Extended Data 1d) or in the number of apoptotic cells (Extended Data 1n). Morphologically, HFD led to a mild reduction in villi length (Extended Data 1g), an associated decrease in villous enterocyte numbers (Extended Data 1f), and an increase in crypt depth (Extended Data 1e). A HFD did not change the numbers of chromogranin A+ enteroendocrine cells or Alcian blue+ goblet cells per crypt-villus unit of the small intestine (Extended Data 2a–d).
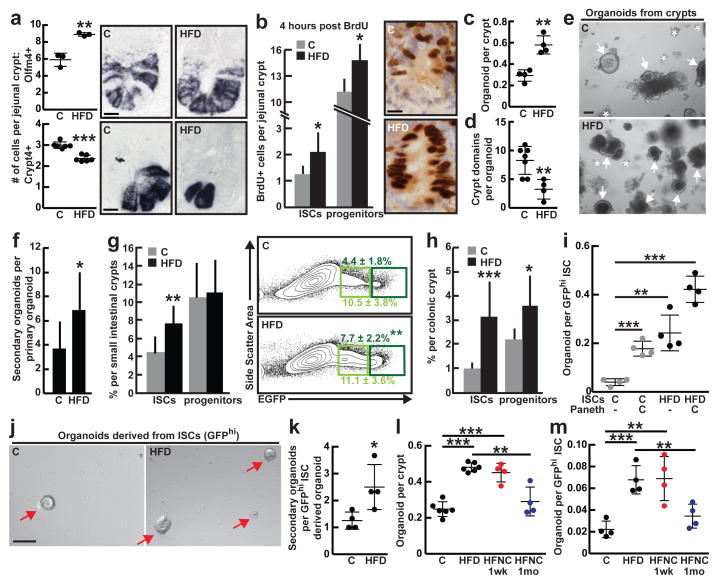
To address how HFD affects the frequency of intestinal stem-cells, we performed in situ hybridization for olfactomedin 4 (Olfm4), a marker expressed by the Lgr5+ ISCs12. Compared to mice fed a regular chow diet, those on a HFD had a 50% increase in the number of Olfm4+ ISCs (Fig. 1a, Extended Data 1l). In contrast, a HFD reduced Cryptdin 4+ niche Paneth cell numbers by 23% (Fig. 1a, Extended Data 1m). These observations lead to two conclusions: first, HFD enhances ISCs numbers and self-renewal (e.g. deeper crypts with more Olfm4+ ISCs) at the expense of differentiation (e.g. shorter and less cellular villi); and, second, the increase in ISCs occurs despite a reduction in Paneth cell numbers, raising the possibility that under a HFD ISCs adjust to fewer interactions from their Paneth cell niche.
Figure 1. High Fat Diet augments ISC numbers and function.
a, Quantification of Olfm4+ ISCs (_n_=3) and Crypt4+ Paneth cells (_n_=6) in the proximal jejunum of C and HFD mice by in situ hybridization.
b, BrdU incorporation in ISCs (crypt base columnar cells) and progenitors (transit-amplifying cells) after a 4-hour pulse (_n_=6).
c, d, e, Organoid per crypt (c, _n_=4) and crypt domain (d, _n_=7) quantification from C and HFD mice (d, _n=_4). Representative images: Day 7 organoids (e). Arrows: organoids. Asterisks: aborted crypts.
f, Number of secondary organoids per dissociated crypt-derived primary organoid (_n_=9 primary organoids, 3 primary organoids per sample were individually subcloned in 3 independent experiments).
g, h Frequencies of ISCs (Lgr5-GFPhi, dark green) and progenitors (Lgr5-GFPlow, light green) in the entire small intestine (g, _n=_10) and colon (h, _n_=8) as measured by flow cytometry.
i, j, Organoid-initiating capacity of C and HFD ISCs cultured +/− Paneth cells (i, _n_=4). Representative images: Day 5 primary organoids (arrows, j).
k, Number of secondary organoids per dissociated ISC-derived primary organoid (_n_=4).
l, m, Crypts (l) and ISCs (m) isolated from HFD mice that were reverted to a standard chow diet (HFNC) retained augmented organoid-forming capacity for one week (red; _n_=4) but not for one month (blue; _n_=4) when compared to their HFD counterparts (_n_=6 crypts, _n_=4 ISCs).
(Unless otherwise indicated, data reflect mean ± s.d. from n independent experiments; *P<0.05, **P<0.01, ***P<0.001; scale bars in a,b=20μm, e,j=100μm; histological analysis: a, Olfm4: 10 crypts/group, Crypt4: 50 crypts/group; b, 50 crypts/group in each experiment. ISCs= intestinal stem cells; _Olfm4_= _Olfactomedin 4; Crypt4_= Cryptdin 4; C= control; HFD= high fat diet)
Given that ISC numbers and proliferation (Fig. 1b, Extended Data 1h–k, 3f, See Supplementary Information) increase in a HFD, we asked whether a HFD also boosts intestinal regeneration. Using an in vitro approach, we assessed the ability of isolated intestinal crypts to form organoid bodies in 3-D culture. These organoids recapitulate the epithelial architecture and cellular diversity of the mammalian intestine and are a proxy for ISC activity, as only stem-cells can initiate and maintain these structures long-term1,13. HFD-derived crypts from the small intestine and colon were more likely to initiate mini-intestines in culture than those from controls (Fig. 1c, e, Extended Data 3j). Furthermore, these organoids were more cystic (i.e. less differentiated14) in structure and contained fewer crypt domains (Fig. 1d). When sub-cloned, HFD-derived primary organoids generated more secondary organoids (Fig. 1f, Extended Data 3k). Consistent with these findings, HFD crypt-derived organoids had higher frequencies of Lgr5+ ISCs compared to controls (Extended Data 4a, d, e) and possessed diverse intestinal cell types, such as Paneth cells, ISCs, enteroendocrine cells and goblet cells (Extended Data 4b–f).
To determine whether HFD also augments crypt regeneration in vivo, we performed a clonogenic microcolony assay to test for ISC activity1,15. After administration of a lethal dose of irradiation, HFD-fed mice manifested increased numbers of surviving, proliferating crypts (Ki67+ cells/crypt) that possessed more Olfm4+ ISCs per unit length of intestine relative to controls (Extended Data 2e–g). These data support the notion that a HFD boosts the numbers and regenerative capacity of ISCs in vitro and in vivo.
HFD reduces the niche dependence of ISCs
To assess the effects of a HFD on ISCs and progenitors, we utilized Lgr5-EGFP-IRES-CreERT2 knock-in mice for the quantification and isolation of Lgr5-GFPhi stem and Lgr5-GFPlow progenitor cells2. Compared to controls, mice on a HFD had an increased frequency of Lgr5-GFPhi ISCs in the small intestine (Fig. 1g) and colon (Fig. 1h, Extended Data 3g).
The opposing effects of HFD on ISC and Paneth cell numbers led us to ask whether HFD alters ISC function and niche dependence. We assayed the clonogenic potential of ISCs from control and HFD-fed mice either alone or in combination with the niche Paneth cells1. Consistent with earlier studies1,4,13, control ISCs by themselves inefficiently formed organoids, but robustly formed organoids when co-cultured with Paneth cells (Fig. 1i). Surprisingly, HFD-derived ISCs by themselves (i.e. without Paneth cells) had an increased capacity to initiate organoids with multilineage differentiation and more secondary organoids compared to control ISCs. (Fig. 1i–k, Extended Data 4h, i, l, m). Co-culture with Paneth cells further increased the organoid-initiating activity of HFD ISCs (Fig. 1i). Organoids derived from control and HFD ISCs alone effectively produced Paneth cells within 24 hours of culture (Extended Data 4j, k). Also, crypts and ISCs isolated from mice that had been on a HFD, but were returned to a standard chow diet, retained an enhanced capacity to initiate organoids for more than 7 days but less than 4 weeks, indicating that the effects of a HFD are reversible (Fig. 1l, m). These data, together with the observation that HFD uncouples the in vivo expansion of ISCs from their Paneth cell niche, suggest ISCs undergo autonomous changes in response to a HFD that poises them for niche-independent growth in the organoid assay.
Fatty acids drive organoid self-renewal
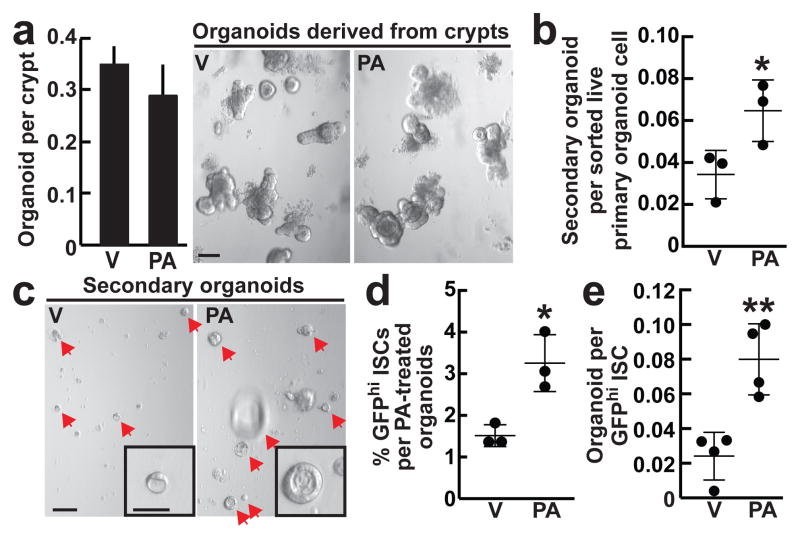
To address whether dietary constituents of the HFD can recapitulate aspects of the HFD-evoked stem-cell phenotype, we expanded control organoids in crypt media supplemented with palmitic acid (PA), a main component of the HFD16. Treatment with PA did not alter the clonogenic potential of control crypts in primary culture (Fig. 2a). However, as observed with organoids from HFD mice, primary organoids exposed ex vivo to PA gave rise to more secondary organoids compared to controls (Fig. 2b, c, Extended Data 5a). Consistent with these findings, organoids treated with PA possessed nearly 2-fold more Lgr5+ ISCs (Fig. 2d, Extended Data 5b) and manifested reduced niche dependence in the organoid assay (Fig. 2e). Similar results were obtained with other fatty acids such as oleic acid and a lipid mixture in mouse and human intestinal organoids (Fig 3h–k, Extended Data 5c–f). These findings indicate that key dietary constituents of HFD are sufficient to recapitulate aspects of the in vivo HFD stem-cell phenotype.
Figure 2. Ex vivo exposure of intestinal organoids to palmitic acid recapitulates aspects of a HFD.
a, Clonogenicity of naïve crypts cultured with 30μM PA in primary organoid cultures (_n_=5). Representative images: Day 4 organoids.
b, c, Secondary organoid formation of one thousand sorted live primary organoid cells after four weeks of 30μM PA treatment (b, _n=_3). Representative images: Day 4 secondary organoids (arrows, c).
d, e, Frequency (d) and organoid initiation (e) of ISCs (Lgr5-GFPhi) after four weeks of 30μM PA exposure (d, _n_=3; e, n=4).
(Unless otherwise indicated, data reflect mean ± s.d. from n independent experiments; *P<0.05, **P<0.01; scale bars in a=100μm, c=100μm, 50μm (inset). ISCs= intestinal stem cells; V= vehicle; PA= palmitic acid)
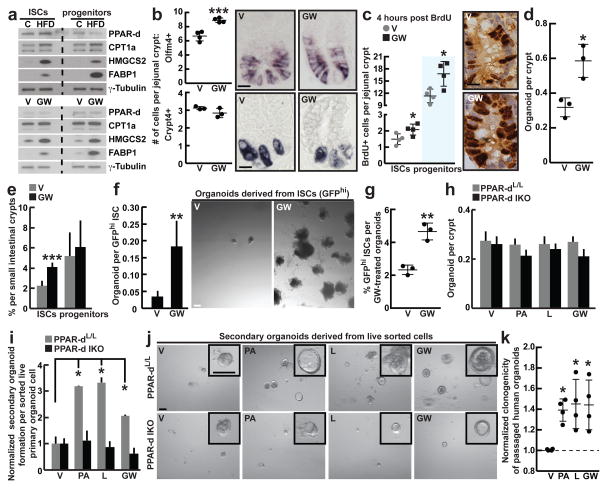
Figure 3. Activated PPAR-d in ISCs mediates the effects of a HFD.
a, Immunoblots of PPAR-d target proteins in flow sorted ISCs (Lgr5-GFPhi) and progenitors (Lgr5-GFPlow) from C, HFD, V, and GW mice(_n_=2).
b, Quantification of Olfm4+ ISCs (_n_=4) and Crypt4+ Paneth cells (_n_=3) by in situ hybridization in proximal jejunal crypts.
c, BrdU incorporation in ISCs (crypt base columnar cells adjacent to Paneth cells) and progenitors (transit-amplifying cells not adjacent to Paneth cells) after a 4-hour pulse (_n_=4).
d, Organoid per crypt from V and GW-treated mice (_n_=3).
e, Frequencies of flow sorted ISCs (Lgr5-GFPhi) and progenitors (Lgr5-GFPlow) (_n_=5) from the entire small intestine of V and GW-treated mice.
f, Organoid-initiating capacity of ISCs derived from V and GW-treated mice. Representative images: Day 12 organoids (_n_=5).
g, Frequency of ISCs (Lgr5-GFPhi) in organoids after 14 days of ex vivo GW exposure (_n=_3).
h, i, j, Primary (h, _n_=5) and secondary (i, j, _n_=5; normalized to V) organoid-forming capacity of control and PPAR-d intestinal knockout (IKO) mice upon ex vivo treatment with V, PA, L, and GW. Representative images: Day 4 secondary organoids (j).
k, Normalized clonogenicity of human-derived intestinal organoids after ex vivo treatment with PA, L, and GW in secondary culture (_n=_4, See Materials and Methods).
(Unless otherwise indicated, data reflect mean ± s.d. from n independent experiments; *P<0.05, **P<0.01, ***P<0.001; scale bars in b,d=20μm, f=200μm, j=100μm; histological analysis: b, Olfm4: 15 crypts/group, Crypt4: 50 crypts/group; c, 50 crypts/group in each experiment. For western blot source data, see Supplementary Figure 1. ISCs= intestinal stem cells; _Olfm4_= _Olfactomedin 4; Crypt4_= Cryptdin 4; C= control; HFD= high fat diet; V= vehicle; GW= PPAR-d agonist, GW501516; PA= palmitic acid; L= lipid mixture)
HFD acts through PPAR-d in ISCs
To gain mechanistic insight into how HFD mediates these effects, we performed mRNA-sequencing on isolated Lgr5-GFPhi ISCs and Lgr5-GFPlow progenitor cells from control and HFD-fed mice, respectively (Extended Data 6p). GSEA pathway and transcription factor binding motif analyses revealed enrichment for transcriptional targets and binding motifs of the nuclear receptor PPAR (peroxisome proliferator-activated receptor) family and PPAR heterodimeric binding partners liver/retinoid X receptor (LXR/RXR; Extended Data 6c, d)17–19. Three members (alpha, delta, and gamma) comprise the PPAR family17; amongst these PPAR-delta (PPAR-d) is the predominant one expressed in intestinal stem and progenitor cells at the mRNA level in control and HFD mice (Extended Data 6a, b). Therefore, we focused our attention on PPAR-d and its potential role in coupling a HFD to ISC function.
Although PPAR-d expression itself did not substantially increase (Extended Data 6a, b), the HFD robustly induced expression of many of its target genes at the mRNA levels in both small intestine (Extended Data 6e) and colon (Extended Data 3h). The induction of the PPAR-d program was verified at the protein level in ISCs and progenitors (Fig. 3a). To address functionally whether engagement of a PPAR-d program mimics the HFD, we administered the PPAR-d agonist GW501516 (GW) for 4 weeks to Lgr5-EGFP-IRES-CreERT2 mice20,21. Treatment led to strong induction of PPAR-d target proteins in ISCs and progenitors (Fig. 3a). Furthermore, agonist-activated PPAR-d signaling augmented the in vivo frequencies of Olfm4+ and Lgr5+ ISCs (Fig. 3b, e, Extended Data 6f) and proliferation of stem and progenitors cells (Fig. 3c) but had no impact on Paneth cell numbers (Fig. 3b, Extended Data 6g). Notably, small intestinal (Fig. 3d) and colonic (Extended Data 3l, m) crypts from agonist-treated mice initiated more organoids than those from vehicle-treated mice. Similar to ISCs from HFD mice, ISCs derived from agonist-treated mice were more effective at Paneth cell-independent organoid-initiation than their control counterparts (Fig. 3f). In addition, organoids exposed to the PPAR-d agonist had more Lgr5+ ISCs (Fig. 3g) and more self-renewing capacity in secondary assays (Fig. 3i). These data indicate that sustained PPAR-d signaling largely recapitulates the effects of a HFD on ISC function.
Because ex vivo fatty acids mimic aspects of a HFD, we asked whether this phenomenon occurs through PPAR-d signaling. Like HFD, we observed that ex vivo exposure of mouse and human organoids to fatty acids evokes a robust PPAR-d program (Extended Data 5g–j, 6h). To assess the necessity of PPAR-d in this response to fatty acids, we generated tamoxifen-inducible, intestine-specific Ppard conditional mice (Ppard IKO, Extended Data 6i, j). Acute ablation of Ppard in the intestine had no noticeable effects on the numbers, proliferation, or function of ISCs and progenitor cells (Fig. 3h, Extended Data 6i–n). However, loss of Ppard blocked the self-renewal enhancing effects of fatty acids and PPAR-d agonist in secondary assays (Fig. 3i, j) as well as the induction of PPAR-d target gene expression in secondary organoid assays (Extended Data 6o). These findings demonstrate that PPAR-d mediates fatty acid-driven organoid self-renewal.
HFD and PPAR-d raise β-catenin activity
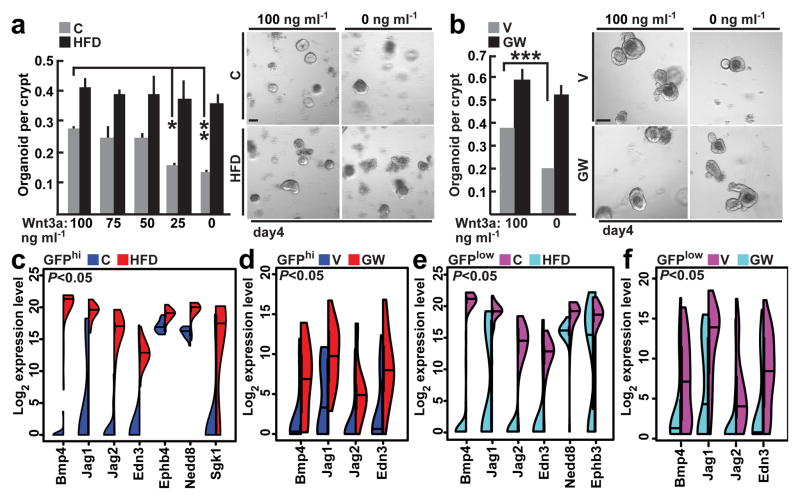
Because HFD and PPAR-d activation confer increased stem cell function, we asked whether these interventions regulate the Wnt/β-catenin pathway, which is required for ISC maintenance2,22. First, we observed more nuclear β-catenin, a proxy for its activity, in sorted ISCs and progenitors and on intestinal sections from HFD and PPAR-d agonist-treated mice compared to controls (Extended Data 7c–i). Second, crypts from HFD and PPAR-d agonist-treated mice required less exogenous Wnt for organoid maintenance than controls (Fig. 4a, b). Lastly, we found that increased levels of nuclear β-catenin associate with PPAR-d in HFD crypts (Extended Data 7j–l).
Figure 4. HFD-induced PPAR-d signaling induces expression of a subset of β-catenin target genes.
a, b, Organoid per crypt quantification from HFD-fed (a) and GW-treated (b) mice with indicated concentrations of Wnt3a. Representative images: Day 4 organoids (_n_=5).
c, d, e, f, Violin plots for most induced β-catenin target genes in ISCs (Lgr5-GFPhi) from HFD-fed (c) and GW-treated mice (d) (24 single cells/group), and in progenitors (Lgr5-GFPlow) from HFD-fed (e) and GW-treated mice (f) (72 single cells/group; See Materials and Methods).
(Unless otherwise indicated, data reflect mean ± s.d. from n independent experiments; *P<0.05, **P<0.01, ***P<0.001; scale bars in a,b=100μm. ISCs= intestinal stem cells; C= control; HFD= high fat diet; V= vehicle; GW= PPAR-d agonist, GW501516)
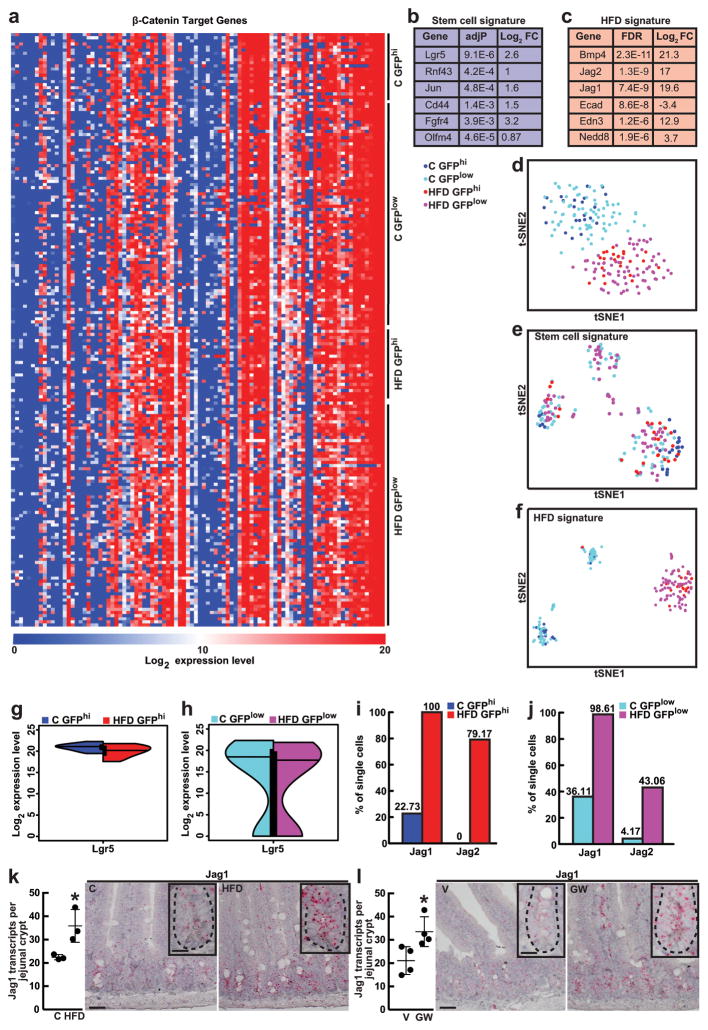
To address how a HFD and agonist-activated PPAR-d influence β-catenin transcriptional activity, we performed microfluidic-based multiplexed single cell qRT-PCR using primers for a curated list of known β-catenin target genes that includes intestinal stem-cell markers (Supplementary Table 2, Extended Data 8a, d, See Supplementary Information). While a HFD did not alter expression of stem-cell signature genes (i.e. Lgr5) that differ between stem and progenitor cells (Extended Data 8b, e, g, h)23,24, it evoked expression of a subset of β-catenin target genes such as Bmp4, Jag1, Jag2 and Edn3 in ISCs and progenitors (Fig. 4c, e, Extended Data 3i, 8c, i, j). Single cell qRT-PCR analysis confirmed that agonist-activated PPAR-d also induced transcription of Bmp4, Jag1, Jag2 and Edn3 in ISCs and progenitors (Fig. 4d, f). We further validated Jag-1 expression by single molecule in situ hybridization and found that it was broadly expressed within HFD (Extended Data 8k) and PPAR-d agonist-treated crypts (Extended Data 8l). Moreover, in response to in vitro fatty acids, PPAR-d was required for the induction of Jag1 and Jag2 in secondary organoids (Extended Data 6o). Collectively, these results support a model in which HFD activates a PPAR-d mediated subset of β-catenin target genes in ISCs and progenitor cells.
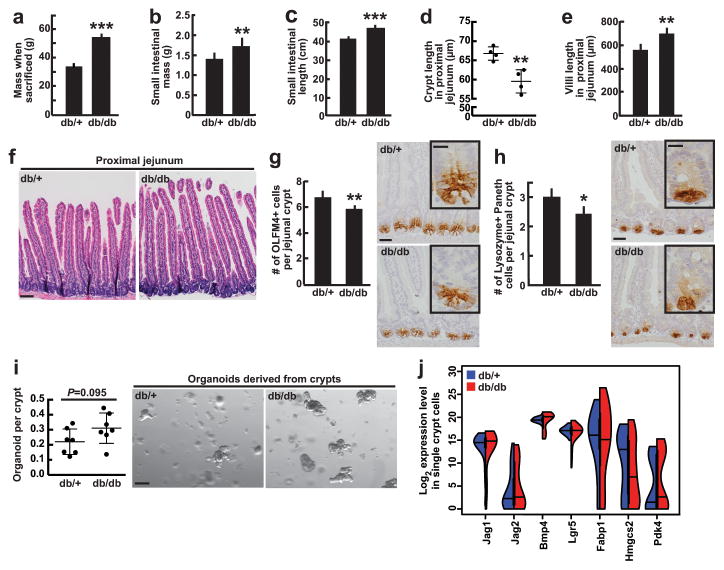
To interrogate whether a similar program exists in an alternate model of obesity, we assessed how the intestine adapts to obesity in leptin receptor deficient (db/db) mice—an obesity model that develops on a standard diet. Overall, we found that intestinal adaptation in the db/db obesity model was mostly opposite to what we observed in HFD-fed mice (Extended Data 9 and See Supplementary Information). Such differences highlight that, even in obesity, diet impacts intestinal stem and progenitor biology.
PPAR-d permits non-ISCs to beget tumors
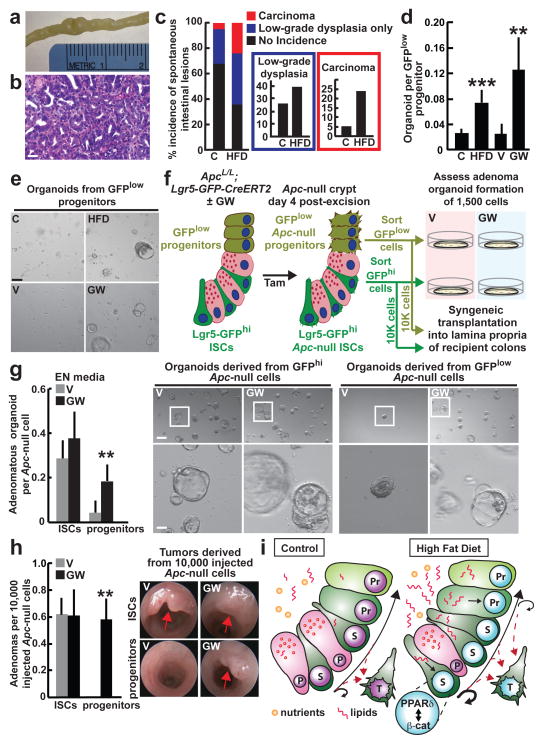
It is understood that somatic stem-cells often accumulate the initial mutations that lead to oncogenic transformation3,8,25–27. We found that in a HFD there is a greater incidence of spontaneous intestinal low-grade dysplastic lesions (adenomas), carcinomas, or both than in controls (Fig. 5a–c), which may reflect the fact that there are more ISCs in mice on a HFD that can acquire oncogenic mutations. Because HFD-induced PPAR-d also activates a β-catenin signature in progenitor cells, we hypothesized that non-ISC progenitor populations can acquire stem-cell features and contribute to tumor initiation in diet-induced obesity3,27. To explore this possibility, we asked whether HFD or agonist-activated PPAR-d influenced the organoid-initiating capacity of progenitors (non-ISCs). Interestingly, Lgr5-GFPlow progenitors, but not terminally differentiated villous enterocytes, from HFD and PPAR-d agonist treated mice formed organoids (Fig. 5d, e, Extended Data 4g, 7a, b), raising the possibility that enforced PPAR-d signaling in intestinal progenitors not only bestows organoid-initiating capacity but also tumor-initiating potential.
Figure 5. PPAR-d activation confers organoid and tumor-initiating capacity to non-stem-cells.
a, b, Representative spontaneous intestinal tumor from a HFD mouse: gross image (a) and microscopic H&E image (b).
c, Incidence of spontaneous intestinal low-grade dysplastic lesions (adenoma) and carcinomas in C (_n_=19) and HFD (_n_=25) mice.
d, e, Organoid-initiating capacity of progenitors (Lgr5-GFPlow) from HFD (_n_=7) and GW-treated (_n_=5) mice. Representative images: Day 7 organoids (e).
f, Schematic assessing in vitro and in vivo adenoma-initiating capacity of _Apc_-null ISCs (Lgr5-GFPhi) and progenitors (Lgr5-GFPlow) from V and GW-treated mice (Tam=tamoxifen).
g, Numbers and representative day 5 images of adenomatous organoids from _Apc_-null ISCs (Lgr5-GFPhi) and progenitors (Lgr5-GFPlow) treated +/− GW in EN media (EGF and Noggin only) (_n_=6).
h, Optical colonoscopy of tumors formed after orthotopic transplantation of _Apc-_null ISCs (Lgr5-GFPhi) and _Apc_-null progenitors (Lgr5-GFPlow) from V and GW-treated mice (_n_=5).
i, A model of intestinal adaptation to HFD: mechanistically, HFD activates a PPAR-d-mediated program that augments the organoid and tumor-initiating capacity of intestinal progenitors. A feature of the PPAR-d program includes induction of a subset of β-catenin target genes. S= stem-cell, P= Paneth cell, Pr= progenitor cell, T= tumor cell, red dotted line= _Apc_-null cells with tumor-forming capability.
(Unless otherwise indicated, data reflect mean ± s.d. from n independent experiments; *P<0.05, **P<0.01, ***P<0.001; scale bars in b=50μm, e=200μm, g=200μm (upper) and 50μm (lower). ISCs= intestinal stem cells; C= control; HFD= high fat diet; V=vehicle; GW= PPAR-d agonist, GW501516)
To test this possibility, we generated ApcL/L; Lgr5-EGFP-IRES-CreERT2 mice to assess whether pharmacological PPAR-d activation modifies the tumorigenic capacity of the Lgr5-GFPlow progenitors. Injection with tamoxifen leads to Apc loss in the Lgr5-GFPhi ISCs, which in turn generate _Apc-_null Lgr5-GFPlow progenitors (Extended Data 10c). Four days after tamoxifen administration, we isolated _Apc-_null Lgr5-GFPhi ISCs and Lgr5-GFPlow progenitors from vehicle and PPAR-d agonist treated mice to assess the tumor-forming potential of these populations using separate assays (Fig. 5f schematic): first, we examined their capacity to give rise to adenomatous organoids in culture; and second, we interrogated the ability of 10,000 sorted stem and progenitor cells to initiate adenomas in syngeneic recipient colons.
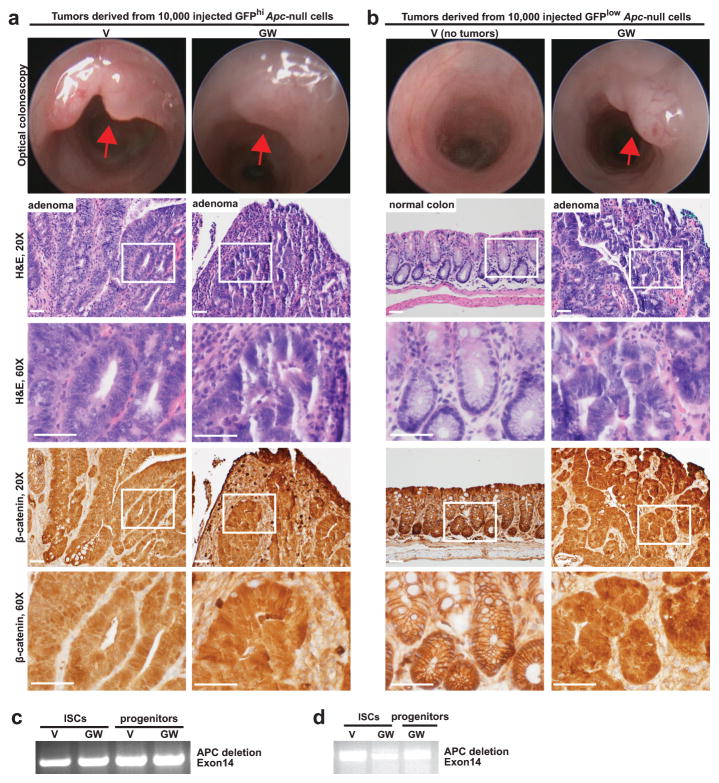
We found that _Apc-_null ISCs from PPAR-d agonist-treated mice were as clonogenic as those from vehicle controls; however, enforced PPAR-d signaling in _Apc-_null progenitors dramatically boosted their ability to form adenomatous organoids (Fig. 5g). Next, we assessed the potential of freshly isolated intestinal stem and progenitor cells to form in vivo intestinal adenomas (Fig. 5f schematic). As in the organoid assay, the PPAR-d agonist had no additive effect on the ability of _Apc-_null stem-cells to form β-catenin+ (_Apc-_null) adenomas (Fig. 5h, Extended Data 10a, d) compared to the vehicle controls. However, enforced PPAR-d signaling permitted _Apc-_null progenitors, but not their vehicle-treated counterparts, to robustly initiate β-catenin+ (_Apc-_null) adenomas upon transplantation into recipient colons (Fig. 5h, Extended Data 10b, d). These data indicate that PPAR-d activation enables a subset of non-ISC progenitors to initiate adenomatous growth in vitro and in vivo (See Supplementary Information).
Discussion
Our data favor a model in which a HFD augments ISC self-renewal and bestows features of stemness (i.e. organoid-initiating capacity) on non-stem cell progenitors by activating PPAR-d signaling (Fig. 5i). A previous study shows that a different dietary regimen, calorie restriction, increases both stem and Paneth cell numbers and regulates ISC function non-cell autonomously through the Paneth cell niche with no significant effect on progenitor cell function1. In contrast, here we find that a long-term HFD has opposing effects on stem and Paneth cell numbers and that these stem cells are less dependent on Paneth cells in functional assays. The fact that we find induction of β-catenin targets Jag1 and Jag2 (Notch ligands typically elaborated by Paneth cells) in HFD stem and progenitor cells suggests a possible role for Notch signaling. In a HFD, proximate ISCs or progenitor cells may serve as a surrogate source of Notch ligands for Lgr5+ ISCs not in direct contact with Paneth cells, enabling them to persist in vivo and in the organoid assay. A recent report28 that PPAR-d activation in the bone amplifies β-catenin signaling is consistent with our finding that diet-activated PPAR-d engages a restricted β-catenin program. Notably, genes within the PPAR-d-activated β-catenin program include Jag1, Jag2, and Bmp4, which are often deregulated in early intestinal tumorigenesis (Fig. 4c–f)29–31.
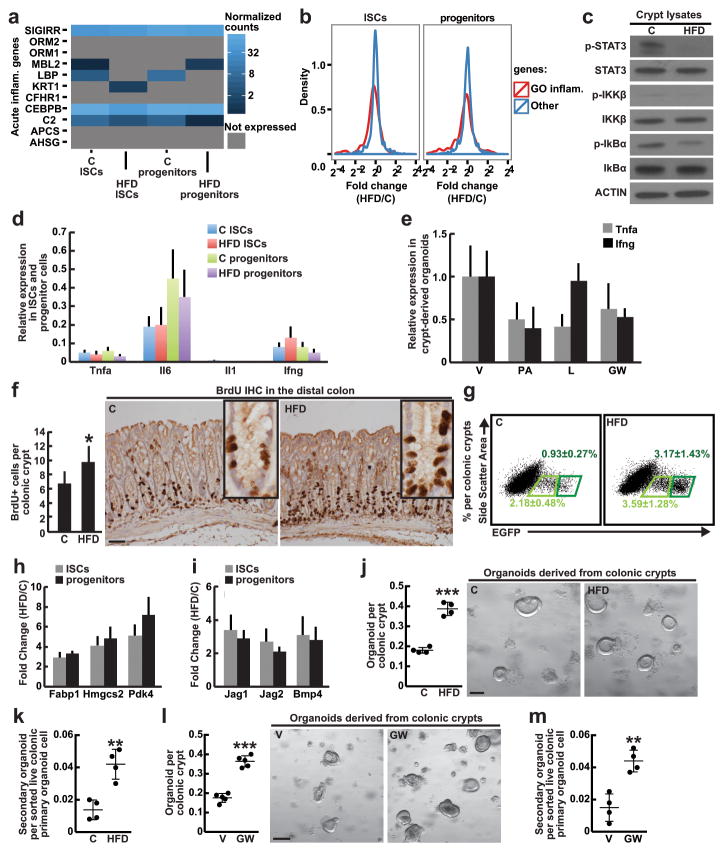
Recent studies propose that intrinsic and extrinsic factors contribute to cancer risk through the control of stem-cell divisions 25,32. These models predict that extrinsic factors such as a HFD may elevate cancer risk by increasing stem-cell divisions, which are the implicated cell-of-origin for many cancers. Our data (Figure 5i) and a previous study33 demonstrate that a HFD augments the numbers and proliferation of ISCs, which may partially account for the increase of intestinal tumors in this model of obesity. Another possibility raised by our results is that a HFD-driven PPAR-d program also enhances the susceptibility of non-ISCs to undergo oncogenic transformation, thus establishing a larger and more diverse pool of cells capable of initiating tumors. Consistent with this notion, it has been proposed that differentiated cells (i.e. non-ISCs) in the background of _Apc-_deficiency with concurrent activation of oncogenic KRAS and pro-inflammatory NF-kB signaling have the capacity to initiate tumors9. Whether and how obesity-related inflammation in a HFD contributes to PPAR-d signaling and intestinal tumorigenesis is unknown. In our models, we find no evidence that a HFD or its predominant fatty acid constituents activate inflammatory pathways in intestinal crypts34 or organoids, respectively (Extended Data 3a–e).
While some previous work indicates that PPAR-d inhibition may have modest anti-cancer effects19, sustained PPAR-d activation and a HFD have been linked to colorectal cancer initiation and progression7,35–40. Future studies will need to address whether PPAR-d inhibition in the setting of a HFD impacts tumor initiation and progression. Lastly, it will be important to explore if lean ketogenic diets, which like a HFD are composed largely of fatty acids but with fewer carbohydrates, mimic the pro-regenerative effects of a HFD while minimizing the untoward sequelae of obesity.
Materials and Methods
Mice, High Fat Diet, and drug treatment
Mice were housed in the Unit for Laboratory Animal Medicine at the Whitehead Institute for Biomedical Research and Koch Institute for Integrative Cancer Research. The following strains were obtained from the Jackson Laboratory: Lgr5-EGFP-IRES-CreERT2 (strain name: B6.129P2-Lgr5tm1(cre/ERT2)Cle/J, stock number 008875), Rosa26-lacZ (strain name: B6.129S4-Gt(ROSA)26Sortm1Sor/J, stock number 003474), db/db (strain name: B6.BKS(D)-Leprjb/J, stock number 000697), PpardL/L (strain name: B6.129S4-Ppardtm1Rev/J, stock number 005897). Apcloxp exon 14 (_Apc_L/L) has been previously described41. Villin-CreERT2 was a gift from Sylvie Robine. Long-term high fat diet was achieved by feeding male and female mice a dietary chow consisting of 60 kcal% fat (Research Diets D12492) beginning at the age of 8–12 weeks and extending for a period of 9 to 14 months. Control mice were sex and age-matched and fed standard chow ad libitum. GW501516 (Enzo) was reconstituted in DMSO at 4.5 mg ml−1 and diluted 1:10 in a solution of 5% PEG400 (Hampton Research), 5% Tween80 (Sigma), 90% H2O for a daily intraperitoneal injection of 4 mg kg−1. Apc exon 14 was excised by tamoxifen suspended in sunflower seed oil (Spectrum S1929) at a concentration of 10 mg ml−1 and 250 μl per 25g of body weight, and administered by intraperitoneal injection twice over 4 days before harvesting tissue. PpardL/L mice were administered four to five I.P. injections of tamoxifen on alternate days. Mice were analyzed within two weeks of the last tamoxifen injection. BrdU was prepared at 10 mg ml−1 in PBS, passed through 0.22 μm filter and injected at 100 mg kg−1.
Immunohistochemistry (IHC) and immunofluorescence (IF)
As previously described1, tissues were fixed in 10% formalin, paraffin embedded and sectioned. Antigen retrieval was performed with Borg Decloaker RTU solution (Biocare Medical) in a pressurized Decloaking Chamber (Biocare Medical) for 3 minutes. Antibodies used: rat anti-BrdU (1:2000 (IHC), 1:1000 (IF) Abcam 6326), rabbit chromogranin A (1:4000 (IHC), 1:250 (IF), Abcam 15160), rabbit monoclonal non-phospho β-catenin (1:800(IHC), 1:400(IF), CST 8814S), mouse monoclonal β-catenin (1:200, BD Biosciences 610154), rabbit polyclonal lysozyme (1:250, Thermo RB-372-A1), rabbit polyclonal MUC2 (1:100, Santa Cruz Biotechnology 15334), rabbit monoclonal OLFM4 (1:10,000, gift from CST, clone PP7), Biotin-conjugated secondary donkey anti-rabbit or anti-rat antibodies were used from Jackson ImmunoResearch. The Vectastain Elite ABC immunoperoxidase detection kit (Vector Labs PK-6101) followed by Dako Liquid DAB+ Substrate (Dako) was used for visualization. For immunofluorescence, Alexa Fluor 568 secondary antibody (Invitrogen) was used with Prolong Gold (Life Technologies) mounting media. All antibody incubations involving tissue or sorted cells were performed with Common Antibody Diluent (Biogenex). Organoids were fixed with 4%PFA, permabilized with 0.5%TritonX-100/PBS, rinsed with 100mM glycine/PBS, blocked with 10% Donkey serum/PBS, incubated overnight with primary antibody at 4°C, rinsed and incubated with Alexa Fluor 568 secondary antibody (Invitrogen), and mounted with Prolong Gold (Life Technologies) mounting media.
In situ hybridization
The in situ hybridization probes used in this study correspond to expressed sequence tags or fully sequenced cDNAs obtained from Open Biosystems. The accession numbers (IMAGE mouse cDNA clone in parenthesis) for these probes are as follows: mouse Olfm4 BC141127 (9055739), mouse Cryptdin4 BC134360 (40134597). Both sense and antisense probes were generated to ensure specificity by in vitro transcription using DIG RNA labeling mix (Roche) according to the manufacturer’s instructions and to previously published detailed methods23,42. Single-molecule in situ hybridization was performed using Advanced Cell Diagnostics RNAscope 2.0 HD Detection Kit.
Radiation and clonogenic microcolony assay
Adult mice were exposed to 15 Gy of ionizing irradiation from a 137-cesium source (GammaCell) and sacrificed after 72 hours. The number of surviving crypts per length of the intestine was enumerated from haematoxylin and eosin stained sections15.
Immunopreciptation and Immunoblotting
Antibodies: rabbit polyclonal anti-PPAR-d (1:100, Thermo PA1-823A), rabbit polyclonal anti-CPT1a (1:250, ProteinTech 15184-1-AP), rabbit polyclonal anti-HMGCS2 (1:500, Sigma AV41562), rabbit monoclonal anti-FABP1 (1:1000, Abcam ab129203), NF-kappaB Sampler Pathway Kit (CST, 9936S), mouse monoclonal anti-STAT-3 (CST, 9139P), rabbit monoclonal anti-P-STAT3 (Y705) XP (CST, 9145P), mouse monoclonal anti-CREB (CST, 86B10), mouse monoclonal anti-β-catenin (1:200, BD Biosciences 610154), rabbit polyclonal anti-γ-tubulin (1:1000, Sigma T5192). For immunoprecipitation (IP) assays, crypts were harvested and nuclear extraction was carried out using Abcam nuclear extraction kit (ab113474) following manufacturer’s instructions. Nuclear extracts were incubated with 5μg anti-PPAR-d antibody (Thermo), or anti-rabbit IgG control antibody (Santa Cruz) overnight at 4°C followed by 2 hours of incubation with Dynabeads Protein G for immunoprecipitation. Protein complexes bound to antibody and beads were washed 5 times and eluted with Laemmli sample buffer. Samples were resolved by SDS-PAGE. Protein interaction was analyzed by immunoblotting.
Lgr5-GFPhi ISCs or Lgr5-GFPlow progenitors were sorted directly into Laemmli sample buffer and boiled for five minutes. Samples were resolved by SDS-PAGE and analyzed by immunoblotting with IgG-HRP secondary antibodies (1:10,000, Santa Cruz Biotechnology sc-2054) and Western Lightning Plus-ECL detection kit (Perkin Elmer, NEL104001EA).
Flow cytometry and isolation of ISCs, colonic stem-cells, and Paneth cells
As previously reported and briefly summarized here, small intestines and colons were removed, washed with cold PBS−/−, opened longitudinally, and then cut into 3–5mm fragments. Pieces were washed multiple times with cold PBS−/− until clean, washed 2–3 with PBS−/−/EDTA (10mM), incubated on ice for 90–120 minutes, and gently shook at 30-minute intervals. Crypts were then mechanically separated from the connective tissue by more rigorous shaking, and then filtered through a 70-μm mesh into a 50-ml conical tube to remove villus material (for small intestine) and tissue fragments. Crypts were removed from this step for crypt culture experiments and embedded in Matrigel™ with crypt culture media. For ISC isolation, the crypt suspensions were dissociated to individual cells with TrypLE Express (Invitrogen). Cell labeling consisted of an antibody cocktail comprising CD45-PE (eBioscience, 30-F11), CD31-PE (Biolegend, Mec13.3), Ter119-PE (Biolegend, Ter119), CD24-Pacific Blue (Biolegend, M1/69), CD117-APC/Cy7 (Biolegend, 2BS), and EPCAM-APC (eBioscience, G8.8). ISCs were isolated as Lgr5-EGFPhiEpcam+CD24low/−CD31−Ter119−CD45−7-AAD−. EGFPlow progenitors were isolated as EGFPlowEpcam+CD24low/−CD31−Ter119−CD45−7-AAD−, and Paneth cells from small intestine were isolated as CD24hiSidescatterhiLgr5-EGFP−Epcam+CD31−Ter119−CD45−7-AAD− with a BD FACS Aria II SORP cell sorter into supplemented crypt culture medium for culture. Dead cells were excluded from the analysis with the viability dye 7-AAD (Life Technologies). When indicated, populations were cytospun (Thermo Cytospin 4) at 800 r.p.m. for 2 minutes, or allowed to settle at 37°C in fully humidified chambers containing 5% CO2 onto poly-L-lysine-coated slides (Polysciences). The cells were subsequently fixed in 4% paraformaldehyde (pH 7.4, Electron Microscopy Sciences) before staining.
Culture media for crypts and isolated cells
Isolated crypts were counted and embedded in Matrigel™ (Corning 356231 growth factor reduced) at 5–10 crypts per μl and cultured in a modified form of medium as described previously13. Unless otherwise noted, Advanced DMEM (Gibco) was supplemented by EGF 40 ng ml−1 (R&D), Noggin 200 ng ml−1 (Peprotech), R-spondin 500 ng ml−1 (R&D or Sino Biological), _N_-acetyl-L-cysteine 1 μM (Sigma-Aldrich), N2 1X (Life Technologies), B27 1X (Life Technologies), Chiron 10 μM (Stemgent), Y-27632 dihydrochloride monohydrate 20 ng ml−1 (Sigma-Aldrich). Colonic crypts were cultured in 50% conditioned medium derived from L-WRN cells supplemented with Y-27632 dihydrochloride monohydrate 20 ng ml−1, as described43. 25–30μL droplets of Matrigel™ with crypts were plated onto a flat bottom 48-well plate (Corning 3548) and allowed to solidify for 20–30 minutes in a 37°C incubator. Three hundred microliters of crypt culture medium was then overlaid onto the Matrigel™, changed every three days, and maintained at 37°C in fully humidified chambers containing 5% CO2. Clonogenicity (colony-forming efficiency) was calculated by plating 50–300 crypts and assessing organoid formation 3–7 days or as specified after initiation of cultures. Palmitic acid (Cayman Chemical Company 10006627 conjugated to BSA), oleic acid (Sigma O1008), lipid mixture (Sigma L0288), or GW501516 (Enzo) were added immediately to cultures at 30 μM (PA, OA), 2% (lipid mixture), and 1μM (GW501516). 4-OH tamoxifen (Calbiochem, 579002, 10nM) was added to organoid cultures derived from PpardL/L; Villin-CreERT2 (PPARdIKO) crypts to ensure Ppard excision in the ex vivo fatty acid or GW501516 experiments.
Isolated ISCs or progenitor cells were centrifuged for 5 minutes at 250g, re-suspended in the appropriate volume of crypt culture medium (500–1,000 cells μl−1), then seeded onto 25–30μl Matrigel™ (Corning 356231 growth factor reduced) containing 1μM Jagged (Ana-Spec) in a flat bottom 48-well plate (Corning 3548). Alternatively, ISCs and Paneth cells were mixed after sorting in a 1:1 ratio, centrifuged, and then seeded onto Matrigel™. The Matrigel™ and cells were allowed to solidify before adding 300 μl of crypt culture medium. The crypt media was changed every second or third day. Organoids were quantified on days 3, 7 and 10 of culture, unless otherwise specified.
Secondary murine organoid assays
For secondary organoid assays, either individual primary organoids or many primary organoids were either mechanically dissociated and then replated or organoids were dissociated for 10 minutes in TrypLE Express at 32°C, resuspended with SMEM (Life Technologies), centrifuged (5 minutes at 250g) and then resuspended in cold SMEM with the viability dye 7-AAD. Live cells were sorted and seeded onto Matrigel™ as previously described in standard crypt media (not supplemented with lipids or GW501516). Secondary organoids were enumerated on day 4, unless otherwise specified.
Human crypt cultures
Human biopsies were obtained from patients with informed consent undergoing intestinal resection at the Massachusetts General Hospital (MGH). The MGH Institutional Review Board committee and Massachusetts Institute of Technology Committee on the Use of Humans as Experimental Subjects approved the study protocols. Crypts were isolated43, embedded in Matrigel™ and subsequently exposed to lipid mixture, palmitic acid, or GW501516 (as described in the previous section, entitled “Culture media for crypts and isolated cells”). Cultures were passaged weekly and maintained for 3–4 weeks. To passage, equal numbers of organoids from each condition were disrupted with trypsin/EDTA. Numbers of organoids were counted 4–7 days after passaging into control media. Counts were normalized to numbers of organoids present in control wells and plotted. Statistical significance was calculated by performing ANOVA multiple comparisons of the means for each group. For quantitative RNA expression analysis, organoids were dissociated, cells were selected as a live population by flow cytometry (7-AAD, Life Technologies), and sorted into Tri Reagent (Life Technologies) for RNA isolation.
Electron microscopy
After 5 days of culturing, intestinal organoids were placed into Karnovsky’s KII solution (2.5% glutaraldehyde, 2.0% paraformaldehyde, 0.025% calcium chloride, in a 0.1 M sodium cacodylate buffer, pH 7.4) and fixed overnight. Subsequently, they were postfixed in 2.0% osmium tetroxide, stained en bloc with uranyl acetate, dehydrated in graded ethanol solutions, infiltrated with propylene oxide/Epon mixtures, flat embedded in pure Epon, and polymerized over night at 60°C. One-micrometer sections were cut, stained with toluidine blue, and examined by light microscopy. Representative areas were chosen for electron microscopic study and the Epon blocks were trimmed accordingly. Thin sections were cut with an LKB 8801 ultramicrotome and diamond knife, stained with Sato’s lead, and examined in a FEI Morgagni transmission electron microscope. Images were captured with an AMT (Advanced Microscopy Techiques) 2K digital CCD camera.
mRNA-Sequencing
RNA Isolation
For RNA-seq, total RNA was extracted from 200K sorted Lgr5-GFPhi ISCs and Lgr5-GFPlow progenitors by pooling two to five 71-week old HFD male or control mice using Tri Reagent (Life Technologies) according to the manufacturer’s instructions, except for a overnight isopropanol precipitation at −20°C. From the total RNA, poly(A)+ RNA was selected using Oligo(dT)25-Dynabeads (Life technologies) according to the manufacturer’s protocol.
RNA-Seq Library Preparation
Strand-specific RNA-seq libraries were prepared using the dUTP-based, Illumina-compatible NEXTflex Directional RNA-Seq Kit (Bioo Scientific) according to the manufacturer’s directions. All libraries were sequenced with an Illumina HiSeq 2000 sequencing machine.
Processing of RNA-seq reads and measuring expression level
For RNA-seq data analysis, raw stranded reads (40 nt) were trimmed to remove adapter and bases with quality scores below 20, and reads shorter than 35 nt were excluded. High-quality reads were mapped to the mouse genome (mm10) with TopHat version 1.4.144, using known splice junctions from Ensembl Release 70 and allowing at most 2 mismatches. Genes were quantified with htseq-count (with the “intersect strict” mode) using Ensembl Release 70 gene models. Gene counts were normalized across all samples using estimateSizeFactors() from the DESeq R/Bioconductor package45. Differential expression analysis was also performed between two samples of interest with DESeq. Gene Set Enrichment analysis (www.broadinsitute.org/gsea) was performed by using the pre-ranked (according to their ratios) 8,240 differentially expressed genes as the expression data set. Motif Analysis was performed using Haystack motif enrichment tool: http://github.com/lucapinello/Haystack46.
Single-Cell Gene Expression Analysis
24 single Lgr5-GFPhi ISCs and 72 single Lgr5-GFPlow progenitor cells were sorted from control or HFD mice (_n_=2 mice per group) for single-cell gene expression analysis. For one-tube single-cell sequence-specific preamplification, individual primer sets of β-catenin target genes (total of 96, Supplementary Table 2) were pooled to 0.1 mM final concentration for each primer. Single cells were directly sorted into 96-well plates containing 5ul RT-PCR master mix (2.5ul CellsDirect reaction mix, Invitrogen; 0.5ul primer pool; 0.1ul RT/Taq enzyme, Invitrogen; 1.9ul nuclease free water) in each well. Immediately after, plates were placed on PCR machine for preamplification. Sequence specific preamplification PCR protocol was as following: 1) 60 minutes at 50°C for cell lysis and sequence specific reverse transcription. 2) 3 minutes at 95°C for reverse transcriptase inactivation and Taq polymerase activation. Then, cDNA was amplified by 20 cycles of 15 seconds at 95°C for initial denaturation, 15 minutes at 60°C for annealing and elongation. After preamplificiation, samples were diluted 1:5 prior to high throughput microfluidic real time PCR analysis using Fluidigm platform. Amplified single cell cDNA samples were assayed for gene expression using individual qRT-PCR primers and 96.96 dynamic arrays on a BioMark System by following manufacturers protocol (Fluidigm). To confirm PPAR-d mediated induction of the most upregulated genes (_n_=3 mice, 24 ISCs and 72 progenitors per group), or for single cell analysis of organoid composition (_n_=3 mice, 48 cells per group) and db/db mice (_n_=3, 48 cells per group) standard single-cell qRT-PCR was performed using preamplified cDNA with corresponding primers. For Fluidigm analysis, threshold cycle (Ct) values were calculated using the BioMark Real-Time PCR Analysis software (Fluidigm). (See Supplementary Information for raw gene expression data). Gene expression levels were estimated by subtracting the Ct values from the background level of 35, which approximately represent the log2 gene expression levels. The t-Distributed stochastic neighbor embedding (t-SNE) analysis47 was performed using the MATLAB toolbox for dimensionality reduction. Differential expression analysis was conducted using the two-sided Wilcoxon- Mann-Whitney rank sum test implemented in the R coin package (www.r-project.org). _P_-values were adjusted for multiple testing48 using the p.adjust function in R with method=“fdr” option. Fold-changes were calculated as the difference of median of log2 expression levels for the two cell populations. Split violin plots were generated using the vioplot package and the vioplot2 function in R (https://gist.github.com/mbjoseph/5852613). The heatmap for β-catenin target genes was generated with the MultiExperiment Viewer (MeV) program (http://www.tm4.org/mev.html) using the correlation-based distance and average linkage method as parameters of the unsupervised hierarchical clustering of genes. The heatmap for organoid composition was generated using MATLAB. The percentages of Jag1/Jag2 upregulated cells were calculated based on the number of single cells whose log2 expression was above 15.
qRT-PCR
25.000 cells were sorted into Tri Reagent (Life Technologies) and total RNA was isolated according to the manufacturer’s instructions with following modification: the aqueous phase containing total RNA was purified using RNeasy plus kit (Qiagen). RNA was converted to cDNA with cDNA synthesis kit (Bio-Rad). qRT-PCR was performed with diluted cDNA (1:5) in 3 wells for each primer and SYBR green master mix (Bio-Rad) on Bio-Rad iCycler RT-PCR detection system. For organoid experiments, 1000 live cells were sorted and qRT-PCR optimized for low cell numbers (<1000) was performed after sequence specific pre-amplification (cDNA diluted 1:200 in 3 wells for each primer) as described in single-cell gene expression analysis. All qRT PCR experiments were repeated at least 3 independent times. Primers used are listed on Supplementary Table 1.
Orthotopic transplantation
ApcL/L; Lgr5-EGFP-IRES-CreERT2 mice were treated with vehicle or GW501516 for one month, and then injected with two doses of tamoxifen I.P. Four days later, _Apc_-null Lgr5-GFPhi ISCs and Lgr5-GFPlow progenitors were sorted by flow cytometry, as described above. For primary cell transplantations, 10,000 _Apc_-null Lgr5-GFPhi ISCs and Lgr5-GFPlow progenitors were resuspended into 90% crypt culture media (as described) and 10% Matrigel™, then transplanted into the colonic lamina propria of C57BL/6 recipient mice by optical colonoscopy using a custom injection needle (Hamilton Inc., 33 gauge, small Hub RN NDL, 16 inches long, point 4, 45 degree bevel, like part number 7803-05), syringe (Hamilton Inc., part number 7656-01), and transfer needle (Hamilton Inc., part number 7770-02). Optical colonoscopy was performed using a Karl Storz Image 1 HD Camera System, Image 1 HUB CCU, 175 Watt Xenon Light Source, and Richard Wolf 1.9mm/9.5 Fr Integrated Telescope (part number 8626.431). Four injections were performed per mouse. Mice then underwent colonoscopy eight weeks later to assess tumor formation. Colonoscopy videos and images were saved for offline analysis. Following sacrifice, the distal colons were excised and fixed in 10% formalin, then examined by hematoxylin and eosin section to identify adenomas. Histology images were reviewed by gastrointestinal pathologists who were blinded to the treatment groups (S.S., V.D., and O.H.Y.).
Statistics and animal models
All experiments reported in Figs 1, 2, 3, 4, and 5 were repeated at least three independent times except Figs 3a, 4c–d, which were repeated twice. All samples represent biological replicates. For murine organoid assays, 2–4 wells per group with at least 3 different mice were analyzed. For human organoid assays, 4 wells per group with 4 different patient samples were analyzed and experiments were repeated 4 times. All centre values shown in graphs refer to the mean. For statistical significance of the differences between the means of two groups, we used two-tailed Student’s t-tests. Statistical significance in Figure 3k was calculated by performing ANOVA multiple comparisons of the means for each group. No samples or animals were excluded from analysis, and sample size estimates were not used. Animals were randomly assigned to groups. Studies were not conducted blind with the exception of all histological analyses and Fig. 5c and 5h. All experiments involving mice were carried out with approval from the Committee for Animal Care at MIT and under supervision of the Department of Comparative Medicine at MIT.
Extended Data
Extended Data Figure 1. HFD alters intestinal morphology and enhances intestinal progenitor proliferation.
a–g, In comparison to mice fed a standard chow, mice on a HFD gained on average 50% mass (a, C: _n_=11, HFD: _n_=15), had reduced small intestinal mass and length (b,c, C: _n_=11, HFD: _n_=15), longer crypts and shorter villi (e,g, _n_=3 each), and fewer villus enterocytes (f, _n_=3). HFD did not change the density of crypts (d, _n_=3) in the proximal jejunum. The proximal jejunum was defined as the length between 6 and 9 cm as measured from the pylorus (the distal portion of the stomach).
h–k, HFD enhanced BrdU incorporation in ISCs (or crypt base columnar cells) and progenitor cells (or transit-amplifying cells) in the proximal jejunum (h, _n_=6) and sorted cell populations (i, _n=_3) after a 4-hour pulse. HFD increased the total (j, control: _n_=4, HFD: _n=_5) and normalized numbers of BrdU-labeled enterocytes compared to controls after a 24-hour pulse. Arrowhead (k) marks the leading edge of migrating BrdU-positive enterocyte.
l, m, Representative images of Olfm4 (l, _n_=3) and Crypt4 (m, _n_=6) in situ hybridizations from C and HFD mice.
n, No significant difference in the number of jejunal caspase3+ cells was detected by immunohistochemistry. Images are representative of three separate experiments (_n_=3); arrows indicate representative caspase3+ enterocytes.
o, The HFD chow (Research Diets D12492) provides a higher percentage of kilocalories from fat and conversely a lower percentage of kilocalories from protein and carbohydrates compared to standard chow diet (Labdiet RMH3000).
(Unless otherwise indicated, data reflect mean ± s.d. from n independent experiments; *P<0.05, **P<0.01, ***P<0.001, scale bars in g=100μm, h,i=50μm, k=100μm and 50μm (inset), l,m= 50μm and 20μm (inset), n=100μm; two separate fields of jejunum (d), and at least 15 crypts (e), 15 villi (f), 10 villi (g), 100 cells (i), 25 villi (j) and 25 crypt-villus units (n) were counted per sample in each independent experiment. ISCs= intestinal stem cells; _Olfm4_= _Olfactomedin 4; Crypt4_= Cryptdin 4; C= control; HFD= high fat diet)
Extended Data Figure 2. HFD and PPAR-d signaling have minimal effects on enteroendocrine and goblet cell differentiation but promote intestinal regeneration after 15 Gy irradiation.
a, b, Quantification (a, _n_=3) of immunostains (b, _n_=3) for chromogranin A revealed no difference in the numbers of jejunal enteroendocrine cells (arrowheads) per crypt-villus unit in HFD-fed mice and GW-treated mice compared to their respective controls.
c, d, Quantification (c, _n_=4) of Alcian blue/PAS staining (d, _n_=4) showed no difference in mucinous goblet cells (arrowhead) in HFD-fed mice and GW-treated mice compared to their respective controls.
e, f, HFD increased the number of regenerating crypts as measured by an increased number of crypts containing at least ten Ki67+ (a marker of proliferation) cells (e, _n=_3) or at least one Olfm4+ cell (f, _n_=3) per 5mm of jejunum by immunohistochemistry (IHC) or in situ hybridization (ISH). Arrows indicate Olfm4+ crypts.
g, Surviving crypt numbers after ionizing irradiation-induced (XRT) damage. Arrows: regenerating crypts. Asterisks: aborted crypts (_n_=3).
(Unless otherwise indicated, data reflect mean ± s.d. from n independent experiments; scale bars in b, d=100μm, e, f=50μm and 20μm (inset), g=50μm; 50 crypt-villus units per sample were analyzed (a, c) and approximately 50 crypts (e, f, g) were counted per sample in each independent experiment. _Olfm4_= _Olfactomedin 4; Crypt4_= Cryptdin 4; C= control; HFD= high fat diet; V= vehicle; GW= PPAR-d agonist, GW501516)
Extended Data Figure 3. A HFD and fatty acids do not activate inflammatory pathways in intestinal crypts and organoids, while HFD and enforced PPAR-d signaling enhance colonic stem-cell function.
a, HFD did not alter the normalized expression levels of inflammatory genes from the gene set enrichment analysis (GSEA) MSigDB (signature M6557) data set in ISCs and progenitors.
b, HFD did not induce differential expression of Inflammatory Response genes from Gene Ontology (GO: 0006954) in ISCs (Lgr5-GFPhi) or progenitors (Lgr5-GFPlow) compared to C. Fold changes of GO Inflammatory Response genes are indicated in red, and fold changes for all other genes are indicated in blue.
c, HFD did not activate the NFκB or the STAT-3 pathways in the intestinal crypt. Total and phosphorylated protein levels in crypt lysates were assessed by immunoblots (_n=_3). For western blot source data, see Supplementary Figure 1.
d, HFD did not induce pro-inflammatory gene expression in ISCs (Lgr5-GFPhi) or progenitors (Lgr5-GFPlow). Relative expression levels compared to Actb were measured by qRT-PCR (_n=_5).
e, Ex vivo PA, L or GW treatment did not induce inflammatory gene expression in crypt-derived organoids compared to V. Relative expression levels compared to Actb were assessed by qRT-PCR (_n=_4, 12 wells per sample were analyzed).
f, HFD boosted the number of BrdU-labeled cells as measured in distal colonic crypts compared to C (C _n=_6, HFD _n=_5) after a 4-hour pulse.
g, HFD increased the frequency of colonic ISCs (Lgr5-GFPhi, dark green) and (Lgr5-GFPlow, light green) cells (_n=_8).
h, i, HFD enhanced PPAR-d (h) and β-catenin (i) target gene expression in colonic ISCs and progenitors. Relative expression levels compared to Actb were determined by qRT-PCR (n=5, all fold changes are significant with P<0.05)
j–m, Colonic crypts derived from HFD-fed (j, _n=_4; k, n=4) and GW-treated (l, _n=_5; m, _n=_4) mice demonstrated greater primary and secondary organoid-forming capacity compared to their respective controls. Representative day 4 organoids are depicted.
(Unless otherwise indicated, data reflect mean ± s.d. from n independent experiments; *P<0.05, **P<0.01, ***P<0.001, scale bars in f=50μm, j=100μm, l=200μm; 50 crypts per sample were analyzed (f) in each independent experiment. ISCs= intestinal stem cells; C= control; HFD= high fat diet; V= vehicle; GW= PPAR-d agonist, GW501516)
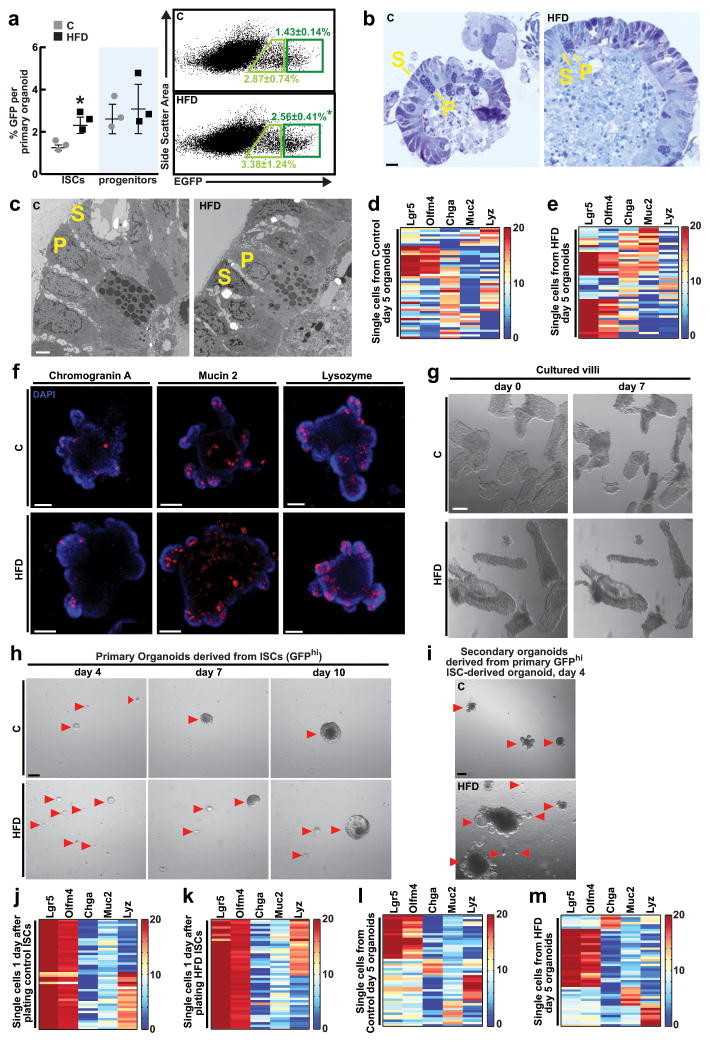
Extended Data Figure 4. Characterization of HFD crypt and ISC-derived organoids.
a, HFD organoids contained higher frequencies of ISCs (Lgr5-GFPhi) compared to C (_n=_3).
b, c, C and HFD organoids demonstrated no differences in morphologic ultrastructure as seen in (b) one micron sections of control (left) and HFD (right) organoids counterstained with Toluidine Blue and (c) electron microscopy images of representative C (left) and HFD (right) organoids (_n_=3). S=Stem-cell, P=Paneth cell.
d, e, Composition of organoids derived from C (d) and HFD (e) crypts as assessed by single-cell gene expression analysis. Organoids on day 5 contained ISCs (Lgr5 and Olfm4, Olfactomedin 4), Paneth cells (Lyz, Lysozyme), enteroendocrine cells (Chga, Chromogranin A), and goblet cells (Muc2, Mucin 2). 48 live cells per group were sorted and single-cell gene expression analysis was performed after pre-amplification using corresponding stem-cell and lineage primers (See Materials and Methods).
f, Crypt-derived organoids from control or HFD mice included Chromogranin A-, Mucin 2-, and Lysozyme-positive cells as assessed by immunofluorescence (blue=DAPI, red=cell-specific antibody). Images represent two experiments (_n_=2). blue: DAPI. red: cell-specific antibody.
g, Cultured villi from C and HFD mice lack the ability to form organoids. Images represent two experiments with 6 wells per sample (_n_=2).
h, ISCs from HFD-fed mice harbored greater organoid-forming potential compared to controls. Arrowheads indicate representative organoids at days 4, 7, 10 of culture (_n_=4).
i, Individually dissociated HFD primary organoids that were derived from single ISCs possessed more secondary organoid-forming ability than those from C. (_n_=4). Representative day 4 secondary organoids are illustrated.
j, k, Single-cell gene expression analysis revealed that ISCs from both control (j) and HFD (k) mice can beget Paneth cells (Lyz) within 24 hours in culture (48 cells per group, See Materials and Methods).
l, m, Composition of organoids derived from control (l) and HFD (m) ISCs (Lgr5-GFPhi) as assessed by single-cell gene expression analysis (48 cells per group, See Materials and Methods). Organoids on day 5 contained ISCs (Lgr5 and Olfm4), Paneth cells (Lyz), endocrine cells (Chga) and goblet cells (Muc2).
(Unless otherwise indicated, data reflect mean ± s.d. from n independent experiments; *P<0.05; scale bars in b= 20μm, c=2μm, f=50μm, g,i=200μm, h=100μm. C= control; HFD= high fat diet)
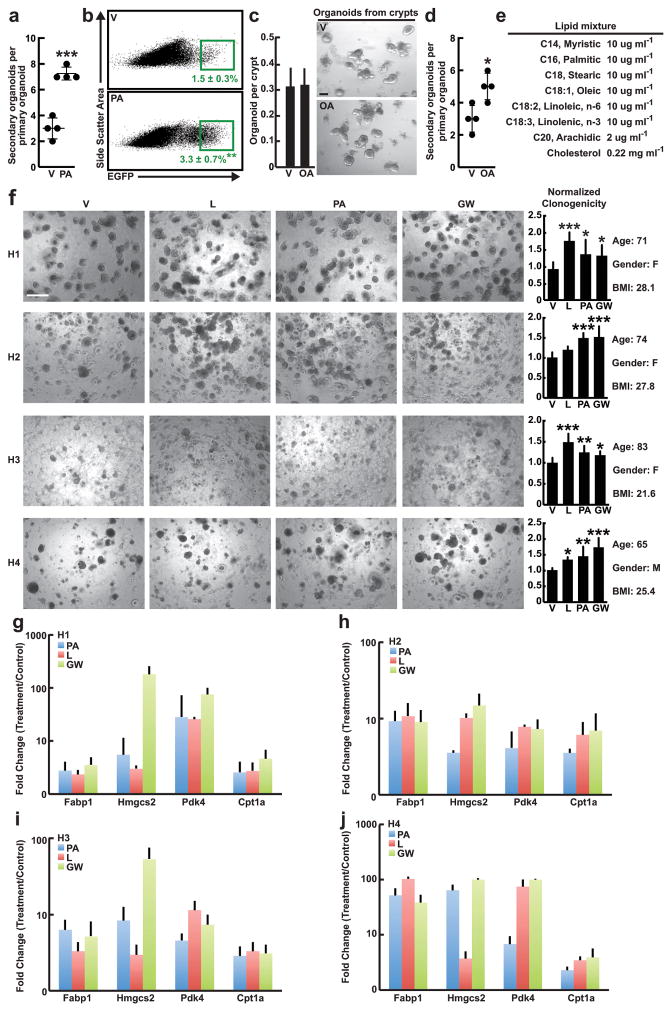
Extended Data Figure 5. Ex vivo exposure of mouse and human organoids to fatty acids recapitulates aspects of a HFD.
a, b Individually dissociated primary organoids possessed more secondary organoid-forming activity (a, _n_=4, the mean number of secondary organoids subcloned from each of 5 primary organoids in 4 independent experiments.) and contained a higher frequency of Lgr5-GFPhi ISCs (b, _n_=3) after four weeks of treatment with 30μM PA compared to V.
c, Exposure of naïve crypts to 30μM OA had no effect on primary organoid formation measured at day 7 (_n_=6). Representative day 7 organoids depicted.
d, Individually dissociated primary organoids possessed more secondary organoid-forming capacity after four weeks of treatment with 30μM OA (_n=_4, the mean number of secondary organoids subcloned from each of 5 primary organoids in 4 independent experiments.) compared to V (same vehicle cohort used in a and d).
e, Lipid mixture composition (Sigma L0288) as described by the manufacturer.
f, Ex vivo treatment of human-derived small intestinal crypts (H1–H4) passaged in the presence of L, PA, or GW augmented relative clonogenicity compared to V as shown in representative images from 4 independent experiments. H1: n= 10 (V, PA, GW) and n= 6 (L) wells were analyzed. H2: n= 16 (V), n= 6 (L), n= 12 (PA), and n= 14 (GW) wells were analyzed. H3: n= 10 (V), n= 12 (L, PA), and n= 8 (GW) wells were analyzed. H4: n= 7 (V, GW), n= 6 (L), and n= 9 (PA) wells were analyzed. Age, gender, and BMI are specified to the right of the bar graph panel.
g–j, Human crypt-derived organoids after ex vivo treatment with PA, L, or GW induced PPAR-d target gene expression as assessed in passaged cultures with qRT-PCR (_n_=4, 12 wells per sample were analyzed, all fold changes are significant, P<0.05).
(Unless otherwise indicated, data reflect mean ± s.d. from n independent experiments; *P<0.05, **P<0.01, ***P<0.001; scale bar in c=100μm, f=500μm. ISCs= intestinal stem cells; V= vehicle; PA= palmitic acid; OA= oleic acid; L= lipid mixture; GW= PPAR-d agonist, GW501516)
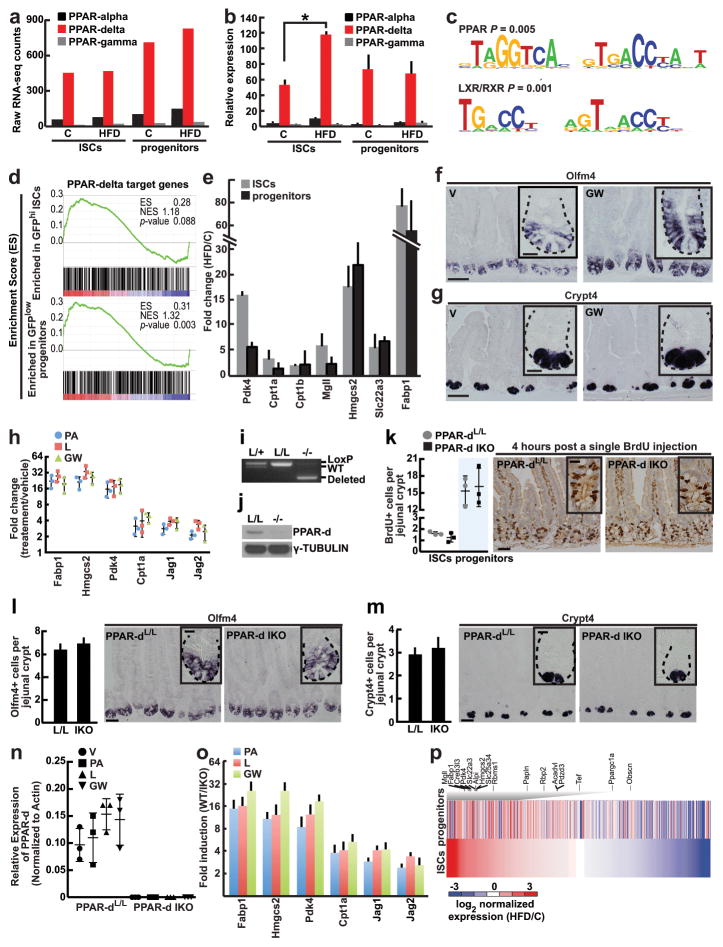
Extended Data Figure 6. PPAR-d is the predominant PPAR family member expressed in intestinal progenitors and mediates the effects of HFD.
a, PPAR-d is the most abundant PPAR family member in ISCs (Lgr5-GFPhi) and progenitors (Lgr5-GFPlow) based on RNA-seq data.
b, Confirmation of PPAR family member mRNA expression levels in ISCs (Lgr5-GFPhi) and progenitors (Lgr5-GFPlow) by qRT-PCR (_n_=5).
c, Genes upregulated in HFD ISCs (Lgr5-GFPhi) versus control ISCs were enriched in PPAR and LXR/RXR motifs.
d, GSEA of RNA-seq data identified enrichment of PPAR-d targets in ISCs (Lgr5-GFPhi) and progenitors (Lgr5-GFPlow) with a HFD.
e, Confirmation of induced PPAR-d target gene expression in flow sorted ISCs (Lgr5-GFPhi) and progenitors (Lgr5-GFPlow) by qRT-PCR (_n=_5). All fold changes were significant with P<0.05.
f, g, Representative images of Olfm4+ (ISCs, f) and Crypt4+ (Paneth cells, g) in situ hybridization (ISH) from V and GW-treated mice (f, _n_=3; g, _n_=4).
h, Ex vivo exposure of organoids to PA, L, or GW stimulated PPAR-d and β-catenin target gene expression (_n_=3, all fold changes were significant with P<0.05).
i, j, Injection with tamoxifen (4 injections on alternating days) in PpardL/L; Villin-CreERT2 mice led to efficient intestinal deletion (IKO) of Ppard (7 days after the last tamoxifen dose) as assessed by allele-specific deletion PCR (i, _n_=3) and immunoblot analysis (j, _n_=3) of crypts. For western blot source data, see Supplementary Figure 1.
k, Acute disruption of Ppard (8 days after the last tamoxifen dose) did not perturb ISC and progenitor proliferation as determined 4-hours following BrdU administration (_n=_3).
l, m, Acute Ppard deletion (8 days after the last tamoxifen dose) did not significantly alter Olfm4+ ISCs numbers (L/L: n=5, IKO: n=4) (l) or Crypt4+ Paneth cell (n=5) (m) numbers as assessed by in situ hybridization.
n, Loss of Ppard transcripts in PPAR-d IKO organoids was confirmed by qRT-PCR using deletion-specific primers (n=3).
o, PPAR-d is required for the induction of PPAR-d and β-catenin target gene expression in secondary organoids after ex vivo PA, L, or GW treatment (n=5, all fold changes are significant with P<0.05)
p, Heat map of differentially expressed genes illustrated induction of a PPAR-d program in HFD-derived ISCs and progenitors relative to controls (C).
(Unless otherwise indicated, data reflect mean ± s.d. from n independent experiments; *P<0.05, scale bars in f, g, k–m=50μm and 20μm (inset); 50 crypts per sample were analyzed in each independent experiment (f, g, k–m). ISCs= intestinal stem cells; C= control; _Olfm4_= _Olfactomedin 4; Crypt4_= Cryptdin4; HFD= high fat diet; V= vehicle; PA= palmitic acid; L= lipid mixture; GW= PPAR-d agonist, GW501516)
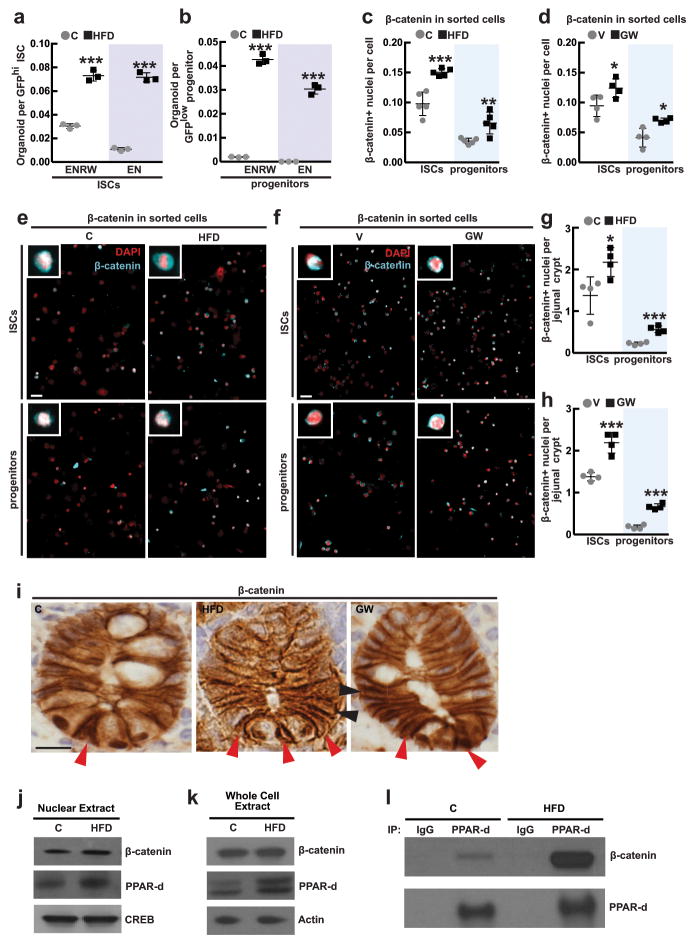
Extended Data Figure 7. HFD and PPAR-d signaling boost nuclear β-catenin localization and activity in intestinal progenitors.
a, b, HFD-derived ISCs (a, Lgr5-GFPhi) and progenitors (b, Lgr5-GFPlow) required less Wnt3a and R-spondin to initiate organoids compared to C ISCs as measured by comparing organoid-formation in complete ENRW media, which includes EGF, Noggin, R-spondin, and Wnt3a, versus EN media, which includes EGF and Noggin but lacks Wnt3a and R-spondin (_n_=3). C-derived progenitors, in contrast to HFD-derived progenitors, rarely formed organoids in either ENRW or EN media.
c–f, HFD increased nuclear β-catenin localization in flow sorted ISCs and progenitors from HFD (c, _n_=5) and GW-treated (d, _n_=4) mice as determined by immunofluorescence (red=DAPI, cyan=non-phosphorylated β-catenin, CST 8814S). At least 100 cells per sample were quantified. Representative images are shown in (e, f).
g–i, HFD (g) and GW (h) treatment increased the numbers of ISCs and progenitors with β-catenin+ nuclei as assessed by immunostains (_n_=4 each). Representative images are shown in (i); arrowheads indicate representative nuclear β-catenin in ISCs (red) and progenitors (black).
j–l, Association of PPAR-d and β-catenin in C and HFD derived intestinal crypts as shown by immunoprecipitation (IP) (n=3). For western blot source data, see Supplementary Figure 1.
(Unless otherwise indicated, data reflect mean ± s.d. from n independent experiments; *P<0.05, **P<0.01, ***P<0.001; scale bars in e,f=50μm i=20μm; organoid assays: 2–4 wells per sample analyzed (a, b), 50 crypts per sample were analyzed in each independent experiment (g, h). ISCs= intestinal stem cells; C= control; HFD= high fat diet; V= vehicle; GW= PPAR-d agonist, GW501516)
Extended Data Figure 8. HFD-mediated alterations in β-catenin target gene expression in single ISCs and progenitors.
a, Heat map representation of β-catenin target gene expression in single ISCs (Lgr5-GFPhi, 24 cells) and progenitors (Lgr5-GFPlow, 72 cells; See Materials and Methods).
b, Stem-cell signature genes were identified by comparing target gene expression in C ISCs (Lgr5-GFPhi) to C progenitors (Lgr5-GFPlow).
c, HFD signature genes were identified by comparing target gene expression in HFD to C ISCs (Lgr5-GFPhi).
d, t-Distributed stochastic neighbor embedding (t-SNE) analysis of single cells using all β-catenin target genes.
e, tSNE analysis of single cells using stem-cell signature genes.
f, tSNE analysis of single cells using HFD signature genes.
g, h, Lgr5 expression was similar in HFD ISCs (Lgr5-GFPhi) (g) and progenitors (Lgr5-GFPlow) (h) as compared to their respective controls.
i, j, HFD increased the percentage of ISCs (Lgr5-GFPhi) (i) and progenitors (Lgr5-GFPlow) (j) with elevated Jag1 and Jag2 expression compared to their respective controls.
k, l, HFD (k, _n_=3) and GW treatment (l, _n=_4) augmented Jag1 expression compared to C and V treatments, respectively, as assayed by single-molecule in situ hybridization: Jag1 is broadly expressed throughout the crypt.
(Unless otherwise indicated, data reflect mean ± s.d. from n independent experiments; *P<0.05; scale bars in k, l=50μm and 20μm (inset); more than 50 crypts per sample were analyzed in each independent experiment (k, l). ISCs= intestinal stem cells; C= control; HFD= high fat diet; V= vehicle; GW= PPAR-d agonist, GW501516)
Extended Data Figure 9. Characterization of obese db/db mouse intestines.
a–f, At 4–5 months of age, homozygous db/db gained on average 50% more mass (a, _n_=9), had increased small intestinal mass and length (b, c _n_=9), shallower crypts (d, _n_=4) and longer villi (e, f _n_=5) when compared to control db/+ mice.
g–h, Immunostains for Olfm4 (_n=_6) and lysozyme (_n=_6) revealed a slight reduction in the number of Olfm4+ ISCs and Paneth cells, respectively, in db/db mice compared to db/+ controls.
i, Organoid-forming capacity of db/db crypts trended higher (_P_=0.095) compared to db/+ controls (_n=_7).
j, Single-cell gene expression analysis revealed no induction of PPAR-d or β-catenin target gene expression in live, enriched stem and progenitor cells that are depleted of secretory cells (7-AAD−Epcam+CD24−c−kit− cells, 48 cells per group; See Materials and Methods) from db/db intestines compared to control intestines.
(Unless otherwise indicated, data reflect mean ± s.d. from n independent experiments; *P<0.05, **P<0.01, ***P<0.001; scale bars in f=100μm, g–h=50μm and 20μm (inset), i=200μm; and at least 30 crypts (d); 20 villi (e); 100 crypts (g, h) were assessed per sample in each independent experiment. All db/db and db/+ mice were fed a standard chow diet. ISCs= intestinal stem cells; OLFM4= Olfactomedin 4)
Extended Data Figure 10. PPAR-d activation bestows adenoma-initiating capacity to _Apc_-null progenitors.
a, b, Representative optical endoscopy images (top) from Figure 5 with H&E (middle), and β-catenin (immunohistochemistry, bottom) sections of adenomas derived from orthotopic transplantation of _Apc_-null ISCs (a, Lgr5-GFPhi) and progenitors (b, Lgr5-GFPlow) from V and GW-treated mice 4 days post Apc deletion. Tumors exhibited hyperchromasia, lack of maturation, nuclear crowding, and nuclear β-catenin positivity. Two independent pathologists blinded to treatment groups interpreted the results.
c, d. Apc deletion was confirmed in sorted small intestinal ISCs and progenitors from V and GW-treated ApcL/L; Lgr5-EGFP-IRES-CreERT2 mice 4 days after tamoxifen administration (c, _n_=3) and in isolated tumors (d, _n_=3) by PCR amplification using allele-specific deletion primers targeting exon14.
(Unless otherwise indicated, n represents independent experiments; scale bars in a (20X)=50μm and (60X)=20μm. ISCs= intestinal stem cells; V= vehicle; GW= PPAR-d agonist, GW501516)
Supplementary Material
supp_data
supp_guide
supp_information
Acknowledgments
This work was supported by the Howard Hughes Medical Institute (SHO and DMS), Ellison Medical Foundation Aging grant (DMS), NIH (R01 CA103866 and AI47389; DMS), NIH (K08 CA198002; JR), Department of Defense PRCRP Career Development Award CA120198 (JR), NIH (R00 AG045144; OHY), NIH (R00 AG041765; DWL), Center for the Study of Inflammatory Bowel Diseases from the Massachusetts General Hospital NIH (DK043351; OHY), NIH Cancer Center Support (core) grant P30-CA14051 (OHY), Kathy and Curt Marble Cancer Research Fund (OHY), American Federation of Aging Research (AFAR; OHY), and V Foundation Scholar grant (JR and OHY). MDM is supported by a Koch MIT Ludwig Center post-doctoral fellowship, DK receives fellowship support from MGH (T32DK007191), and MMM is a Robert Black Fellow of the Damon Runyon Cancer Research Foundation. We thank the Koch Institute Swanson Biotechnology Center (SBC) for technical support, specifically the Hope Babette Tang (1983) Histology Facility and Kathleen Cormier. We thank Sven Holder for superior histology and help with special stains. We thank Patti Wisniewski and Glenn Paradis of the Whitehead flow cytometry and Koch core facilities, respectively, for their expertise in cell sorting. We thank members of the Yilmaz lab for discussions.
Footnotes
The authors declare no competing financial interests.
RNA-sequencing data have been deposited in the GEO database under accession number GSE67324.
Author Contributions
OHY, SB, MDM, and JR performed all experiments, and participated in the design and interpretation of experiments. JR optimized the colonoscopy transplantation assay with help from AA, MDM, and OHY. SJH performed the mRNA-sequencing and its analysis with help from GB, SB, LP and YK. KBR, AA and MDM performed and interpreted all of the immunohistochemistry and in situ hybridization under the guidance of OHY. SB performed the single cell analysis with assistance from MEX, RD, GG, GCY and AS. MS and GPN performed electron microscopy and helped with its interpretation. SS, VD, and OHY performed all pathology on the mice with help from JR and participated in design and interpretation of experiments. MEX, EA, RD, MAR, MMM, and DWL supplied high fat diet mice and provided experimental support. CF and NG provided assistance with the acquisition of human samples, while DK performed and interpreted all of the human culture experiments. SHO and DMS participated in the design and interpretation of experiments. OHY wrote the paper with support from SB, MDM, and JR.
References
- 1.Yilmaz OH, et al. mTORC1 in the Paneth cell niche couples intestinal stem-cell function to calorie intake. Nature. 2012;486:490–495. doi: 10.1038/nature11163. [DOI] [PMC free article] [PubMed] [Google Scholar]
- 2.Barker N, et al. Identification of stem cells in small intestine and colon by marker gene Lgr5. Nature. 2007;449:1003–1007. doi: 10.1038/nature06196. nature06196 [pii] [DOI] [PubMed] [Google Scholar]
- 3.Mihaylova MM, Sabatini DM, Yilmaz OH. Dietary and metabolic control of stem cell function in physiology and cancer. Cell stem cell. 2014;14:292–305. doi: 10.1016/j.stem.2014.02.008. [DOI] [PMC free article] [PubMed] [Google Scholar]
- 4.Sato T, et al. Paneth cells constitute the niche for Lgr5 stem cells in intestinal crypts. Nature. 2011;469:415–418. doi: 10.1038/nature09637. [DOI] [PMC free article] [PubMed] [Google Scholar]
- 5.Finucane MM, et al. National, regional, and global trends in body-mass index since 1980: systematic analysis of health examination surveys and epidemiological studies with 960 country-years and 9.1 million participants. Lancet. 2011;377:557–567. doi: 10.1016/S0140-6736(10)62037-5. [DOI] [PMC free article] [PubMed] [Google Scholar]
- 6.Calle EE, Kaaks R. Overweight, obesity and cancer: epidemiological evidence and proposed mechanisms. Nature reviews. Cancer. 2004;4:579–591. doi: 10.1038/nrc1408. [DOI] [PubMed] [Google Scholar]
- 7.Baltgalvis KA, Berger FG, Pena MM, Davis JM, Carson JA. The interaction of a high-fat diet and regular moderate intensity exercise on intestinal polyp development in Apc Min/+ mice. Cancer prevention research. 2009;2:641–649. doi: 10.1158/1940-6207.CAPR-09-0017. [DOI] [PMC free article] [PubMed] [Google Scholar]
- 8.Barker N, et al. Crypt stem cells as the cells-of-origin of intestinal cancer. Nature. 2009;457:608–611. doi: 10.1038/nature07602. nature07602 [pii] [DOI] [PubMed] [Google Scholar]
- 9.Schwitalla S, et al. Intestinal tumorigenesis initiated by dedifferentiation and acquisition of stem-cell-like properties. Cell. 2013;152:25–38. doi: 10.1016/j.cell.2012.12.012. [DOI] [PubMed] [Google Scholar]
- 10.Eckel-Mahan KL, et al. Reprogramming of the circadian clock by nutritional challenge. Cell. 2013;155:1464–1478. doi: 10.1016/j.cell.2013.11.034. [DOI] [PMC free article] [PubMed] [Google Scholar]
- 11.Winzell MS, Ahren B. The high-fat diet-fed mouse: a model for studying mechanisms and treatment of impaired glucose tolerance and type 2 diabetes. Diabetes. 2004;53(Suppl 3):S215–219. doi: 10.2337/diabetes.53.suppl_3.s215. [DOI] [PubMed] [Google Scholar]
- 12.Schuijers J, van der Flier LG, van Es J, Clevers H. Robust cre-mediated recombination in small intestinal stem cells utilizing the olfm4 locus. Stem cell reports. 2014;3:234–241. doi: 10.1016/j.stemcr.2014.05.018. [DOI] [PMC free article] [PubMed] [Google Scholar]
- 13.Sato T, et al. Single Lgr5 stem cells build crypt-villus structures in vitro without a mesenchymal niche. Nature. 2009 doi: 10.1038/nature07935. nature07935 [pii] [DOI] [PubMed] [Google Scholar]
- 14.Schuijers J, et al. Ascl2 Acts as an R-spondin/Wnt-Responsive Switch to Control Stemness in Intestinal Crypts. Cell stem cell. 2015;16:158–170. doi: 10.1016/j.stem.2014.12.006. [DOI] [PubMed] [Google Scholar]
- 15.Marsh V, et al. Epithelial Pten is dispensable for intestinal homeostasis but suppresses adenoma development and progression after Apc mutation. Nature genetics. 2008;40:1436–1444. doi: 10.1038/ng.256. ng.256 [pii] [DOI] [PubMed] [Google Scholar]
- 16.Buettner R, et al. Defining high-fat-diet rat models: metabolic and molecular effects of different fat types. Journal of molecular endocrinology. 2006;36:485–501. doi: 10.1677/jme.1.01909. [DOI] [PubMed] [Google Scholar]
- 17.Peters JM, Shah YM, Gonzalez FJ. The role of peroxisome proliferator-activated receptors in carcinogenesis and chemoprevention. Nature reviews. Cancer. 2012;12:181–195. doi: 10.1038/nrc3214. [DOI] [PMC free article] [PubMed] [Google Scholar]
- 18.Tontonoz P, Spiegelman BM. Fat and beyond: the diverse biology of PPARgamma. Annual review of biochemistry. 2008;77:289–312. doi: 10.1146/annurev.biochem.77.061307.091829. [DOI] [PubMed] [Google Scholar]
- 19.Neels JG, Grimaldi PA. Physiological functions of peroxisome proliferator-activated receptor beta. Physiological reviews. 2014;94:795–858. doi: 10.1152/physrev.00027.2013. [DOI] [PubMed] [Google Scholar]
- 20.Ito K, et al. A PML-PPAR-delta pathway for fatty acid oxidation regulates hematopoietic stem cell maintenance. Nature medicine. 2012;18:1350–1358. doi: 10.1038/nm.2882. [DOI] [PMC free article] [PubMed] [Google Scholar]
- 21.Narkar VA, et al. AMPK and PPARdelta agonists are exercise mimetics. Cell. 2008;134:405–415. doi: 10.1016/j.cell.2008.06.051. [DOI] [PMC free article] [PubMed] [Google Scholar]
- 22.van der Flier LG, Clevers H. Stem Cells, Self-Renewal, and Differentiation in the Intestinal Epithelium. Annual review of physiology. 2008 doi: 10.1146/annurev.physiol.010908.163145. [DOI] [PubMed] [Google Scholar]
- 23.van der Flier LG, et al. Transcription factor achaete scute-like 2 controls intestinal stem cell fate. Cell. 2009;136:903–912. doi: 10.1016/j.cell.2009.01.031. S0092-8674(09)00079-8 [pii] [DOI] [PubMed] [Google Scholar]
- 24.Munoz J, et al. The Lgr5 intestinal stem cell signature: robust expression of proposed quiescent ‘+4’ cell markers. The EMBO journal. 2012;31:3079–3091. doi: 10.1038/emboj.2012.166. [DOI] [PMC free article] [PubMed] [Google Scholar]
- 25.Tomasetti C, Vogelstein B. Cancer etiology. Variation in cancer risk among tissues can be explained by the number of stem cell divisions. Science. 2015;347:78–81. doi: 10.1126/science.1260825. [DOI] [PMC free article] [PubMed] [Google Scholar]
- 26.Yilmaz OH, et al. Pten dependence distinguishes haematopoietic stem cells from leukaemia-initiating cells. Nature. 2006;441:475–482. doi: 10.1038/nature04703. [DOI] [PubMed] [Google Scholar]
- 27.Meacham CE, Morrison SJ. Tumour heterogeneity and cancer cell plasticity. Nature. 2013;501:328–337. doi: 10.1038/nature12624. [DOI] [PMC free article] [PubMed] [Google Scholar]
- 28.Scholtysek C, et al. PPARbeta/delta governs Wnt signaling and bone turnover. Nature medicine. 2013;19:608–613. doi: 10.1038/nm.3146. [DOI] [PubMed] [Google Scholar]
- 29.Rodilla V, et al. Jagged1 is the pathological link between Wnt and Notch pathways in colorectal cancer. Proceedings of the National Academy of Sciences of the United States of America. 2009;106:6315–6320. doi: 10.1073/pnas.0813221106. [DOI] [PMC free article] [PubMed] [Google Scholar]
- 30.Kumar SR, et al. Preferential induction of EphB4 over EphB2 and its implication in colorectal cancer progression. Cancer research. 2009;69:3736–3745. doi: 10.1158/0008-5472.CAN-08-3232. [DOI] [PubMed] [Google Scholar]
- 31.Kim JS, et al. Oncogenic beta-catenin is required for bone morphogenetic protein 4 expression in human cancer cells. Cancer research. 2002;62:2744–2748. [PubMed] [Google Scholar]
- 32.Wu S, Powers S, Zhu W, Hannun YA. Substantial contribution of extrinsic risk factors to cancer development. Nature. 2016;529:43–47. doi: 10.1038/nature16166. [DOI] [PMC free article] [PubMed] [Google Scholar]
- 33.Mah AT, Van Landeghem L, Gavin HE, Magness ST, Lund PK. Impact of diet-induced obesity on intestinal stem cells: hyperproliferation but impaired intrinsic function that requires insulin/IGF1. Endocrinology. 2014;155:3302–3314. doi: 10.1210/en.2014-1112. [DOI] [PMC free article] [PubMed] [Google Scholar]
- 34.Johnson AM, et al. High fat diet causes depletion of intestinal eosinophils associated with intestinal permeability. PloS one. 2015;10:e0122195. doi: 10.1371/journal.pone.0122195. [DOI] [PMC free article] [PubMed] [Google Scholar]
- 35.Wang D, et al. Peroxisome proliferator-activated receptor delta promotes colonic inflammation and tumor growth. Proceedings of the National Academy of Sciences of the United States of America. 2014;111:7084–7089. doi: 10.1073/pnas.1324233111. [DOI] [PMC free article] [PubMed] [Google Scholar]
- 36.Wang D, et al. Crosstalk between peroxisome proliferator-activated receptor delta and VEGF stimulates cancer progression. Proceedings of the National Academy of Sciences of the United States of America. 2006;103:19069–19074. doi: 10.1073/pnas.0607948103. [DOI] [PMC free article] [PubMed] [Google Scholar]
- 37.Park BH, Vogelstein B, Kinzler KW. Genetic disruption of PPARdelta decreases the tumorigenicity of human colon cancer cells. Proceedings of the National Academy of Sciences of the United States of America. 2001;98:2598–2603. doi: 10.1073/pnas.051630998. [DOI] [PMC free article] [PubMed] [Google Scholar]
- 38.Zuo X, et al. Targeted genetic disruption of peroxisome proliferator-activated receptor-delta and colonic tumorigenesis. Journal of the National Cancer Institute. 2009;101:762–767. doi: 10.1093/jnci/djp078. [DOI] [PMC free article] [PubMed] [Google Scholar]
- 39.Gupta RA, et al. Activation of nuclear hormone receptor peroxisome proliferator-activated receptor-delta accelerates intestinal adenoma growth. Nature medicine. 2004;10:245–247. doi: 10.1038/nm993. [DOI] [PubMed] [Google Scholar]
- 40.Barak Y, et al. Effects of peroxisome proliferator-activated receptor delta on placentation, adiposity, and colorectal cancer. Proceedings of the National Academy of Sciences of the United States of America. 2002;99:303–308. doi: 10.1073/pnas.012610299. [DOI] [PMC free article] [PubMed] [Google Scholar]
- 41.Colnot S, et al. Colorectal cancers in a new mouse model of familial adenomatous polyposis: influence of genetic and environmental modifiers. Laboratory investigation; a journal of technical methods and pathology. 2004;84:1619–1630. doi: 10.1038/labinvest.3700180. [DOI] [PubMed] [Google Scholar]
- 42.Gregorieff A, Clevers H. In situ hybridization to identify gut stem cells. Current protocols in stem cell biology. 2010;Chapter 2(Unit 2F):1. doi: 10.1002/9780470151808.sc02f01s12. [DOI] [PubMed] [Google Scholar]
- 43.Miyoshi H, Stappenbeck TS. In vitro expansion and genetic modification of gastrointestinal stem cells in spheroid culture. Nature protocols. 2013;8:2471–2482. doi: 10.1038/nprot.2013.153. [DOI] [PMC free article] [PubMed] [Google Scholar]
- 44.Trapnell C, Pachter L, Salzberg SL. TopHat: discovering splice junctions with RNA-Seq. Bioinformatics. 2009;25:1105–1111. doi: 10.1093/bioinformatics/btp120. [DOI] [PMC free article] [PubMed] [Google Scholar]
- 45.Anders S, Huber W. Differential expression analysis for sequence count data. Genome biology. 2010;11:R106. doi: 10.1186/gb-2010-11-10-r106. [DOI] [PMC free article] [PubMed] [Google Scholar]
- 46.Pinello L, Xu J, Orkin SH, Yuan GC. Analysis of chromatin-state plasticity identifies cell-type-specific regulators of H3K27me3 patterns. Proceedings of the National Academy of Sciences of the United States of America. 2014;111:E344–353. doi: 10.1073/pnas.1322570111. [DOI] [PMC free article] [PubMed] [Google Scholar]
- 47.van der Maaten L, Hinton G. Visualizing Data using t-SNE. J Mach Learn Res. 2008;9:2579–2605. [Google Scholar]
- 48.Benjamini Y, Hochberg Y. Controlling the False Discovery Rate - a Practical and Powerful Approach to Multiple Testing. J Roy Stat Soc B Met. 1995;57:289–300. [Google Scholar]
Associated Data
This section collects any data citations, data availability statements, or supplementary materials included in this article.
Supplementary Materials
supp_data
supp_guide
supp_information
