kfoldLoss - Loss for cross-validated partitioned regression model - MATLAB (original) (raw)
Loss for cross-validated partitioned regression model
Syntax
Description
[L](#mw%5Fbe5bc174-ac24-4796-ade9-c14ffbdad428) = kfoldLoss([CVMdl](#bsu1qsf-1%5Fsep%5Fmw%5F6577e588-b931-4d13-a896-01d344a3d171)) returns the loss (mean squared error) obtained by the cross-validated regression modelCVMdl. For every fold, kfoldLoss computes the loss for validation-fold observations using a model trained on training-fold observations.CVMdl.X and CVMdl.Y contain both sets of observations.
[L](#mw%5Fbe5bc174-ac24-4796-ade9-c14ffbdad428) = kfoldLoss([CVMdl](#bsu1qsf-1%5Fsep%5Fmw%5F6577e588-b931-4d13-a896-01d344a3d171),[Name,Value](#namevaluepairarguments)) returns the loss with additional options specified by one or more name-value arguments. For example, you can specify a custom loss function.
Examples
Find the cross-validation loss for a regression ensemble of the carsmall data.
Load the carsmall data set and select displacement, horsepower, and vehicle weight as predictors.
load carsmall X = [Displacement Horsepower Weight];
Train an ensemble of regression trees.
rens = fitrensemble(X,MPG);
Create a cross-validated ensemble from rens and find the k-fold cross-validation loss.
rng(10,'twister') % For reproducibility cvrens = crossval(rens); L = kfoldLoss(cvrens)
The mean squared error (MSE) is a measure of model quality. Examine the MSE for each fold of a cross-validated regression model.
Load the carsmall data set. Specify the predictor X and the response data Y.
load carsmall X = [Cylinders Displacement Horsepower Weight]; Y = MPG;
Train a cross-validated regression tree model. By default, the software implements 10-fold cross-validation.
rng('default') % For reproducibility CVMdl = fitrtree(X,Y,'CrossVal','on');
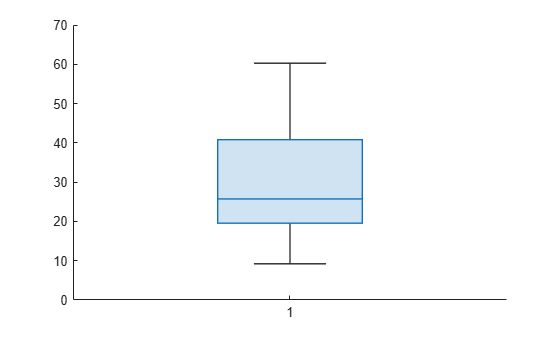
Compute the MSE for each fold. Visualize the distribution of the loss values by using a box plot. Notice that none of the values is an outlier.
losses = kfoldLoss(CVMdl,'Mode','individual')
losses = 10×1
42.5072 20.3995 22.3737 34.4255 40.8005 60.2755 19.5562 9.2060 29.0788 16.3386
Train a cross-validated generalized additive model (GAM) with 10 folds. Then, use kfoldLoss to compute the cumulative cross-validation regression loss (mean squared errors). Use the errors to determine the optimal number of trees per predictor (linear term for predictor) and the optimal number of trees per interaction term.
Alternatively, you can find optimal values of fitrgam name-value arguments by using the OptimizeHyperparameters name-value argument. For an example, see Optimize GAM Using OptimizeHyperparameters.
Load the patients data set.
Create a table that contains the predictor variables (Age, Diastolic, Smoker, Weight, Gender, and SelfAssessedHealthStatus) and the response variable (Systolic).
tbl = table(Age,Diastolic,Smoker,Weight,Gender,SelfAssessedHealthStatus,Systolic);
Create a cross-validated GAM by using the default cross-validation option. Specify the 'CrossVal' name-value argument as 'on'. Also, specify to include 5 interaction terms.
rng('default') % For reproducibility CVMdl = fitrgam(tbl,'Systolic','CrossVal','on','Interactions',5);
If you specify 'Mode' as 'cumulative' for kfoldLoss, then the function returns cumulative errors, which are the average errors across all folds obtained using the same number of trees for each fold. Display the number of trees for each fold.
ans = struct with fields: PredictorTrees: [300 300 300 300 300 300 300 300 300 300] InteractionTrees: [76 100 100 100 100 42 100 100 59 100]
kfoldLoss can compute cumulative errors using up to 300 predictor trees and 42 interaction trees.
Plot the cumulative, 10-fold cross-validated, mean squared errors. Specify 'IncludeInteractions' as false to exclude interaction terms from the computation.
L_noInteractions = kfoldLoss(CVMdl,'Mode','cumulative','IncludeInteractions',false); figure plot(0:min(CVMdl.NumTrainedPerFold.PredictorTrees),L_noInteractions)
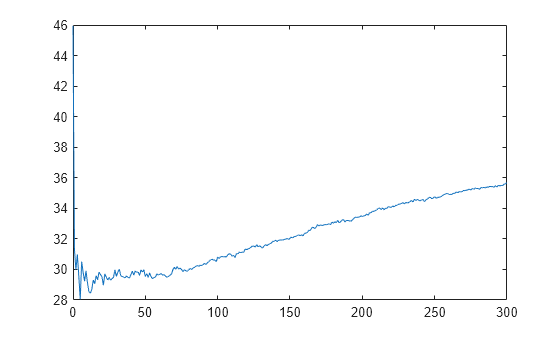
The first element of L_noInteractions is the average error over all folds obtained using only the intercept (constant) term. The (J+1)th element of L_noInteractions is the average error obtained using the intercept term and the first J predictor trees per linear term. Plotting the cumulative loss allows you to monitor how the error changes as the number of predictor trees in the GAM increases.
Find the minimum error and the number of predictor trees used to achieve the minimum error.
[M,I] = min(L_noInteractions)
The GAM achieves the minimum error when it includes 5 predictor trees.
Compute the cumulative mean squared error using both linear terms and interaction terms.
L = kfoldLoss(CVMdl,'Mode','cumulative'); figure plot(0:min(CVMdl.NumTrainedPerFold.InteractionTrees),L)
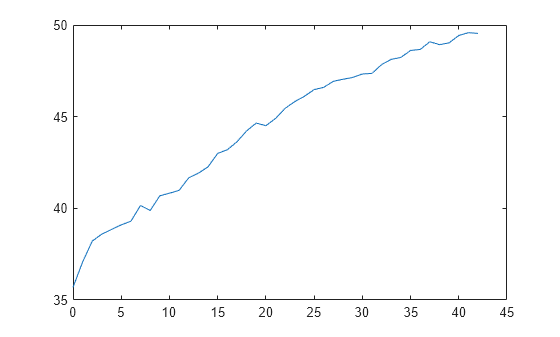
The first element of L is the average error over all folds obtained using the intercept (constant) term and all predictor trees per linear term. The (J+1)th element of L is the average error obtained using the intercept term, all predictor trees per linear term, and the first J interaction trees per interaction term. The plot shows that the error increases when interaction terms are added.
If you are satisfied with the error when the number of predictor trees is 5, you can create a predictive model by training the univariate GAM again and specifying 'NumTreesPerPredictor',5 without cross-validation.
Input Arguments
Name-Value Arguments
Specify optional pairs of arguments asName1=Value1,...,NameN=ValueN, where Name is the argument name and Value is the corresponding value. Name-value arguments must appear after other arguments, but the order of the pairs does not matter.
Before R2021a, use commas to separate each name and value, and enclose Name in quotes.
Example: kfoldLoss(CVMdl,'Folds',[1 2 3 5]) specifies to use the first, second, third, and fifth folds to compute the mean squared error, but to exclude the fourth fold.
Fold indices to use, specified as a positive integer vector. The elements of Folds must be within the range from 1 to CVMdl.KFold.
The software uses only the folds specified in Folds.
Example: 'Folds',[1 4 10]
Data Types: single | double
Flag to include interaction terms of the model, specified as true orfalse. This argument is valid only for a generalized additive model (GAM). That is, you can specify this argument only whenCVMdl is RegressionPartitionedGAM.
The default value is true if the models inCVMdl (CVMdl.Trained) contain interaction terms. The value must be false if the models do not contain interaction terms.
Example: 'IncludeInteractions',false
Data Types: logical
Loss function, specified as 'mse' or a function handle.
- Specify the built-in function
'mse'. In this case, the loss function is the mean squared error. - Specify your own function using function handle notation.
Assume that n is the number of observations in the training data (CVMdl.NumObservations). Your function must have the signaturelossvalue =_`lossfun`_(Y,Yfit,W), where:- The output argument
lossvalueis a scalar. - You specify the function name (
lossfun). Yis an _n_-by-1 numeric vector of observed responses.Yfitis an _n_-by-1 numeric vector of predicted responses.Wis an n_-by-1 numeric vector of observation weights.
Specify your function using`` 'LossFun',@lossfun_ ``.
- The output argument
Data Types: char | string | function_handle
Aggregation level for the output, specified as 'average','individual', or 'cumulative'.
| Value | Description |
|---|---|
| 'average' | The output is a scalar average over all folds. |
| 'individual' | The output is a vector of length k containing one value per fold, where k is the number of folds. |
| 'cumulative' | NoteIf you want to specify this value, CVMdl must be a RegressionPartitionedEnsemble object orRegressionPartitionedGAM object. If CVMdl isRegressionPartitionedEnsemble, then the output is a vector of length min(CVMdl.NumTrainedPerFold). Each element j is an average over all folds that the function obtains by using ensembles trained with weak learners1:j.If CVMdl isRegressionPartitionedGAM, then the output value depends on the IncludeInteractions value. If IncludeInteractions isfalse, then L is a(1 + min(NumTrainedPerFold.PredictorTrees))-by-1 numeric column vector. The first element ofL is an average over all folds that is obtained using only the intercept (constant) term. The(j + 1)th element ofL is an average obtained using the intercept term and the first j predictor trees per linear term.If IncludeInteractions istrue, then L is a(1 + min(NumTrainedPerFold.InteractionTrees))-by-1 numeric column vector. The first element ofL is an average over all folds that is obtained using the intercept (constant) term and all predictor trees per linear term. The(j + 1)th element ofL is an average obtained using the intercept term, all predictor trees per linear term, and the first j interaction trees per interaction term. |
Example: 'Mode','individual'
Since R2023b
Predicted response value to use for observations with missing predictor values, specified as "median", "mean","omitted", or a numeric scalar. This argument is valid only for a Gaussian process regression, neural network, or support vector machine model. That is, you can specify this argument only when CVMdl is aRegressionPartitionedGP,RegressionPartitionedNeuralNetwork, orRegressionPartitionedSVM object.
| Value | Description |
|---|---|
| "median" | kfoldLoss uses the median of the observed response values in the training-fold data as the predicted response value for observations with missing predictor values.This value is the default when CVMdl is aRegressionPartitionedGP,RegressionPartitionedNeuralNetwork, orRegressionPartitionedSVM object. |
| "mean" | kfoldLoss uses the mean of the observed response values in the training-fold data as the predicted response value for observations with missing predictor values. |
| "omitted" | kfoldLoss excludes observations with missing predictor values from the loss computation. |
| Numeric scalar | kfoldLoss uses this value as the predicted response value for observations with missing predictor values. |
If an observation is missing an observed response value or an observation weight, then kfoldLoss does not use the observation in the loss computation.
Example: "PredictionForMissingValue","omitted"
Data Types: single | double | char | string
Output Arguments
Loss, returned as a numeric scalar or numeric column vector.
By default, the loss is the mean squared error between the validation-fold observations and the predictions made with a regression model trained on the training-fold observations.
- If Mode is
'average', thenLis the average loss over all folds. - If
Modeis'individual', thenLis a _k_-by-1 numeric column vector containing the loss for each fold, where k is the number of folds. - If
Modeis'cumulative'andCVMdl isRegressionPartitionedEnsemble, thenLis amin(CVMdl.NumTrainedPerFold)-by-1 numeric column vector. Each elementjis the average loss over all folds that the function obtains using ensembles trained with weak learners1:j. - If
Modeis'cumulative'andCVMdlisRegressionPartitionedGAM, then the output value depends on the IncludeInteractions value.- If
IncludeInteractionsisfalse, thenLis a(1 + min(NumTrainedPerFold.PredictorTrees))-by-1 numeric column vector. The first element ofLis the average loss over all folds that is obtained using only the intercept (constant) term. The(j + 1)th element ofLis the average loss obtained using the intercept term and the firstjpredictor trees per linear term. - If
IncludeInteractionsistrue, thenLis a(1 + min(NumTrainedPerFold.InteractionTrees))-by-1 numeric column vector. The first element ofLis the average loss over all folds that is obtained using the intercept (constant) term and all predictor trees per linear term. The(j + 1)th element ofLis the average loss obtained using the intercept term, all predictor trees per linear term, and the firstjinteraction trees per interaction term.
- If
Alternative Functionality
If you want to compute the cross-validated loss of a tree model, you can avoid constructing a RegressionPartitionedModel object by calling cvloss. Creating a cross-validated tree object can save you time if you plan to examine it more than once.
Extended Capabilities
Usage notes and limitations:
- This function fully supports GPU arrays for the following models.
- RegressionPartitionedEnsemble
- RegressionPartitionedNeuralNetwork
- RegressionPartitionedModel object fitted using fitrtree, or by passing aRegressionTree object tocrossval
- RegressionPartitionedSVM
For more information, see Run MATLAB Functions on a GPU (Parallel Computing Toolbox).
Version History
Introduced in R2011a
Starting in R2023b, when you predict or compute the loss, some regression models allow you to specify the predicted response value for observations with missing predictor values. Specify the PredictionForMissingValue name-value argument to use a numeric scalar, the training set median, or the training set mean as the predicted value. When computing the loss, you can also specify to omit observations with missing predictor values.
This table lists the object functions that support thePredictionForMissingValue name-value argument. By default, the functions use the training set median as the predicted response value for observations with missing predictor values.
| Model Type | Model Objects | Object Functions |
|---|---|---|
| Gaussian process regression (GPR) model | RegressionGP, CompactRegressionGP | loss, predict, resubLoss, resubPredict |
| RegressionPartitionedGP | kfoldLoss, kfoldPredict | |
| Gaussian kernel regression model | RegressionKernel | loss, predict |
| RegressionPartitionedKernel | kfoldLoss, kfoldPredict | |
| Linear regression model | RegressionLinear | loss, predict |
| RegressionPartitionedLinear | kfoldLoss, kfoldPredict | |
| Neural network regression model | RegressionNeuralNetwork, CompactRegressionNeuralNetwork | loss, predict, resubLoss, resubPredict |
| RegressionPartitionedNeuralNetwork | kfoldLoss, kfoldPredict | |
| Support vector machine (SVM) regression model | RegressionSVM, CompactRegressionSVM | loss, predict, resubLoss, resubPredict |
| RegressionPartitionedSVM | kfoldLoss, kfoldPredict |
In previous releases, the regression model loss and predict functions listed above used NaN predicted response values for observations with missing predictor values. The software omitted observations with missing predictor values from the resubstitution ("resub") and cross-validation ("kfold") computations for prediction and loss.