RegressionLinear.predict - Predict response of linear regression model - MATLAB (original) (raw)
Class: RegressionLinear
Predict response of linear regression model
Syntax
Description
[YHat](#bu6ufvo-YHat) = predict([Mdl](#bu6ufvo%5Fsep%5Fshared-Mdl),[X](#mw%5F967c41ab-c678-47b4-bc49-dd47f8f19cde)) returns predicted responses for each observation in the predictor data X based on the trained linear regression model Mdl. YHat contains responses for each regularization strength in Mdl.
[YHat](#bu6ufvo-YHat) = predict([Mdl](#bu6ufvo%5Fsep%5Fshared-Mdl),[X](#mw%5F967c41ab-c678-47b4-bc49-dd47f8f19cde),[Name,Value](#namevaluepairarguments)) specifies additional options using one or more name-value arguments. For example, specify that columns in the predictor data correspond to observations.
Input Arguments
Linear regression model, specified as a RegressionLinear model object. You can create a RegressionLinear model object using fitrlinear.
Predictor data used to generate responses, specified as a full or sparse numeric matrix or a table.
By default, each row of X corresponds to one observation, and each column corresponds to one variable.
- For a numeric matrix:
- The variables in the columns of
Xmust have the same order as the predictor variables that trained Mdl. - If you train
Mdlusing a table (for example,Tbl) andTblcontains only numeric predictor variables, thenXcan be a numeric matrix. To treat numeric predictors inTblas categorical during training, identify categorical predictors by using theCategoricalPredictors name-value pair argument of fitrlinear. IfTblcontains heterogeneous predictor variables (for example, numeric and categorical data types) andXis a numeric matrix, thenpredictthrows an error.
- The variables in the columns of
- For a table:
predictdoes not support multicolumn variables or cell arrays other than cell arrays of character vectors.- If you train
Mdlusing a table (for example,Tbl), then all predictor variables inXmust have the same variable names and data types as the variables that trainedMdl(stored inMdl.PredictorNames). However, the column order ofXdoes not need to correspond to the column order ofTbl. Also,TblandXcan contain additional variables (response variables, observation weights, and so on), butpredictignores them. - If you train
Mdlusing a numeric matrix, then the predictor names inMdl.PredictorNamesmust be the same as the corresponding predictor variable names inX. To specify predictor names during training, use the PredictorNames name-value pair argument offitrlinear. All predictor variables inXmust be numeric vectors.Xcan contain additional variables (response variables, observation weights, and so on), butpredictignores them.
Note
If you orient your predictor matrix so that observations correspond to columns and specify "ObservationsIn","columns", then you might experience a significant reduction in optimization execution time. You cannot specify "ObservationsIn","columns" for predictor data in a table.
Data Types: double | single | table
Name-Value Arguments
Specify optional pairs of arguments asName1=Value1,...,NameN=ValueN, where Name is the argument name and Value is the corresponding value. Name-value arguments must appear after other arguments, but the order of the pairs does not matter.
Before R2021a, use commas to separate each name and value, and enclose Name in quotes.
Example: predict(Mdl,X,"ObservationsIn","columns") indicates that columns in the predictor data correspond to observations.
Predictor data observation dimension, specified as"columns" or "rows".
Note
If you orient your predictor matrix so that observations correspond to columns and specify"ObservationsIn","columns", then you might experience a significant reduction in optimization execution time. You cannot specify "ObservationsIn","columns" for predictor data in a table.
Data Types: char | string
Since R2023b
Predicted response value to use for observations with missing predictor values, specified as "median", "mean", or a numeric scalar.
| Value | Description |
|---|---|
| "median" | predict uses the median of the observed response values in the training data as the predicted response value for observations with missing predictor values. |
| "mean" | predict uses the mean of the observed response values in the training data as the predicted response value for observations with missing predictor values. |
| Numeric scalar | predict uses this value as the predicted response value for observations with missing predictor values. |
Example: PredictionForMissingValue="mean"
Example: PredictionForMissingValue=NaN
Data Types: single | double | char | string
Output Arguments
Predicted responses, returned as a n_-by-L numeric matrix. n is the number of observations in X and L is the number of regularization strengths in Mdl.Lambda. `` YHat(i,j) is the response for observation _`i`_ using the linear regression model that has regularization strength Mdl.Lambda(j_) ``.
The predicted response using the model with regularization strength j is y^j=xβj+bj.
- x is an observation from the predictor data matrix
X, and is row vector. - βj is the estimated column vector of coefficients. The software stores this vector in
Mdl.Beta(:,_`j`_). - bj is the estimated, scalar bias, which the software stores in
Mdl.Bias(_`j`_).
Examples
Simulate 10000 observations from this model
y=x100+2x200+e.
- X=x1,...,x1000 is a 10000-by-1000 sparse matrix with 10% nonzero standard normal elements.
- e is random normal error with mean 0 and standard deviation 0.3.
rng(1) % For reproducibility n = 1e4; d = 1e3; nz = 0.1; X = sprandn(n,d,nz); Y = X(:,100) + 2X(:,200) + 0.3randn(n,1);
Train a linear regression model. Reserve 30% of the observations as a holdout sample.
CVMdl = fitrlinear(X,Y,'Holdout',0.3); Mdl = CVMdl.Trained{1}
Mdl = RegressionLinear ResponseName: 'Y' ResponseTransform: 'none' Beta: [1000×1 double] Bias: -0.0066 Lambda: 1.4286e-04 Learner: 'svm'
Properties, Methods
CVMdl is a RegressionPartitionedLinear model. It contains the property Trained, which is a 1-by-1 cell array holding a RegressionLinear model that the software trained using the training set.
Extract the training and test data from the partition definition.
trainIdx = training(CVMdl.Partition); testIdx = test(CVMdl.Partition);
Predict the training- and test-sample responses.
yHatTrain = predict(Mdl,X(trainIdx,:)); yHatTest = predict(Mdl,X(testIdx,:));
Because there is one regularization strength in Mdl, yHatTrain and yHatTest are numeric vectors.
Predict responses from the best-performing, linear regression model that uses a lasso-penalty and least squares.
Simulate 10000 observations as in Predict Test-Sample Responses.
rng(1) % For reproducibility n = 1e4; d = 1e3; nz = 0.1; X = sprandn(n,d,nz); Y = X(:,100) + 2X(:,200) + 0.3randn(n,1);
Create a set of 15 logarithmically-spaced regularization strengths from 10-5 through 10-1.
Lambda = logspace(-5,-1,15);
Cross-validate the models. To increase execution speed, transpose the predictor data and specify that the observations are in columns. Optimize the objective function using SpaRSA.
X = X'; CVMdl = fitrlinear(X,Y,'ObservationsIn','columns','KFold',5,'Lambda',Lambda,... 'Learner','leastsquares','Solver','sparsa','Regularization','lasso');
numCLModels = numel(CVMdl.Trained)
CVMdl is a RegressionPartitionedLinear model. Because fitrlinear implements 5-fold cross-validation, CVMdl contains 5 RegressionLinear models that the software trains on each fold.
Display the first trained linear regression model.
Mdl1 = RegressionLinear ResponseName: 'Y' ResponseTransform: 'none' Beta: [1000×15 double] Bias: [-0.0049 -0.0049 -0.0049 -0.0049 -0.0049 -0.0048 -0.0044 -0.0037 -0.0030 -0.0031 -0.0033 -0.0036 -0.0041 -0.0051 -0.0071] Lambda: [1.0000e-05 1.9307e-05 3.7276e-05 7.1969e-05 1.3895e-04 2.6827e-04 5.1795e-04 1.0000e-03 0.0019 0.0037 0.0072 0.0139 0.0268 0.0518 0.1000] Learner: 'leastsquares'
Properties, Methods
Mdl1 is a RegressionLinear model object. fitrlinear constructed Mdl1 by training on the first four folds. Because Lambda is a sequence of regularization strengths, you can think of Mdl1 as 11 models, one for each regularization strength in Lambda.
Estimate the cross-validated MSE.
Higher values of Lambda lead to predictor variable sparsity, which is a good quality of a regression model. For each regularization strength, train a linear regression model using the entire data set and the same options as when you cross-validated the models. Determine the number of nonzero coefficients per model.
Mdl = fitrlinear(X,Y,'ObservationsIn','columns','Lambda',Lambda,... 'Learner','leastsquares','Solver','sparsa','Regularization','lasso'); numNZCoeff = sum(Mdl.Beta~=0);
In the same figure, plot the cross-validated MSE and frequency of nonzero coefficients for each regularization strength. Plot all variables on the log scale.
figure; [h,hL1,hL2] = plotyy(log10(Lambda),log10(mse),... log10(Lambda),log10(numNZCoeff)); hL1.Marker = 'o'; hL2.Marker = 'o'; ylabel(h(1),'log_{10} MSE') ylabel(h(2),'log_{10} nonzero-coefficient frequency') xlabel('log_{10} Lambda') hold off
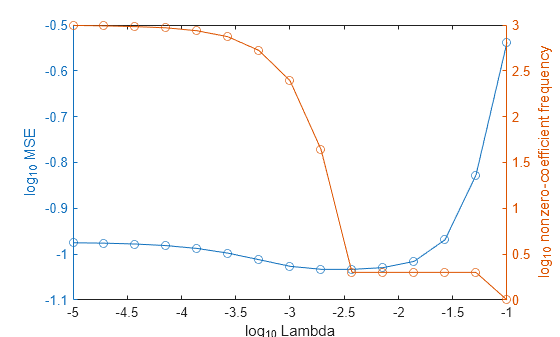
Choose the index of the regularization strength that balances predictor variable sparsity and low MSE (for example, Lambda(10)).
Extract the model with corresponding to the minimal MSE.
MdlFinal = selectModels(Mdl,idxFinal)
MdlFinal = RegressionLinear ResponseName: 'Y' ResponseTransform: 'none' Beta: [1000×1 double] Bias: -0.0050 Lambda: 0.0037 Learner: 'leastsquares'
Properties, Methods
idxNZCoeff = find(MdlFinal.Beta~=0)
EstCoeff = Mdl.Beta(idxNZCoeff)
EstCoeff = 2×1
1.0051
1.9965
MdlFinal is a RegressionLinear model with one regularization strength. The nonzero coefficients EstCoeff are close to the coefficients that simulated the data.
Simulate 10 new observations, and predict corresponding responses using the best-performing model.
XNew = sprandn(d,10,nz); YHat = predict(MdlFinal,XNew,'ObservationsIn','columns');
Alternative Functionality
Simulink Block
To integrate the prediction of a linear regression model into Simulink®, you can use the RegressionLinear Predict block in the Statistics and Machine Learning Toolbox™ library or a MATLAB® Function block with the predict function. For examples, see Predict Responses Using RegressionLinear Predict Block and Predict Class Labels Using MATLAB Function Block.
When deciding which approach to use, consider the following:
- If you use the Statistics and Machine Learning Toolbox library block, you can use the Fixed-Point Tool (Fixed-Point Designer) to convert a floating-point model to fixed point.
- Support for variable-size arrays must be enabled for a MATLAB Function block with the
predictfunction. - If you use a MATLAB Function block, you can use MATLAB functions for preprocessing or post-processing before or after predictions in the same MATLAB Function block.
Extended Capabilities
Thepredict function supports tall arrays with the following usage notes and limitations:
predictdoes not support talltabledata.
For more information, see Tall Arrays.
Usage notes and limitations:
You can generate C/C++ code for both
predictandupdateby using a coder configurer. Or, generate code only forpredictby usingsaveLearnerForCoder,loadLearnerForCoder, andcodegen.- Code generation for
predictand update — Create a coder configurer by using learnerCoderConfigurer and then generate code by using generateCode. Then you can update model parameters in the generated code without having to regenerate the code. - Code generation for
predict— Save a trained model by using saveLearnerForCoder. Define an entry-point function that loads the saved model by using loadLearnerForCoder and calls thepredictfunction. Then use codegen (MATLAB Coder) to generate code for the entry-point function.
- Code generation for
To generate single-precision C/C++ code for
predict, specifyDataType="single"when you call the loadLearnerForCoder function.This table contains notes about the arguments of
predict. Arguments not included in this table are fully supported.Argument Notes and Limitations Mdl For the usage notes and limitations of the model object, see Code Generation of the RegressionLinear object. X For general code generation, X must be a single-precision or double-precision matrix or a table containing numeric variables, categorical variables, or both.In the coder configurer workflow, X must be a single-precision or double-precision matrix.The number of observations inX can be a variable size, but the number of variables in X must be fixed.If you want to specify X as a table, then your model must be trained using a table, and your entry-point function for prediction must do the following: Accept data as arrays.Create a table from the data input arguments and specify the variable names in the table.Pass the table to predict.For an example of this table workflow, see Generate Code to Classify Data in Table. For more information on using tables in code generation, see Code Generation for Tables (MATLAB Coder) and Table Limitations for Code Generation (MATLAB Coder). Name-value arguments Names in name-value arguments must be compile-time constants.TheObservationsIn value must be a compile-time constant. For example, to use"ObservationsIn","columns" in the generated code, include{coder.Constant("ObservationsIn"),coder.Constant("columns")} in the -args value of codegen (MATLAB Coder).If the value of PredictionForMissingValue is nonnumeric, then it must be a compile-time constant.
For more information, see Introduction to Code Generation.
Version History
Introduced in R2016a
Starting in R2024a, predict accepts GPU array input arguments with some limitations.
Starting in R2023b, when you predict or compute the loss, some regression models allow you to specify the predicted response value for observations with missing predictor values. Specify the PredictionForMissingValue name-value argument to use a numeric scalar, the training set median, or the training set mean as the predicted value. When computing the loss, you can also specify to omit observations with missing predictor values.
This table lists the object functions that support thePredictionForMissingValue name-value argument. By default, the functions use the training set median as the predicted response value for observations with missing predictor values.
| Model Type | Model Objects | Object Functions |
|---|---|---|
| Gaussian process regression (GPR) model | RegressionGP, CompactRegressionGP | loss, predict, resubLoss, resubPredict |
| RegressionPartitionedGP | kfoldLoss, kfoldPredict | |
| Gaussian kernel regression model | RegressionKernel | loss, predict |
| RegressionPartitionedKernel | kfoldLoss, kfoldPredict | |
| Linear regression model | RegressionLinear | loss, predict |
| RegressionPartitionedLinear | kfoldLoss, kfoldPredict | |
| Neural network regression model | RegressionNeuralNetwork, CompactRegressionNeuralNetwork | loss, predict, resubLoss, resubPredict |
| RegressionPartitionedNeuralNetwork | kfoldLoss, kfoldPredict | |
| Support vector machine (SVM) regression model | RegressionSVM, CompactRegressionSVM | loss, predict, resubLoss, resubPredict |
| RegressionPartitionedSVM | kfoldLoss, kfoldPredict |
In previous releases, the regression model loss and predict functions listed above used NaN predicted response values for observations with missing predictor values. The software omitted observations with missing predictor values from the resubstitution ("resub") and cross-validation ("kfold") computations for prediction and loss.