Case study: Erbium-doped fiber amplifier for rectangular nanosecond pulses (original) (raw)

Key questions:
- Why and when does gain saturation lead to strong pulse distortions?
- How effectively can that be mitigated with precompensation of the input pulse shape? How to choose a suitable pulse shape?
Design Goal
We want to design an erbium-doped fiber amplifier which can amplify a weak 1 nJ input pulse (3 ns, Gaussian spectrum with 5 nm bandwidth) at a wavelength of 1550 nm. We need an output energy of at least 10 μJ, and the signal output pulse should have a close to rectangular temporal shape.
We can anticipate that for this level of output pulse energy, there will be significant gain saturation during the pulse amplification, which leads to a distortion of the temporal pulse shape. We will thus consider different methods for coping with that challenge.
Initial Attempt
We first simply try with rectangularly shaped signal input pulses.
For the simulations, we use the RP Fiber Power software, which offers the Power Form “Fiber amplifier for continuous-wave signals”. Here, we easily enter the signal input parameters and set some details of the amplifier:
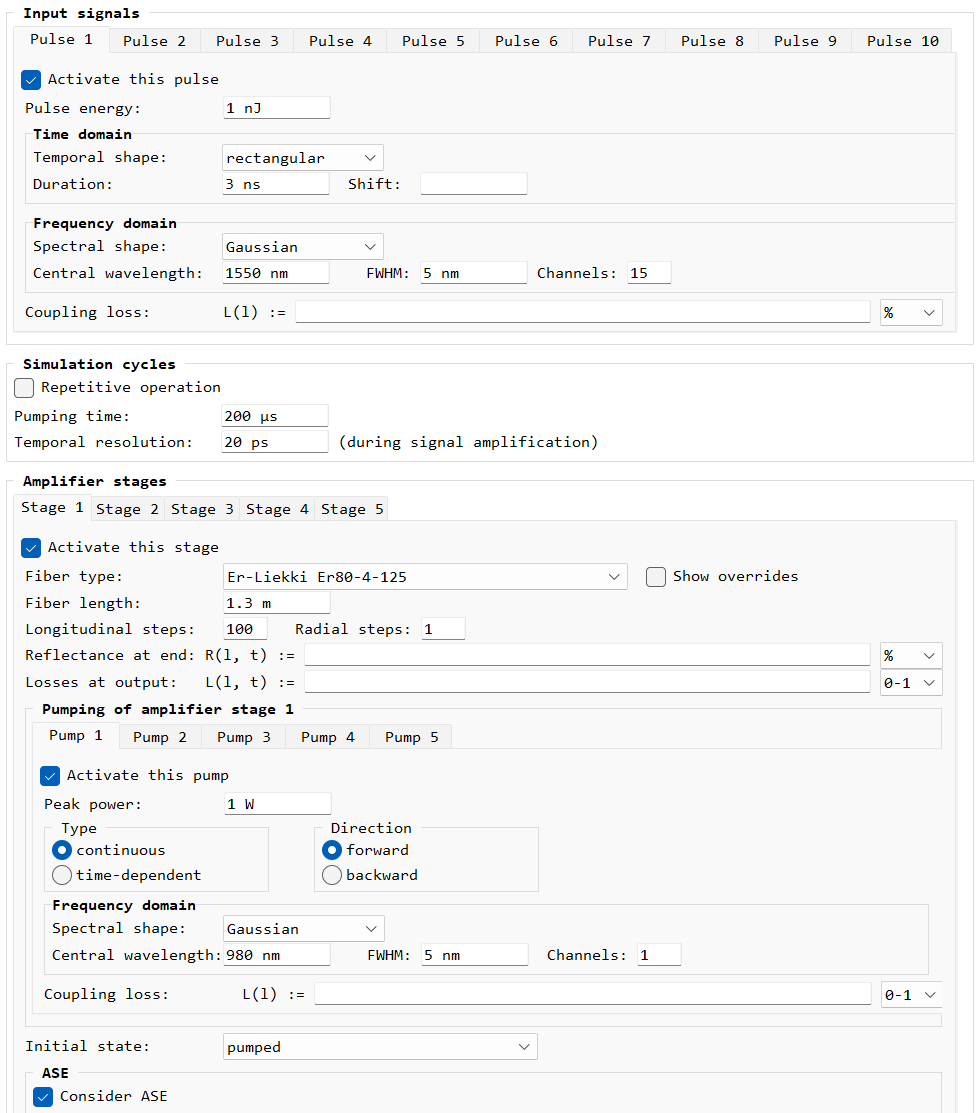
Figure 1: Part of the Power Form, where we specify details of the input signals and the amplifier stages. The input pulse is defined in both the time and frequency domain.
We initially choose from our long list of fiber data the commercial fiber “Liekki Er80-4-125” which has a core diameter of 4 μm. We assume that before pulse amplification the amplifier is pumped for a long enough time with as much as 1 W at 980 nm. In 1.3 m of the fiber, we can absorb most of the pump power. But that doesn't work for our signal: we get less than 9 μJ out, and that pulse is strongly distorted, far from the intended rectangular output:

Figure 2: The time-dependent signal output power with a rectangular temporal shape. The pulse is amplified in an erbium-doped fiber with a core diameter of 4 μm. Gain saturation is related to the drop of the average Er excitation level (gray curve).
You see that the leading edge of the pulse (occurring at −1.5 ns) experiences a substantially higher gain than the trailing edge (at +1.5 ns), because the erbium excitation level drops substantially during the pulse due to energy extraction by the pulse. (One may be surprised that it does not drop more strongly, but note that the curve shows the erbium excitation averaged over the whole fiber length, and strong saturation occurs only near the output end, as the pulse energy is low before the pulse gets there.) Another problem is that we are producing substantial amplified spontaneous emission (ASE), which is wasting much of the used pump power.
So we see that for this substantial output pulse energy, we should use a fiber with larger mode area, resulting in a higher saturation energy. We can simply pick another fiber having 8 μm core diameter, which (for the same glass composition) has a 4 times higher saturation energy. Indeed, that already works much better; with the same fiber length and pump power, we get 14.5 μJ (more than needed). We can now actually reduce the pump power to 500 mW and still get 10.9 μJ; the pulse distortion is also significantly reduced:
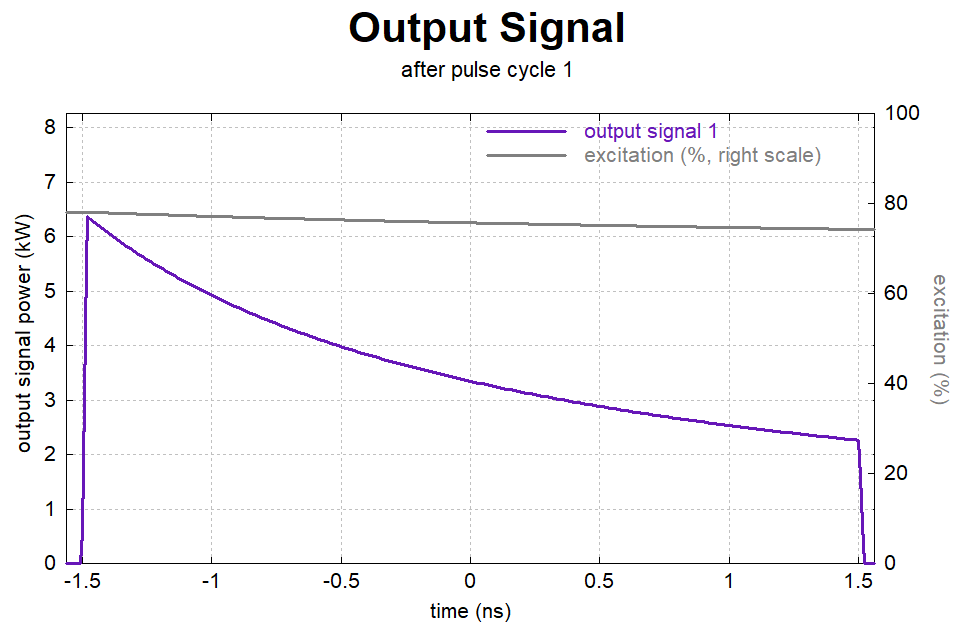
Figure 3: Same as before for a fiber with two times higher core diameter.
Still, this is far from the desired rectangular pulse. We will need to work on this.
In principle, we might try with a fiber having a far larger mode area, minimizing the effect of gain saturation. However, that approach would have its own serious limitations, such as requiring more pump power and making it more difficult to get single-mode operation for best beam quality. (You would hardly find such a fiber on the market.) Therefore, we decide for a different solution:
Pre-compensated Temporal Pulse Shape
The solution is to manipulate the input pulse shape in order to compensate for the shape distortion caused by the gain saturation. The idea is to compensate the lower amplifier gain of the trailing part by increasing the input power. We first try this with the simplest approach: a linear ramp of the signal input power. That is easy to implement with the Power Form:
- Enable a second input pulse (and disable the original pulse), so that we can easily switch between the two pulses to compare.
- Select the user-defined temporal pulse shape and enter a time-dependent expression defining the pulse shape (here, a linear ramp between −1.5 ns and +1.5 ns, Figure 4).

Figure 4: It is easy to define a linear ramp input pulse in the Power Form. We have optimized the slope for best performance.
- Activate the “input signal pulse” diagram to verify that the intended shape is obtained:
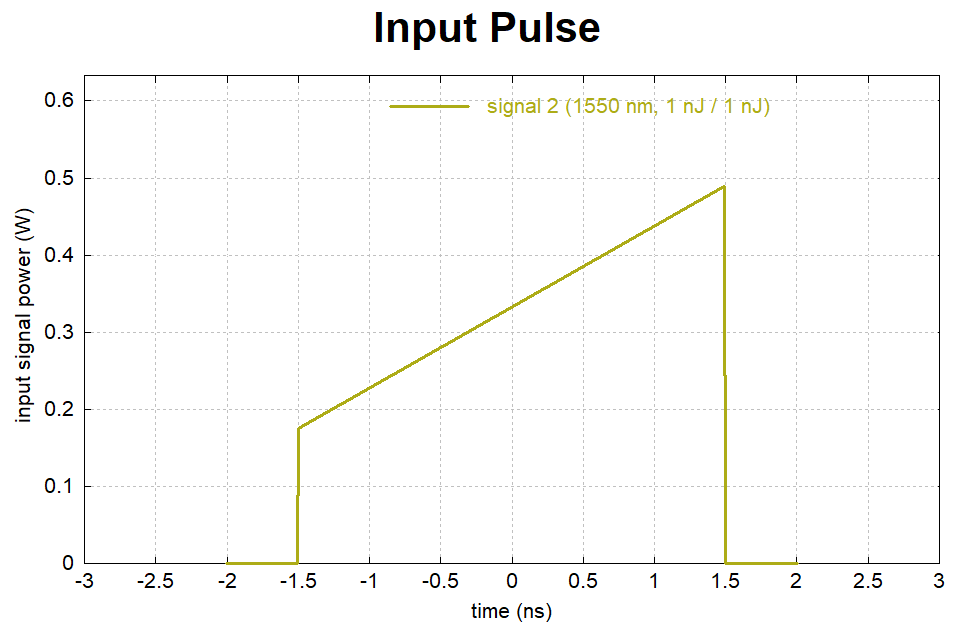
Figure 5: The desired input pulse.
This results in a substantially improved output pulse shape, with an output energy of 10.8 μJ:
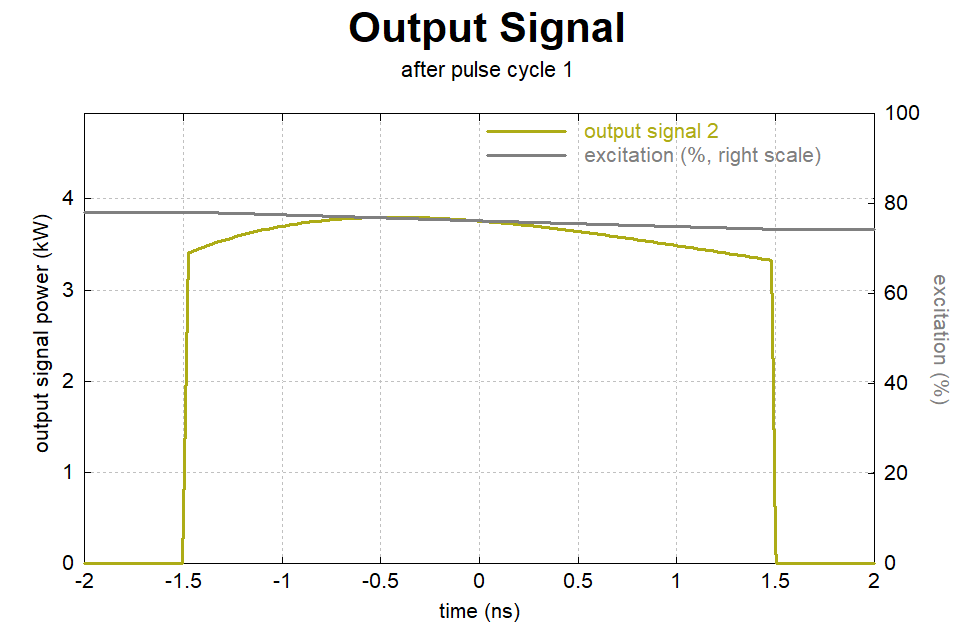
Figure 6: The output pulse obtained with a linear ramp of the input pulse.
However, the pulse shape is still not perfect, as we still see some bow shape. In order to get an even better output pulse shape, we try an exponential ramp of the input signal power. For that, we make a third input pulse, where the time-dependent power is given as if abs(t) < 1.5 ns then exp(t/ns * 0.347):
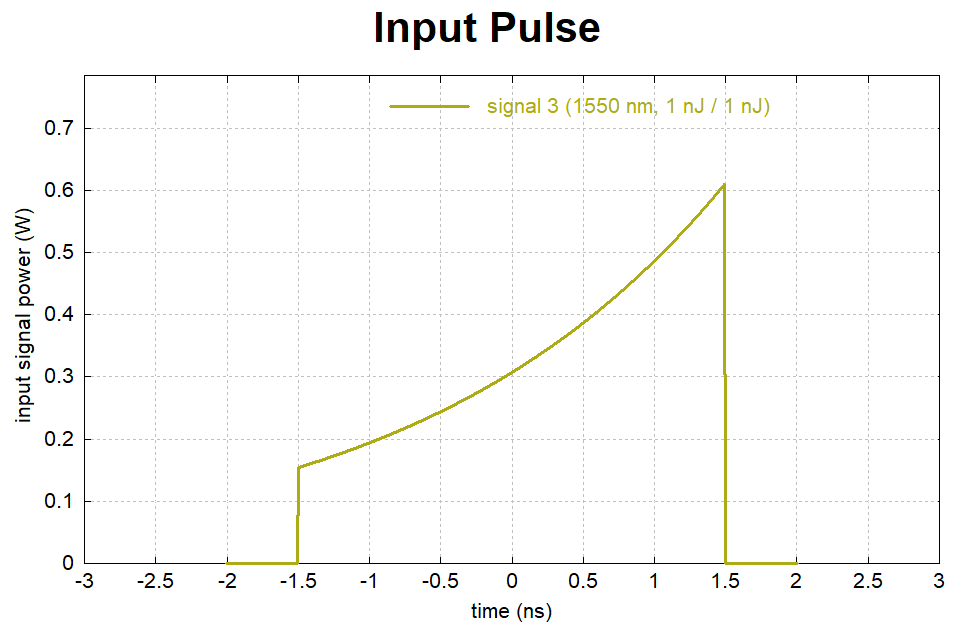
Figure 7: Input pulse with an exponential ramp.
The result is now indeed very good:
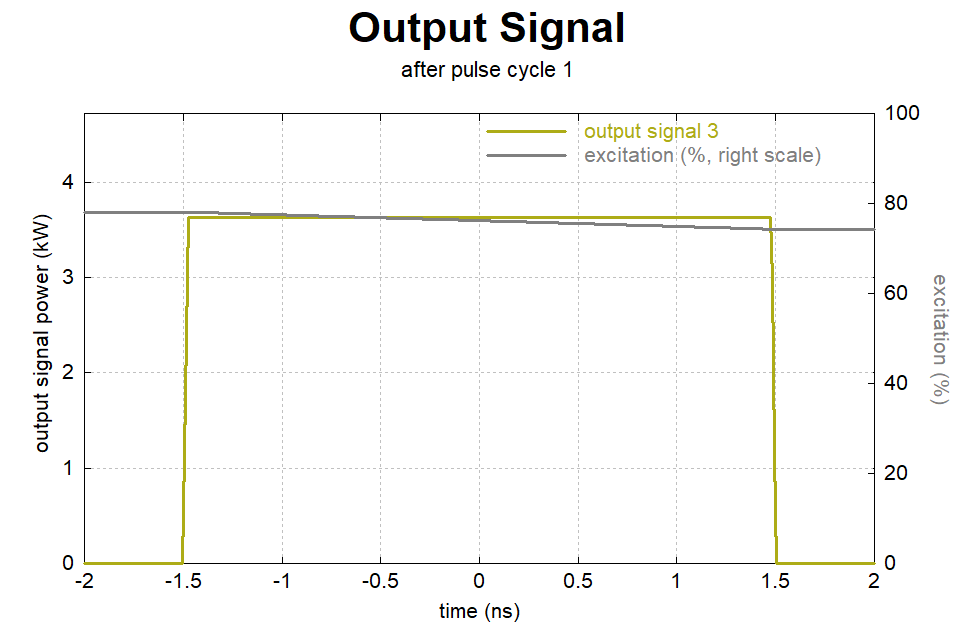
Figure 8: The output pulse obtained with an exponential ramp of the input pulse.
The exponential ramp nearly perfectly compensates for the effect of gain saturation (Figure 7), resulting in a nearly rectangular temporal pulse shape with an output energy of 10.8 μJ, achieving our goal.
Why actually does an exponential ramp work so much better than a linear one? This is because for a constant output power during the pulse, we get an approximately linearly decay of the erbium excitation and the exponential gain coefficient, which translates into an exponential decay of the power amplification factor.
Note that such temporal power ramps can be easily realized with a suitable electronic driver for a laser diode. The output power of a laser diode would closely follow the provided current ramp.
Repetitive Operation
Previously, we only considered amplification of a single pulse, assuming steady-state conditions of the amplifier before the pulse comes. But we can also investigate what happens in repetitive operation – say, with a pulse repetition rate of 5 kHz, corresponding to a pulse period of 200 μs. As that is well below the upper-state lifetime of erbium (here: 9 ms), one will probably expect that the amplifier can by far not recover its fully pumped state between two consecutive pulses. On the other hand, an average output power of 5 kHz · 10.8 μJ = 54 mW is far below the applied pump power of 500 mW. So from that viewpoint, it could work. But does it really?
Let's test it. Simply check “Repetitive operation” in the form, with 8 pumping/amplification cycles, and activate the diagram for the pumping dynamics over all cycles. Further, we now assume that the amplifier is initially unpumped. The result:
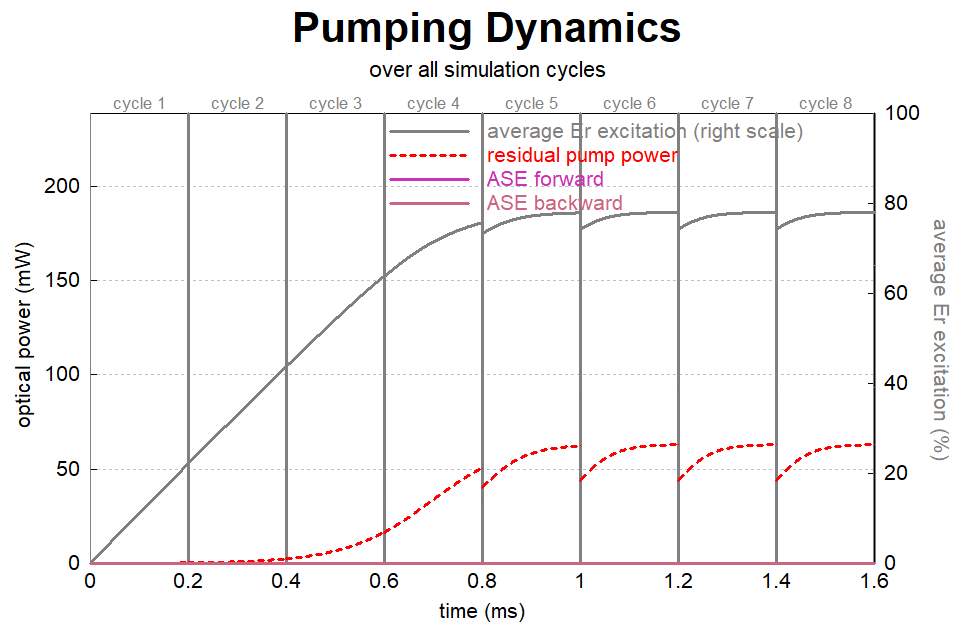
Figure 9: The pumping dynamics over the first eight amplification cycles, starting with an unpumped amplifier.
In the first few cycles, we hardly get any pulse energy out because the amplifier gain is still very small. However, once the steady state has been reached, the recovery of gain after a pulse is rather quick – it largely happens during only 100 μs, i.e., in a time far shorter than the upper-state lifetime. That is possible essentially because we are pumping at a power level far above the pump saturation energy. In this regime, which is often encountered for fiber lasers and amplifiers, certain common rules (e.g., relaxation towards the steady state with a time constant equal to the upper-state lifetime) do no longer hold.
Conclusions
You can learn various things from this study:
- Once the output pulse energy reaches the saturation energy, we get substantial gain saturation effects. These imply efficient energy extraction, but also distortions of the pulse shape.
- With suitable pre-compensation applied to the input pulses, the desired pulse shape can nevertheless be achieved.
- After switching on the amplifier's pump source, it takes a while for the amplifier to reach the steady state in repetitive operation.
With a suitable simulation software, you can easily analyze such aspects and optimize your amplifier design.
Video
Here, you can see how the simulations for this case study were done with our software RP Fiber Power:
Your browser does not support the video tag. However, you can download the video file.
More to Learn
Encyclopedia articles: