5.1 Food (original) (raw)
Worksheets in the FABLE Calculator:
⇒ FOOD
⇒ 7_feas_consohum
⇒ 1_data_demand
The main food indicator is the average calorie consumption per capita per day (kcal/cap/day). We also compute proteins and fats consumption in grams per capita per day. We start from the feasible total consumption for each product (cf. Feasible consumption), multiply it by the share of the total consumption that is for food, subtract food waste at the household level, divide by the population to get the average per capita consumption and by the number of days per year to get the average daily consumption (cf. Human demand). Finally, we multiply the average daily consumption per capita by the calorie content of each product. Kilocalorie content per product per country is taken from the FAO Food Balance Sheets for the year 2000.
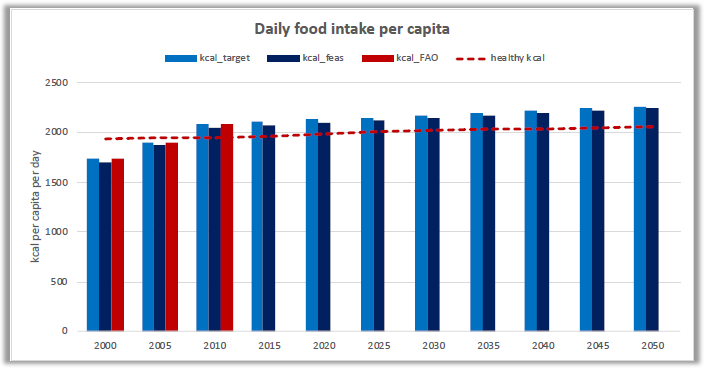
In the FABLE Calculator, the main results related to food are presented in the FOOD worksheet. In the first figure (Figure 12), we display the evolution of the total kcal/cap/day both for the targeted and the feasible levels. The targeted consumption should be equal to the FAO consumption for the historical years*. A difference between the targeted and the feasible food consumption can be due to two reasons: there is not enough land available or production is not represented for some of the products included in the demand (cf. Appendix 1) because there is no data on production in the FABLE Calculator. In this case, a lower feasible consumption than the targeted consumption should be observed for the historical period. If the gap between the targeted and the feasible consumption increases over time, the missing products on the production side are expected to represent a larger share of total consumption and/or the targeted production cannot be met because of land constraints (cf. Land scenarios and Land calculation).
We compare our results on calorie consumption with the historical consumption level according to FAO and the Minimum Daily Energy Requirement (MDER). The daily MDER is computed following FAO guidelines (Cafiero, 2014) using data on the structure of the population by age and sex and the dietary recommendations by age and sex for a certain level of activity. The average MDER at the national level is the sum of the MDER by population group multiplied by the population number in each group (“age-bracket”) divided by the total population**. The dietary requirements are taken from the National Academy of Medicine (formerly the Institute of Medicine) for three different activity levels, low, medium, and high (Institute of Medicine, 2002), and the population structure is taken from the UN DESA medium estimate scenario (2017). The user is free to select the level of preferred activity as part of the scenario selection (cf. Activity of population). An average feasible consumption level below, or just at, the MDER level could be worrying as it would mean that each individual in a given country would have just enough food to cover the minimum requirements if the available food were equally shared across the population.
Figure 12. Average daily food intake per capita at the national level
The evolution of protein and fat intake, in total or by food group, is also monitored in the FABLE Calculator using average protein and fat content by product from FAOSTAT and the average consumption per capita. We notice that the average protein and fat content per product might vary significantly across countries and even for one country across different years. Some of our products are aggregates of several products with different protein and fat content and the weight of each product in the aggregated production might vary over time. There are also different nutrition properties per product variety and different countries might use different varieties of the same product. We compare the computed level with the recommended intake of proteins and fats. For fats the dietary reference intake is 20% to 30% of kilocalorie consumption and for proteins it is 10% to 35% of kilocalorie consumption.
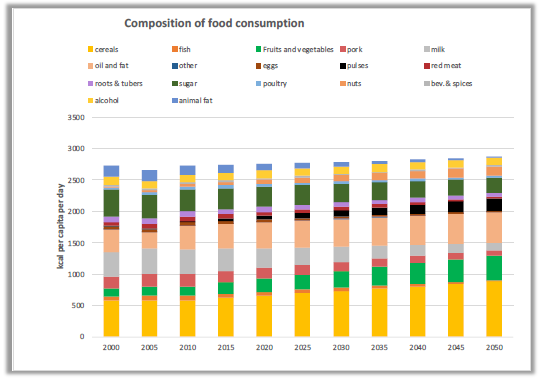
Another figure of the FOOD worksheet presents the average daily kilocalorie consumption per capita per food group (Figure 13). The correspondence between product and food groups is presented in Appendix 1. The results are presented for feasible consumption only. The comparison between the computed feasible consumption by food group and the historical data from the FAO can help identify where a large gap between computed and historical consumption could come from and what should be corrected in the Calculator.
Figure 13. Average daily food intake per capita per food group at the national level
*The calorie intake is computed on the basis of food consumption minus food waste. This can explain some deviations with the reported statistics on food consumption by the FAO which does not take into account these losses at the consumption level. **Because the population level can also depend on a separate growth scenario determined by the user, the number of people in each age-bracket is scaled accordingly. Scaling of populations in age-brackets is simple and linear, meaning that there is no effect on the population age structure across age-brackets (i.e. selecting different population growth scenarios in the Open FABLE Calculator 2020 changes only the number of individuals represented in each age-bracket, not the structure across age-brackets).