5.3 Land (original) (raw)
Worksheet(s) in the FABLE Calculator:
⇒ LAND
⇒ 4_calc_land
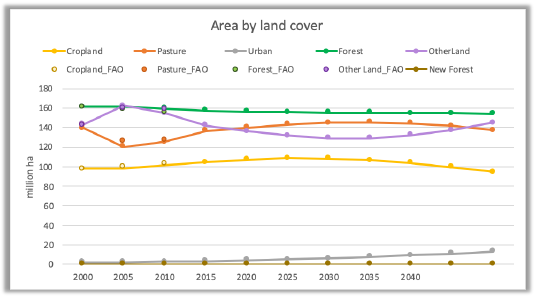
5.3.1 Area in each land cover type
Our main indicator related to land is the evolution of the area of each land cover type (Figure 14). It shows the feasible area in each land cover class (cf. Land) and the historical data. FAOSTAT is used as the default reference. The results of the FABLE Calculator should mimic the historical evolution of land as closely as possible. Discrepancies highlight some potential problems, for instance some problems related to the evolution of the different demand components. Currently, the FABLE Calculator only includes a limited set of products in the animal feed requirements (i.e. the feed demand for some products is not represented, leading to an underestimation of the total demand for these products). For human demand and trade, estimates should be very close to the FAO values as historical data has been used to initialize key parameters (cf. Human demand, Trade). Another known problem is related to the production of by-products during the processing stage that could be used in animal feed, potentially substituting other crops and feedstock.
Figure 14. Area by land cover by year
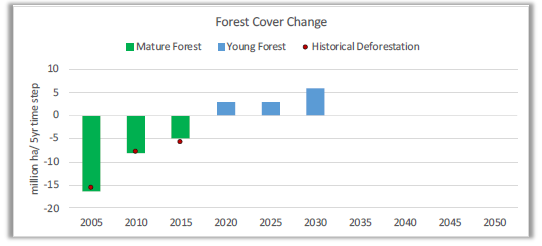
5.3.2 Deforestation
The second indicator is the evolution of forest loss and forest gain by 5 year-time step and the comparison with historical deforestation. By default, historical deforestation is computed from FAOSTAT land cover data. Net forest cover change is the sum of forest loss and forest gain.
Figure 15. Evolution of forest loss and forest gain