Hepatocellular carcinoma (HCC): Epidemiology, etiology and molecular classification (original) (raw)
. Author manuscript; available in PMC: 2022 Jan 28.
Abstract
Hepatocellular carcinoma (HCC), the primary malignancy of hepatocytes, is a diagnosis with bleak outcome. According to National Cancer Institute’s SEER database, the average five-year survival rate of HCC patients in the US is 19.6% but can be as low as 2.5% for advanced, metastatic disease. When diagnosed at early stages, it is treatable with locoregional treatments including surgical resection, Radio-Frequency Ablation, Trans-Arterial Chemoembolization or liver transplantation. However, HCC is usually diagnosed at advanced stages when the tumor is unresectable, making these treatments ineffective. In such instances, systemic therapy with tyrosine kinase inhibitors (TKIs) becomes the only viable option, even though it benefits only 30% of patients, provides only a modest (~3 months) increase in overall survival and causes drug resistance within 6 months. HCC, like many other cancers, is highly heterogeneous making a one-size fits all option problematic. The selection of liver transplantation, locoregional treatment, TKIs or immune checkpoint inhibitors as a treatment strategy depends on the disease stage and underlying condition(s). Additionally, patients with similar disease phenotype can have different molecular etiology making treatment responses different. Stratification of patients at the molecular level would facilitate development of the most effective treatment option. With the increase in efficiency and affordability of “omics”-level analysis, considerable effort has been expended in classifying HCC at the molecular, metabolic and immunologic levels. This review examines the results of these efforts and the ways they can be leveraged to develop targeted treatment options for HCC.
1. Introduction
Liver cancer is the fifth most common cancer and the fourth leading cause of cancer-related deaths worldwide. Among men, it is the fourth most frequent cancer and the second leading cause of cancer-related deaths. Men are at a higher risk of developing liver cancer compared to women. The global HCC incidence ratio of men to women is 2.8:1 (Kulik & El-Serag, 2019). It is worth noting that, despite being only the ninth most common cancer that affects women, it is the fourth leading cause of cancer-related deaths in women, emphasizing its high mortality rate (Bray et al., 2018). There are two main types of primary liver cancers—hepatocellular carcinoma (HCC) and intrahepatic cholangiocarcinoma (ICC), with less frequent cancers like angiosarcoma, hemangiosarcoma and hepatoblastoma. While ICC originates from bile ducts, HCC arises from hepatocytes, the main parenchymal cells of the liver. HCC accounts for more than 80% of primary liver cancer cases worldwide (El-Serag & Rudolph, 2007). Secondary liver cancer occurs when a tumor from another part of the body metastasizes to the liver. Although breast, esophageal, stomach, pancreatic, lung, kidney and several other cancers can metastasize to the liver, most secondary liver cancers originate from colorectal cancers. Approximately 70% of colorectal cancer patients develop secondary liver cancer (Valderrama-Trevino, Barrera-Mera, Ceballos-Villalva, & Montalvo-Jave, 2017).
2. Etiology and risk factors
HCC pathogenesis is complex and involves multiple molecular failures such as cell cycle deregulation, DNA methylation alteration, chromosomal instability, immunomodulation, Epithelial-to-Mesenchymal transition, increase in HCC stem cells and microRNA (miRNA) dysregulation (Hui, Makuuchi, & Li, 1998; Ogunwobi et al., 2019). Although the disease mechanism varies depending on underlying etiology, the usual sequence is liver injury, chronic inflammation, fibrosis, cirrhosis and HCC (Fig. 1). The release of molecular mediators like Damage-Associated Molecular Patterns (DAMPS) from damaged or necrotic cells, and Pathogen-Associated Molecular Patterns (PAMPS) by viruses elicits an innate immune response by activation of Pattern Recognition Receptors (PRR) like Toll-like receptor (TLR), C-type lectin Receptors, Nucleotide-binding Oligomerization Domain (NOD)-like receptors and retinoic acid-inducible gene I (RIG-I)-like receptors present on various immune cells causing an inflammatory response. An acute inflammatory response is resolved once the external stimulus is eliminated, whereas unresolved chronic inflammation can cause fibrosis and eventually cirrhosis (Villanueva & Luedde, 2016). Most HCCs (80–90%) are preceded by a cirrhotic event (Leong & Leong, 2005).
Fig. 1.

An overview of different HCC etiologies and the potential mechanism causing HCC. Created with Biorender.com.
2.1. Viral infections
Chronic hepatitis caused by Hepatitis B Virus (HBV) and Hepatitis C Virus (HCV) infections is an important risk factor for HCC. HBV and HCV are both blood-borne pathogens and HCV can also be transmitted through other body fluids. Needle sharing, perinatal transmission and other routes of blood contact from an infected individual are major routes of transmission. In regions with high prevalence of these infections, HBV/HCV coinfection can occur, further increasing risk of HCC development (Donato, Boffetta, & Puoti, 1998). The World Health Organization (WHO) estimates that 257 million people or 3.3% of the global population lives with chronic HBV infection whereas 71 Million live with chronic HCV infection. In 2018, 54.5% and 21.2% of new global HCC cases were attributable to HBV and HCV infections, respectively (Bray et al., 2018). There is a difference in global prevalence of HBV and HCV that is based on geography.
WHO estimates global HBV prevalence through detection of Hepatitis B Surface Antigen (HBsAg). To facilitate reporting, the world is divided into six WHO regions and the most recent HBV prevalence data from these regions are as follows—Western Pacific Region (6.2%), African Region (6.1%), Eastern Mediterranean Region (3.3%), South-East Asian Region (2%), European Region (1.6%) and the Americas Region (0.7%). Although there is no specific treatment for HBV infection, it is preventable by a safe and effective vaccine that provides 98–100% protection against the virus and antiviral treatments can slow the progression of liver damage. The probability of an acute infection becoming chronic is inversely related to age. If infection occurs before the age of 1, there is an 80–90% chance of chronic infection and the probability drops to 30–50% at 1–6 years of age and less than 5% in adults.
HCV prevalence, on the other hand, is estimated based on the presence of antibodies to HCV in a person’s blood. It is estimated to be the highest (>3.5%) in Central Asia and Central Africa, moderate (1.5–3.5%) in South, East and Southeast Asia, and North, East and West Africa, the Middle East, Southern and Tropical Latin America, the Caribbean (Cuba, Dominican Republic and Puerto Rico), Australasia (Australia and New Zealand), and Eastern Europe and low (<1.5%) in Western and Central Europe, North America, Southern Africa, Andean and Central Latin America and Pacific Asia (Japan and South Korea) (Petruzziello, Marigliano, Loquercio, Cozzolino, & Cacciapuoti, 2016). Roughly 30% of people infected with HCV clear the virus spontaneously within 6months of infection. The remaining 70% of HCV-infected individuals develop chronic HCV infection. More than 95% of HCV-infected people can be cured with antiviral drugs.
2.1.1. Hepatitis B virus
HBV is a hepatotropic virus with a relaxed circular and partially double stranded, 3kb DNA genome encoding four overlapping Open Reading Frames (ORF)—S, C, P and X (Liang, 2009). ORF S encodes the surface antigen HBsAg. ORF C encodes the core protein (HBcAg) that forms the viral nucleocapsid or the precore protein (HBeAg) that directs the translation product to the Endoplasmic Reticulum (ER). ORF P is translated to a multidomain pol protein with terminal, reverse transcriptase and ribonuclease H domains. ORF X produces a regulatory protein that enhances viral gene expression and replication (Liang, 2009). Once HBV is imported into the nucleus of hepatocytes, the viral genome is repaired to form a covalently closed circular DNA (cccDNA). This repaired DNA is then transcribed to form a pregenomic RNA. The pregenomic RNA is encapsulated and reverse transcribed by DNA polymerase to single-stranded linear DNA, which can reproduce the partially double-stranded relaxed circular DNA (rcDNA) in the cytoplasm or form a double stranded linear DNA (dslDNA). The rcDNA is recycled to the nucleus for synthesis of cccDNA or enveloped and released from the hepatocytes. The dslDNA can be integrated into the host genome and this phenomenon occurs in 85–90% of HBV-associated HCC cases (Furuta et al., 2018; Liang, 2009; Tu, Budzinska, Shackel, & Urban, 2017).
Only 5–10% of adults progress to chronic infection, which is defined as persistence of HBsAg for >6months in a patient’s body (Hyams, 1995). A cure for HBV is difficult because of the persistence of the highly stable viral replication intermediate, cccDNA, as a non-integrated episome in the nucleus of infected patients (Zoulim, 2005). Both innate and adaptive immune responses are triggered in response to HBV infection. HBV remains quiescent for a few weeks after infection causing a lack of robust early innate immune responses. Adaptive immunity involving HBV-specific antigens and T cells is the major player in clearing HBV infection (Tan, Koh, & Bertoletti, 2015). Improper T-cell memory maturation causes a lack of HBV antigen-specific T cells and a failure to mount an immune response (Lumley, McNaughton, Klenerman, Lythgoe, & Matthews, 2018). This can cause chronic infection, recurrent liver inflammation, fibrosis, cirrhosis and HCC. HBV integration into the host genome can cause oncogenesis when integration sites are close to genes like human Telomerase Reverse Transcriptase (hTERT) or other genes involved in cell cycle, proliferation and metabolism (Tu et al., 2017). The viral regulatory protein is suspected to have a role in oncogenesis in addition to its role in viral replication. It is involved in modulating oncogenic pathways, chromosomal instability, oxidative stress, DNA methylation, angiogenesis and migration (Tarocchi, Polvani, Marroncini, & Galli, 2014). Cirrhosis develops in 1.3–2.4% of HBV infected patients (Liaw, Tai, Chu, & Chen, 1988) and 3.9% of chronic HBV patients develop HCC (Takano, Yokosuka, Imazeki, Tagawa, & Omata, 1995).
2.1.1.1. Oncogenic properties of HBx
The viral regulatory protein HBx has a role in oncogenesis in addition to its role in viral replication and chromosomal instability. It is involved in modulating oncogenic pathways, oxidative stress, DNA methylation, angiogenesis and migration (Tarocchi et al., 2014). HBx disrupts p53-mediated apoptosis by forming a p53-HBx complex that prevents nuclear localization of p53 (Elmore et al., 1997; Ueda et al., 1995; Wang et al., 1995) and p53 DNA binding (Wang et al., 1994). Cyclooxygenase-2 (COX-2) over-expression by HBx also prevents p53-mediated apoptosis (Cheng, Yu, Lai, Chan, & Sung, 2008). Other anti-apoptotic mechanisms include caspase-3 inactivation via the HBx-PI3K-Akt-Bad pathway (Lee, Kang-Park, Do, & Lee, 2001), survivin accumulation via the p38/MAPK pathway (Kuo & Chao, 2010), and activation of the WNT/β-catenin pathway (Shen et al., 2013). In addition to promoting cellular proliferation by inhibiting apoptosis, HBx causes liver injury by sensitizing cells to apoptosis. HBx promotes oxidative stress-related apoptosis via caspase-3 cascade and loss of anti-apoptotic protein MCL1 (Hu et al., 2011), and can be p53- (Chirillo et al., 1997) or TNFα-mediated (Su & Schneider, 1997). HBx is negatively correlated to E-cadherin, positively correlated to vimentin and increases migration and invasion in vitro (Jin, Wu, et al., 2017). HBx increases transcription of Vascular Endothelial Growth Factor (VEGF) (Lee et al., 2000), angiopoietin (Sanz-Cameno et al., 2006) and increases transcriptional activity of HIF-1α by protein stabilization (Moon et al., 2004) to promote angiogenesis. HBx is also involved in aberrant cell cycle (Lee et al., 2002), increased chromosomal aberration and micronuclei formation (Livezey, Negorev, & Simon, 2002) and abnormal mitotic spindle formation (Forgues et al., 2003; Fujii et al., 2006; Kim et al., 2008; Wen, Golubkov, Strongin, Jiang, & Reed, 2008; Yun et al., 2004). HBx binds to different cellular proteins like Hepatitis B virus X-interacting protein (HBXIP) (Fujii et al., 2006; Wen et al., 2008) and the mitotic checkpoint protein, budding uninhibited by benzimidazol related protein 1 (BubR1), (Kim, Park, et al., 2008) to disrupt spindle formation and chromosome segregation. The RAS/MEK/MAPK pathway is involved in amplification of centrosomes by HBx (Yun et al., 2004).
2.1.1.2. HBV integration and genomic instability
HBV integration into the host genome is random and causes oncogenesis when integration sites are close to genes involved in cell cycle, proliferation and metabolism (Tu et al., 2017). Comparison of paired non-tumor and tumor liver samples have revealed the presence of distinct patterns of increased HBV integration in tumors compared to matched non-tumors (Sung et al., 2012; Zhao et al., 2016). Several frequently altered genes and pathways have been described of which the most recurrent genes are TERT and Mixed Lineage Leukemia Gene Homolog 4 (MLL4) (Ding et al., 2012; Fujimoto et al., 2012; Jin et al., 2019; Shiraishi et al., 2014; Sung et al., 2012; Zhao et al., 2016). Earlier studies suggested random integration of HBV in the host genome and attributed increased expression of an altered gene to positive selection and clonal propagation (Furuta et al., 2018). However, preferred HBV integration sites have also been identified (Zhao et al., 2016). Telomerase, made up of an RNA and a protein (TERT) subunit, prevents telomere shortening in immortal cells and is overexpressed in HCC (Amisaki, Tsuchiya, Sakabe, Fujiwara, & Shiota, 2019). Integration of HBV Enhancer 1 (Enh1) at the TERT promoter enhances telomerase activation (Sze et al., 2020). HBV integration also increases TERT expression by making the promoter responsive to the androgen pathway (Li et al., 2019). HBV HBx integrates into intron 3 of MLL4, a histone methyltransferase, to form HBx/MLL4 fusion protein that downregulates a specific set of genes to promote HCC (Saigo et al., 2008). Integration into exons 3, 5 and 6 and exon-intron boundaries 3 and 5 were later reported (Dong et al., 2015; Sung et al., 2012) and MLL4 expression pattern was found to vary depending on the integration site. In addition to TERT and MLL4, several other altered genes like cyclin E1 (CCNE1), fibronectin 1 (FN1), protein tyrosine phosphatase receptor type D (PTPRD), unc-5 netrin receptor D (UNC5D), neuregulin 3 (NRG3), aryl hydrocarbon receptor repressor (AHRR), Rho guanine nucleotide exchange factor 12 (ARHGEF12), RNA binding Fox-1 homolog 1 (RBFOX1), SMAD5, ADP-ribose/CDP-alcohol diphosphatase (ADPRM), keratin 32 (KRT32) and CDK15 have been reported (Ding et al., 2012; Jin et al., 2019; Shiraishi et al., 2014; Sung et al., 2012; Zhao et al., 2016).
2.1.1.3. miRNAs and HBV-HCC
microRNAs (miR) are small non-coding RNAs that prevent gene expression by RNA silencing. They can act as oncogenes or tumor suppressor genes depending on their target genes. Deregulation of miRNAs occurs in every step of HCC development after HBV infection (Table 1). The miRNA profile of late-stage HCC differs from that of early infection, inflammatory phase or fibrosis. Additionally, miRNAs involved in major pathways like pI3K/MAPK, WNT/β-Catenin, TP53 and JAK/STAT pathways are deregulated during HBV-HCC development (Sartorius et al., 2019). Some of the most frequently upregulated miRNAs in HBV-HCC include miR-18a, miR-21, miR-221, miR-222, and miR-224 and the most commonly down-regulated miRNAs include miR-26a, miR-101, miR-122, miR-125b, miR-145, miR-199a, miR-199b, miR-200a, and miR-223 (Xu, An, Winkler, & Yu, 2020).
Table 1.
A list of miRNAs deregulated in HBV-related HCC.
| miRNA | Deregulation | Genes/pathways regulated | HCC properties regulated | References |
|---|---|---|---|---|
| miR-18a | Upregulated | IRF2, CBX7 and BCL2L10 | Proliferation, migration, and invasion | Wang et al. (2018), Yongyu, Lewei, Jian, and Yuqin (2018) |
| miR-21 | Upregulated | PTEN and KLF5 | Proliferation, migration and invasion | Meng et al. (2007), Wang et al. (2019) |
| miRNA-221 | Upregulated | PHF2, PTEN/PI3K/AKT signaling | Proliferation, invasion and migration | Fu et al. (2019), Kannan et al. (2019), Liu et al. (2016) |
| miR-222 | Upregulated | AKT signaling | Migration | (Wong et al. (2010) |
| miR-224 | Upregulated | API5, AKT signaling | Proliferation, migration, invasion and apoptosis | Li et al. (2010), Ma, Tao, Gao, Fan, and Wu (2012), Wang et al. (2008) |
| miR-26a | Downregulated | Cyclin D2 and E2, MEG3, PTEN | Cell cycle arrest, proliferation and metastasis, migration and invasion | Kota et al. (2009), Li et al. (2017), Zhao et al. (2019) |
| miR-101 | Downregulated | EZH2, DNA methyltransferase 3A, SOX9 and Girdin | Apoptosis and autophagy | Cao et al. (2016), Su et al. (2009), Wei et al. (2013), Xu et al. (2014), Xu et al. (2013), Zhang et al. (2012) |
| miR-122 | Downregulated | BCL2L2, NDRG3, snail1 and snail2 | Cell survival, cell proliferation and EMT | Fan et al. (2011), Jin, Wang, et al. (2017), Lin, Gong, Tseng, Wang, and Wu (2008) |
| miR-125b | Downregulated | sirtunin7, HOTTIP, TXNRD1, Sirtuin 6 | Proliferation and metastasis | Hua et al. (2019), Kim et al. (2013), Song et al. (2018), Tsang et al. (2015) |
| miR-145 | Downregulated | ROCK1, IRS1, HDAC2, ADAM17 | Proliferation and motility | Ding et al. (2016), Liu et al. (2014), Noh et al. (2013), Wang et al. (2014) |
| miR-199a | Downregulated | FZD7 | Cell proliferation | Song et al. (2014) |
| miR-199b | Downregulated | JAG1 | proliferation, invasion and migration | Li, Yuan, Zhuang, and Wu (2018) |
| miR-200a | Downregulated | MACC1, ZEB2, Foxa2, CDK6, GAB1 | cell growth, metastasis and migration | Chen et al. (2017), Feng et al. (2015), Wang et al. (2017), Xiao et al. (2013), Yang et al. (2015) |
| miR-223 | Downregulated | stathmin1, ABCB1, FOXO3a | Autophagy, chemoresistance | Wong et al. (2008), Yang et al. (2013), Zhou et al. (2019) |
Expression levels of miR-18a positively correlate with AFP levels, tumor size, TNM stage and intrahepatic vascular invasion. miR-18a over expression in vitro promotes whereas knock down inhibits proliferation, migration, and invasion of HCC cells. Interferon regulatory factor 2 (IRF2) and chromobox 7 (CBX7) are direct targets of miR-18a and BCL2-Like 10 (BCL2L10) is a downstream mediator of miR-18a (Wang et al., 2018; Yongyu et al., 2018). miR-21 is involved in tumor proliferation, migration and invasion and directly targets phosphatase and tensin homolog (PTEN) and Kruppel-like factor 5 (KLF5) (Meng et al., 2007; Wang et al., 2019). miR-221 promotes HCC cell proliferation, invasion and migration in vitro (Fu et al., 2019; Liu et al., 2016). miR-221 targets plant homeodomain finger protein 2 (PHF2) and miR-221/Astrocyte elevated gene-1 (AEG-1) axis regulates PTEN/PI3K/AKT signaling in HCC (Fu et al., 2019; Kannan et al., 2019). miR-222 regulates cell migration through increased AKT signaling (Wong et al., 2010). miR-224 is involved in cell proliferation, migration, invasion, targets apoptosis inhibitor-5 (API5) to promote apoptosis and activates AKT signaling (Li et al., 2010; Ma et al., 2012; Wang et al., 2008). miR-26a is a complex miRNA since it acts as an oncogene in certain cancers and as a tumor suppressor in others. In HCC, it targets cyclins D2 and E2 to promote cell cycle arrest and Maternally Expressed Gene 3 (MEG3) to inhibit proliferation and metastasis (Kota et al., 2009; Li et al., 2017). miRNA-26a also increases migration and invasion through targeting PTEN (Li et al., 2017; Zhao et al., 2019). This necessitates further exploration of this miRNA. miRNA-101 is downregulated by HBx and promotes apoptosis, inhibits autophagy and targets enhancer of zeste 2 polycomb repressive complex 2 subunit (EZH2), DNA methyltransferase 3A, SRY-box transcription factor 9 (SOX9), and Girdin in HCC (Cao et al., 2016; Su et al., 2009; Wei et al., 2013; Xu et al., 2013, 2014; Zhang et al., 2012). miR-122 targets the anti-apoptotic gene, BCL2-like protein 2 (BCL2L2), N-myc downstream-regulated gene 3 (NDRG3), snail1 and snail2 to suppress tumor progression (Fan et al., 2011; Jin, Wang, et al., 2017; Lin et al., 2008). miR-125b regulates sirtunin7, long non-coding RNA HOXA transcript at the distal tip (HOTTIP), Thioredoxin Reductase 1 (TXNRD1) and Sirtuin 6 (Hua et al., 2019; Kim et al., 2013; S. Song et al., 2018; Tsang et al., 2015). miR-145 inhibits Rho associated coiled-coil containing protein kinase 1 (ROCK1), insulin receptor substrate 1 (IRS1), histone deacetylase 2 (HDAC2) and ADAM metallopeptidase domain 17 (ADAM17) (Ding et al., 2016; Liu et al., 2014; Noh et al., 2013; Wang et al., 2014). miR-199a inhibits cell proliferation and targets frizzled class receptor 7 (FZD7) (Song et al., 2014). miR-199b promotes its tumor suppressive activity by directly targeting jagged 1 (JAG1) (Li et al., 2018). miR-200a is a prognostic marker that suppresses cell growth, metastasis and migration by targeting metastasis-associated gene in colon cancer 1 (MACC1), Zinc finger _E_-box binding homeobox 2 (ZEB2), forkhead box A2 (Foxa2), cyclin-dependent kinase 6 (CDK6) and GRB2-associated-binding protein 1 (GAB1) (Chen et al., 2017; Feng et al., 2015; Wang et al., 2017; Xiao et al., 2013; Yang et al., 2015). miR-223 downregulates stathmin1, ATP binding cassette subfamily B member 1 (ABCB1) and forkhead box O3a (FOXO3a) (Wong et al., 2008; Yang et al., 2013; Zhou et al., 2019).
2.1.1.4. Signaling pathways involved in HBV-HCC
Multiple signaling pathways are known to be deregulated in HBV-related HCC (Fig. 2). Binding of WNT to frizzled family receptor stabilizes β-catenin, which translocates to the nucleus, interacts with T-cell factor/lymphoid enhancer factor (TCF/LEF) and promotes transcription. β-catenin is also bound to E-cadherins in the cytoplasm. E-cadherin loss during EMT is associated with nuclear translocation of β-catenin. The WNT/β-catenin pathway is commonly deregulated in HCC. Interaction between the ligand Wnt3 and receptor Frizzled-7 receptor is observed in HBV-related HCC (Kim, Lee, et al., 2008). The HBx protein is required for activating WNT/β-catenin signaling in HCC cells. HBx stabilizes cytoplasmic β-catenin by src kinase activation and activates WNT/β-catenin signaling in vitro (Cha, Kim, Park, & Ryu, 2004). HBx also activates WNT/β-catenin pathway by binding to the tumor suppressor, adenomatous polyposis coli (APC), displacing β-catenin leading to its upregulation in the nucleus (Hsieh et al., 2011). The precore protein, p22, is also an activator of TCF/β-catenin transcription (Tran et al., 2020). The RAS/RAF/MEK/ERK pathway is a cascade of phosphorylation reactions that leads to nuclear localization of ERK and transcription of target genes involved in cellular functions like proliferation, adhesion, angiogenesis and mobility. HBx transactivates the transcription factor AP1 through the MAPK pathway. An increase in levels of activated Raf and ERK was observed due to stimulation of Ras-GTP cycling by HBx (Benn & Schneider, 1994). This pathway increases expression of transcription factors like Activator Protein 1 (AP1) (Cross et al., 1993). HBx also activates NF-κB via the Ras pathway (Su & Schneider, 1996). Association of β-catenin with the scaffolding protein APC is required for its degradation by the APC/Axin/GSK3β complex. HBx stabilizes β-catenin by preventing its degradation through inhibiting APC binding or increasing expression of Non-muscle myosin heavy chain IIA (MYH9), a protein that degrades GSK3-β (Hsieh et al., 2011; Lin et al., 2020). The precore protein p22 also activates Wnt signaling (Tran et al., 2020).
Fig. 2.
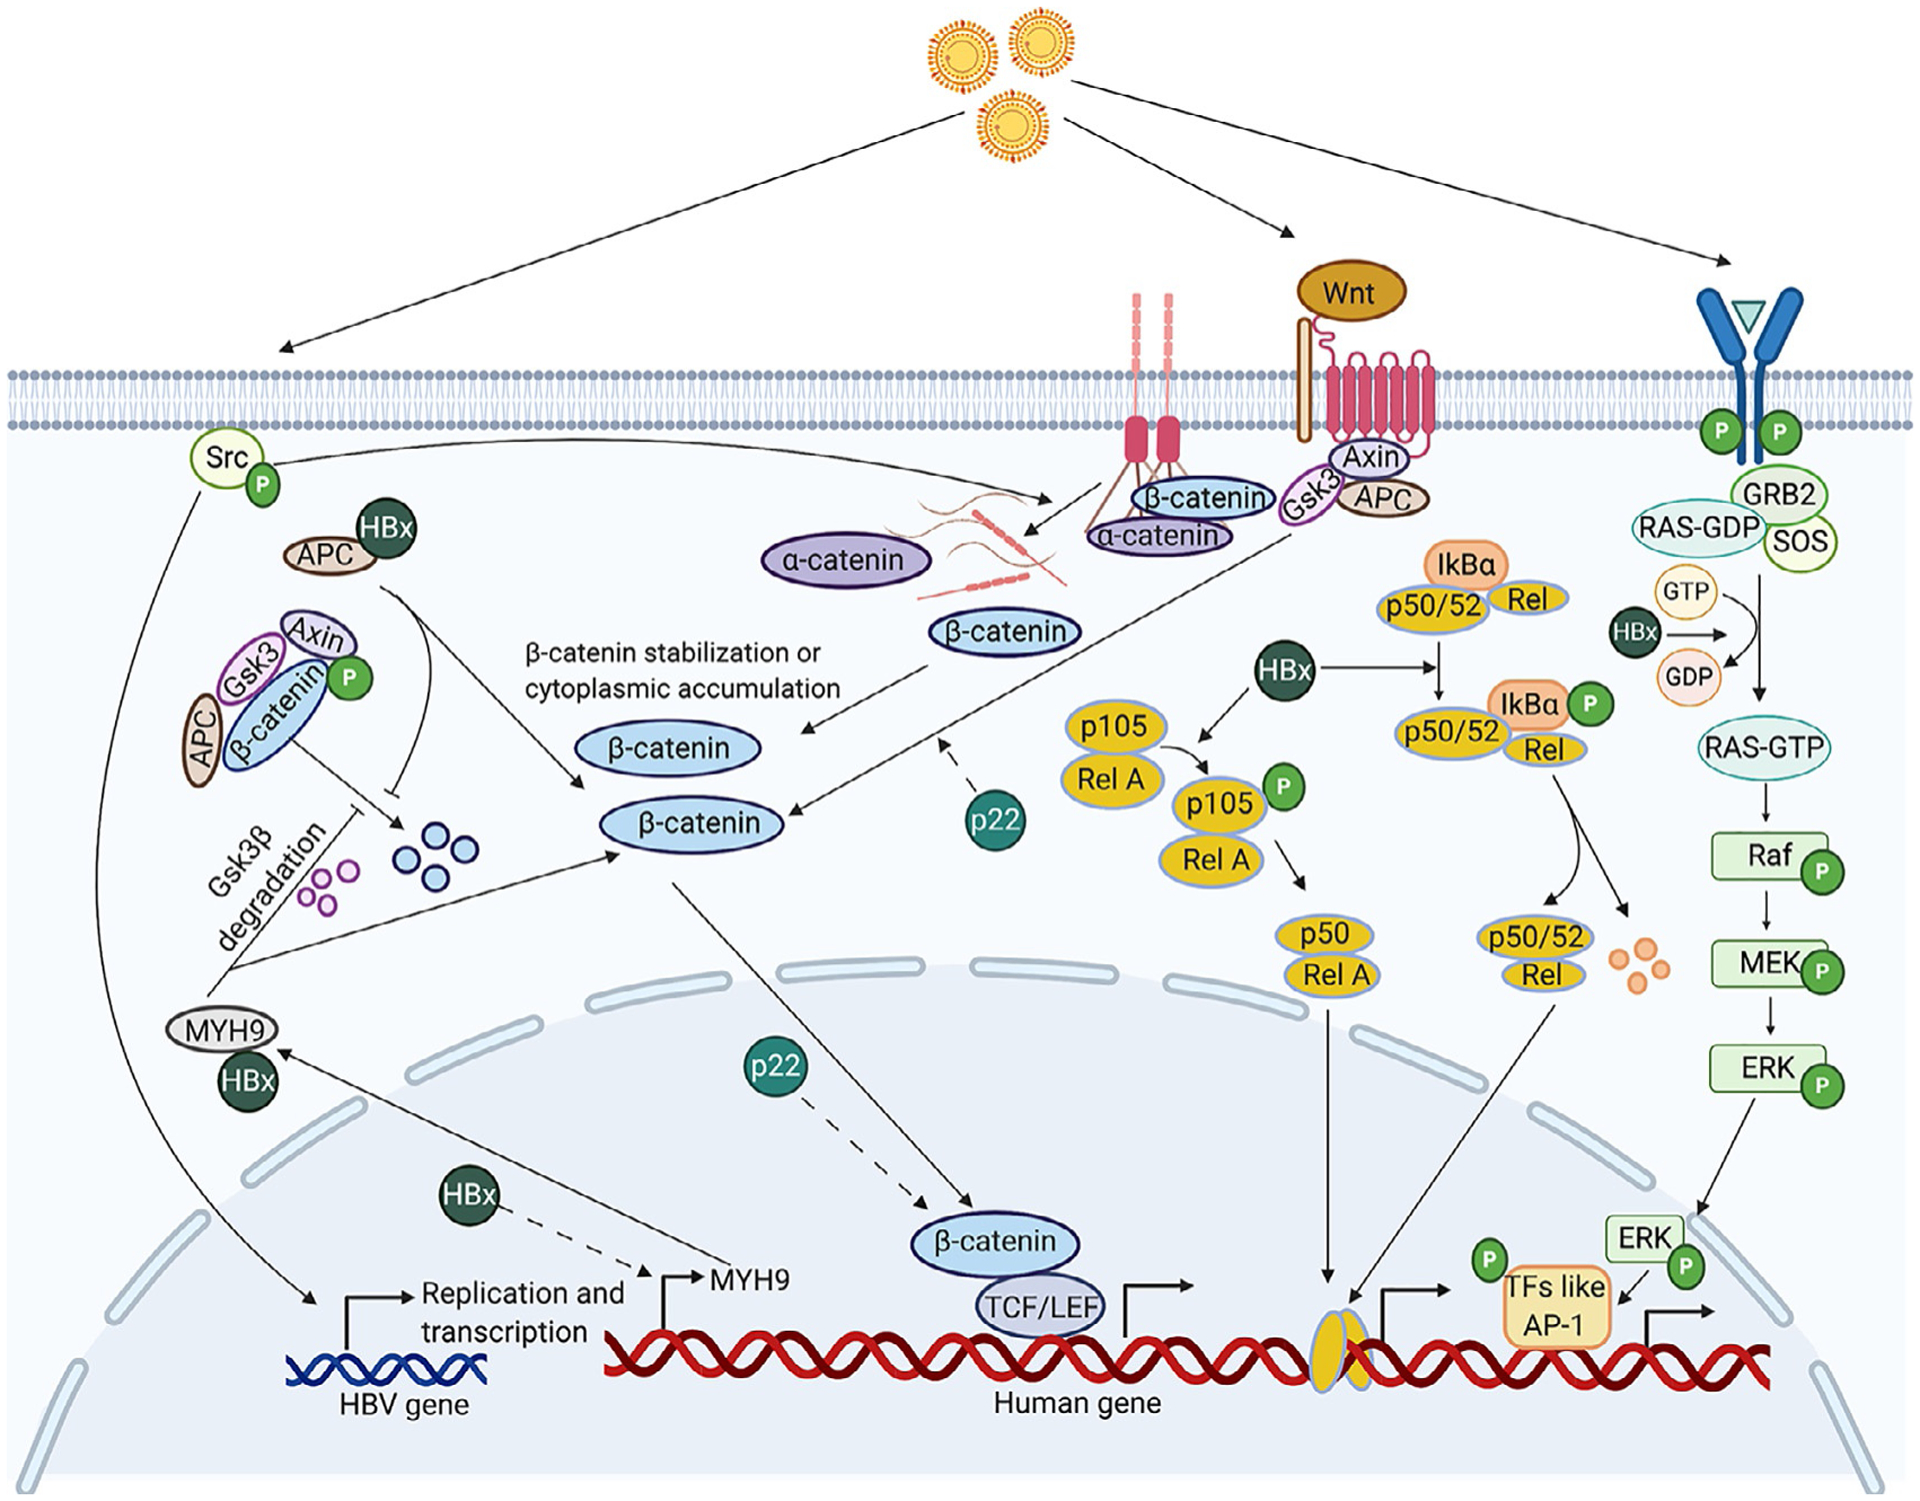
An overview of multiple signaling pathways deregulated by HBV and their potential mechanisms. Dotted lines indicate an unknown mechanism. Binding of Wnt3 to Frizzled-7 receptor activates Wnt/β-catenin signaling through β-catenin accumulation and enhanced TCF-mediated transcription (Kim et al., 2008). HBV infection increases phosphorylation of c-Src kinase, causing an increase in HBV transcription and replication and disassembly of adherens junctions. The disassembly of adherens junctions, made of _E_-Cadherin bound to β-catenin, results in increased levels of intracellular E-Cadherin and β-catenin leading to EMT and increased TCF/LEF dependent β-catenin signaling (von Olshausen et al., 2018). Association of β-catenin with the scaffolding protein APC is required for its degradation by the APC/Axin/GSK3β complex. HBx protein competitively binds to APC, preventing its association with β-catenin, leading to increased β-catenin stabilization (Hsieh, Kim, Lim, Yu, & Jung, 2011). Increased stabilization of β-catenin leads to an increase in levels of its downstream effectors like c-MYC and a decrease in E-cadherin expression (Not shown in illustration). HBx also transcriptionally regulates MYH9 through β-catenin signaling and interacts with Non-muscle myosin heavy chain IIA (MYH9) to facilitate ubiquitin mediated GSK3β degradation, thus stabilizing β-catenin (Lin et al., 2020). HBx also enhances MAPK/ERK pathway by activating Ras-GTP complex formation (Benn & Schneider, 1994). The transcription factor AP1 is activated through this pathway (Cross, Wen, & Rutter, 1993). HBx induces phosphorylation and degradation of the NF-κB inhibitor, IκBα and a decrease in levels of the p52 precursor, p105 (Su & Schneider, 1996). The precore protein p22 also activates Wnt signaling potentially both in the nucleus and the cytoplasm (Tran et al., 2020). Created with Biorender.com.
2.1.2. Hepatitis C virus
HCV is a single-stranded RNA virus with a 9.6kb long genome composed of 5′ and 3′ noncoding regions and a single ORF that encodes a polyprotein cleaved by cellular and viral proteases in a specific order co- and post-translationally to produce structural (C, E1 and E2) and nonstructural (NS2, NS3, NS4A, NS4B, NS5A, NS5B and P7) viral proteins (Bukh, 2016). The structural protein C forms the nucleocapsid and E1 and E2 are envelope glycoproteins. The nonstructural protein NS2 is a cysteine protease and NS3 a serine protease with nucleoside-triphosphatase (NTPase)/RNA helicase activity. N4A forms a non-covalent complex with and is a cofactor of NS3, and NS5A is involved in modulation of RNA replication and viral assembly. NS4B forms an intracellular membrane structure on which viral replication occurs. NS5B is an RNA-dependent RNA polymerase and p7 is a viroporin involved in viral secretion (Ashfaq, Javed, Rehman, Nawaz, & Riazuddin, 2011).
HCV enters host cells through interaction of the two viral surface glycoproteins E1 and E2 with heparan sulfate proteoglycans on the surface of hepatocytes followed by endocytosis and fusion of cell membranes. The 5’-Untranslated Region (UTR) has an internal ribosome entry site (IRES) element, which recruits the translational machinery to the viral RNA in the cytosol and translation occurs. Encoded viral proteins involved in viral replication and other cellular factors associate with a double-membraned vesicle formed from the ER, where replication takes place. Lipid droplets containing triacylglycerides and cholesteryl esters and surrounded by a phospholipid monolayer are also a part of this structure and have an important role in HCV life cycle. Polymerase NS5B uses the positive stranded RNA as a template and replication occurs through a negative stranded intermediate. The RNA generated can act as a template to further produce RNA or undergo translation to produce new viral proteins that are assembled to form viral particles. Once assembled, HCV particles associated with distinct lipid and apolipoprotein profiles are egressed from the infected cell through the secretory pathway (Kim & Chang, 2013).
The initial immune response to HCV infection is triggered by activation of PRRs like TLR3 and RIG-I through PAMPS released by HCV. Activation of these receptors initiates a cascade of reactions that results in transcription of Interferon-β gene and the production of Interferon stimulated genes (ISGs), that can mutate RNA-specific adenosine deaminase 1 (ADAR1), degrade 2′-5′-oligoadenylate synthetase 1/RNAse L (OAS1/RNAse L) system and inhibit translation (P56 and PKR) of the viral genome. HCV attenuates innate immune response through various mechanisms. HCV NS3/NS4A complex can block TLR3 and RIG-I signaling, and NS5A inhibits OAS. HCV core inhibits signal transducer and activator of transcription 1 (STAT1) activation and NS5A induces interleukin (IL)-8 both of which inhibits ISG expression downstream. HCV E2 and NS5A can inhibit the ISG protein kinase R (PKR) (Rehermann, 2009). There is also evidence of T cell-meditated immune response at 5–9 weeks post-infection. Specific cluster of differentiation (CD) 4+ and CD8+ T cells can act against HCV-derived antigens and eliminate the virus. When this process to clear HCV infection is unsuccessful, acute HCV infection can progress to chronic HCV infection. Chronic HCV infection progresses to HCC through fibrosis and cirrhosis. Fibrosis is accelerated by fat deposition in the liver or hepatic steatosis, specifically in HCV genotype 3 (Asselah, Rubbia-Brandt, Marcellin, & Negro, 2006). Several miRNAs and long non-coding RNAs (lncRNAs) are also involved in HCV-related HCC which will be discussed in detail in Chapter 3 (Plissonnier, Herzog, Levrero, & Zeisel, 2018).
2.2. Alcohol
Alcohol consumption increases the risk of not just liver cancer, but also oropharyngeal, colorectal, breast and stomach cancers. The risk of developing cancer is proportional to the amount of alcohol intake. Liver cancer risk increases 46% for consumption of 50g of ethanol per day and 66% for 100g per day compared to non-drinkers (Turati et al., 2014). Alcohol-related liver disease (ALD) accounts for about 30% of HCC cases, including HCC occurrences where other risk factors, like obesity, diabetes, hepatitis infections might co-exist with ALD (Ganne-Carrie & Nahon, 2019).
The first sign of liver damage due to alcohol abuse is steatosis or alcohol-associated fatty liver (AFL), which is usually asymptomatic. Although >90% of heavy drinkers develop AFL, it is a reversible condition and only about 30% of them progress to severe ALD. The accumulation of fat in hepatocytes happens primarily through an activation of sterol regulatory element-binding protein 1 (SREBP-1) causing increased lipogenesis or down-regulation of peroxisome proliferator-activated receptor (PPAR)-α causing decreased fatty acid β-oxidation (FAO) (Gao & Bataller, 2011). In hepatocytes, alcohol is converted to toxic acetaldehyde by the enzyme alcohol dehydrogenase (ADH). Acetaldehyde is then converted to non-toxic acetate by aldehyde dehydrogenase (ALDH) in the mitochondria and subsequently broken down to H20 and CO2. The first two steps involve reduction of NAD+ to NADH. As more molecules of ethanol are metabolized, intracellular NADH/NAD+ ratio increases disrupting mitochondrial FAO. Increased NADH/NAD+ can also increase the production of reactive oxygen species (ROS) through the electron transport chain (ETC) (Donohue., 2007). Certain factors like polymorphisms in ADH and ALDH can cause accumulation of acetaldehyde molecules that form adducts with proteins, DNA or both, inhibiting their endogenous function and/or eliciting an intense immune reaction (Brooks & Theruvathu, 2005; Setshedi, Wands, & Monte, 2010).
A steatotic liver is vulnerable to secondary insults that can lead to alcoholic hepatitis (AH) or liver inflammation. It is characterized by activation of liver resident macrophages and recruitment of monocytes, macrophages and neutrophil leukocytes into the liver producing cytokines. The intestinal lumen is surrounded by a mucosal membrane that acts as a barrier between the gut and the liver. A small amount of lipopolysaccharide (LPS) derived from Gram negative bacteria can enter the liver through the portal vein, but it is readily cleared by the liver. Metabolites derived from alcohol can disrupt the tight junction proteins, adherens junction proteins, microtubule cytoskeleton and epithelial cell-cell adhesion, making the gut-liver barrier highly permeable. As a result, high levels of LPS enter the liver and are recognized by receptors like complement receptor 3 (in macrophages), CD14/TLR4 (in monocytes, macrophages, B cells, liver parenchymal cells, and some fibroblast cells) and myeloid differentiation factor (MD)-2/TLR4 (in myeloid and endothelial lineage cells). These receptors present in multiple cell types including liver-resident macrophages are activated to produce cytokines like TNFα, IL-6, IL-1β and IL-8 that cause inflammation. AH is also a reversible stage in alcohol-related HCC, with the solution being cessation of alcohol intake (Szabo & Bala, 2010).
Chronic Alcoholic hepatitis can cause fibrosis by replacement of normal liver parenchymal tissues by connective tissues as a result of an imbalance between synthesis and degradation of extracellular matrix (ECM) components. Activation of Kupffer cells, release of DAMPs from dying hepatocytes and PAMPS from a leaky gut, and activation of hedgehog-responsive genes can cause activation of hepatic stellate cells (HSC). Activated HSCs transdifferentiate to myofibroblasts that produce ECM components collagen types I, III and IV, fibronectin, hyaluronan, and proteoglycans. Natural killer (NK) cells can kill activated HSCs by inducing apoptosis and cell cycle arrest through different mechanisms. Alcohol-related fibrosis is linked to a decrease in the number and efficiency of NK cells, increasing HSC activity. The histology of alcohol-related fibrosis is also different from non-alcoholic steatohepatitis (NASH) or hepatitis-related fibrosis (Lackner & Tiniakos, 2019; Schuppan, Ashfaq-Khan, Yang, & Kim, 2018). Regression of early fibrosis is possible through cessation of intake of alcohol and research on anti-fibrotic drugs is promising. However, prolonged fibrosis leads to cirrhosis and HCC.
2.3. Non-alcoholic fatty liver disease (NAFLD)
NAFLD refers to a spectrum of liver conditions ranging from steatosis to its more aggressive manifestation NASH. It is the most common liver disorder with a global prevalence of ~25% (Maurice & Manousou, 2018). Twenty percent of patients with early NAFLD or steatosis progress to NASH-cirrhosis, from which 2.6% undergo further progression to HCC (Ascha et al., 2010). Even though the number is lower than for other etiologies, the fact that NAFLD cases are forecasted to increase by 21% and NASH-related HCC by 137% in the US between 2015 and 2030 is of significant concern (Estes, Razavi, Loomba, Younossi, & Sanyal, 2018). Obesity and diabetes are two major risk factors for NAFLD, and the increase in NAFLD cases in the past decade parallels an increase in the worldwide incidence of obesity and diabetes (Younossi, 2019). As the name suggests, the pathology of NAFLD is similar to alcohol-related fatty liver disease, except that the etiology cannot be ascribed to chronic alcohol consumption.
The two-hit hypothesis for NAFLD progression to NASH and cirrhosis is based on steatosis being the first hit, which sensitizes hepatocytes to inflammation, which is the second hit, ultimately leading to fibrosis and cirrhosis. However, with a disease as complicated as NASH, support for the multi-hit hypothesis, which includes genetic and environmental factors, is gaining traction (Buzzetti, Pinzani, & Tsochatzis, 2016). The first stage of NAFLD is simple fatty liver, which is characterized by an excessive accumulation of triglycerides in hepatocytes. This can occur through increased lipolysis of visceral adipose tissue, which is transported to the liver, excess de novo lipogenesis (DNL) in the liver or consumption of high fat diet. Excess Free Fatty Acids (FFA) disrupt the lipid balance within cells, damage cellular organelles like mitochondria and ER, and cause cell injury and cell death. ER stress can cause chronic inflammation by increasing ROS levels and activation of NF-κB and c-Jun N-terminal kinase (JNK) pathways. Saturated fatty acids can also activate TLR4 directly in hepatocytes causing increased TNFα production and inflammation (Pierantonelli & Svegliati-Baroni, 2019).
In response to hepatocyte injury, lymphocytes and natural killer T cells are recruited to the liver and produce IFN-γ and tumor necrosis factor superfamily member 14 (TNFSF14). Signals from the gut can also activate an innate immune response through TLRs, causing inflammation. This activates liver-resident macrophages that release inflammatory cytokines and the resultant chronic inflammation culminates in HCC.
2.4. Aflatoxins
Aflatoxins are mycotoxins produced by fungal species like Aspergillus flavus and A. parasiticus. Chemically, they are furanocoumarin compounds, composed of a furan ring fused with a coumarin and are synthesized by secondary metabolic pathways in fungi. Most contaminations occur in grains and nuts during their harvest, transport or storage. Upon consumption, aflotoxins can lead to complications like hepatotoxicity, teratogenicity and immunotoxicity in plants and animals. There are more than 20 known aflatoxins, but the four important ones are aflatoxin B1, B2, G1 and G2, with aflatoxin B1 (AFB1) being the most potent hepatocarcinogen (Kumar, Mahato, Kamle, Mohanta, & Kang, 2016).
Aflatoxins are hepatotoxins that cause acute or chronic poisoning. Several outbreaks related to acute aflatoxin poisoning have occurred in countries like India, Nepal, Bangladesh, Kenya and Tanzania causing hundreds of deaths (Sarma, Bhetaria, Devi, & Varma, 2017). Acute poisoning results in liver failure that can present with jaundice, nausea and abdominal pain or can even be fatal. Chronic aflatoxin poisoning is carcinogenic, specifically related to HCC. AFB1-related HCC is most prevalent in Southeast Asia and Sub-Saharan Africa, where the dry and humid climates are favorable for fungal proliferation. The most common mutation seen in aflatoxin-related HCC patients is an AGGarg→AGTser missense mutation in codon 249 of the p53 gene (Aguilar, Hussain, & Cerutti, 1993). This mutation is known to promote HCC by affecting differentiation and metastasis (Peng, Peng, & Yao, 1998). Aflatoxin can also be metabolized by cytochrome P450 to form reactive genotoxic intermediates like aflatoxin B1–8, 9-oxide (AFBO) which can form DNA adducts in hepatocytes causing DNA damage (Hamid, Tesfamariam, Zhang, & Zhang, 2013). Aflatoxin is capable of inducing chromosomal aberrations and chromosomal strand breaks in human cells (Turkez & Sisman, 2012). In addition to purely mutagenic effects, a meta-analysis of 5 studies found that aflatoxin exposure is associated with a higher risk of liver cirrhosis, which could also lead to HCC (Mekuria, Routledge, Gong, & Sisay, 2020). Aflatoxin exposure and HBV infection can synergistically increase HCC risk up to 70% compared to aflatoxin (0.3–17.4%) or HBV (4.8–17.4%) alone (Kew, 2003).
2.5. Predisposing genetic factors
In addition to environmental factors, certain genetic factors also play a role in increasing HCC risk (Table 2). In most conditions, HCC is a secondary outcome of the underlying genetic condition in adulthood. These genetic changes are also predisposing and generally, interaction with a secondary risk factor is essential for HCC development.
Table 2.
A list of predisposing genetic conditions for HCC.
| Genetic condition | Gene(s) mutated | Type of study | Cirrhosis frequency | HCC frequency | References |
|---|---|---|---|---|---|
| Alpha 1-antitrypsin deficiency | A1AT | Retrospective study of 17 autopsied patients with A1ATD | 5 of 17 | 8 of 17 | Eriksson, Carlson, and Velez (1986) |
| Retrospective analysis of clinical data from 246 A1ATD patients | 19% of patients with age over 50 | 12 of 91 deceased patients had liver disease | Larsson (1978) | ||
| Retrospective study of 31 autopsied patients with A1ATD | 13 of 31 | 5 of 31 | Elzouki and Eriksson (1996) | ||
| Retrospective study of 675 patients with end-stage liver disease | All patients | 4 of 47 A1ATD patients | Antoury, Lopez, Zein, Stoller, and Alkhouri (2015) | ||
| Autoimmune hepatitis | Multiple genes including DRB1, FAS, TNFA and CTLA4 | Meta-analysis of 25 studies with 6528 AIH patients | 92 of 93 patients with known cirrhosis status at diagnosis | 118 of 6528 | Lleo, de Boer, Liberal, and Colombo (2019) |
| Meta-analysis of 11 studies with 8460 AIH patients | 18.7% to 83.3% in Japan and 12% to 50.2% in other areas | 0–12.3% | Valean et al. (2019) | ||
| Hereditary hemochromatosis | Type 1 HH—HFE | Retrospective study of 163 patients with HH | 112 of 163 | 16 of 53 deceased patients had liver cancer | Strohmeyer, Niederau, and Stremmel (1988) |
| Prospective study of 208 HH patients | 80 of 208 | 16 of 208 | Bradbear et al. (1985) | ||
| Prospective study of 230 HH patients | 134 of 230 | 49 of 230 | Fracanzani et al. (2001) | ||
| population-based cohort study of 1847 HH patients | 20–25% | 49 of 1847 | Elmberg et al. (2003) | ||
| Glycogen Storage Disease | Type 1 GSD—glucose-6-phosphatase | Retrospective analysis of 72 GSD patients | Data not available | 4 of 72 | Jang et al. (2020) |
| Type III GSD—glycogen debranching enzymes | Systemic review of 45 GSD type III patients | 2 of 45 | 2 of 45 | Demo et al. (2007) | |
| Type VI GSD—glycogen phosphorylase | Case report of 2 patients with GSD-associated HCC | 0 of 2 | 2 of 2 | Manzia et al. (2011) | |
| Porphyria | Enzymes involved in heme biosynthesis | Retrospective population-based mortality study including 33 AIP | 4 of 33 | 9 of 33 | Andersson, Bjersing, and Lithner (1996) |
| Prospective study of 62 AIP gene carriers | 4 of 22 HCC patients | 22 of 62 | Innala and Andersson (2011) | ||
| A nationwide cohort study including 612 PCT patients (of which 23 were diagnosed with cancer prior to PCT) | 2 of 612 | 6 of 589 | Baravelli, Sandberg, Aarsand, and Tollanes (2019) | ||
| Prospective study of 83 PCT patients | 13 of 13 HCC patients | 13 of 83 | Salata et al. (1985) | ||
| Retrospective analysis of 245 AHP patients | 2 of 7 HCC patients | 7 of 206 | Kauppinen and Mustajoki (1988) | ||
| Prospective analysis of 650 AHP patients | 2 of 7 HCC patients | 7 of 605 | Andant et al. (2000) | ||
| Case report of 2 AP-related HCC patients | 1 of 2 | 2 | Schneider-Yin et al. (2010) | ||
| Tyrosinemia type 1 | Fumarylacetoacetate hydrolase | Retrospective study of 16 HT patients | 10 of 10 (with known cirrhosis status) | 4 of 16 | Ozcan et al. (2019) |
| Retrospective study of 16 HT patients | 16 of 16 | 12 of 16 | Seda Neto et al. (2014) |
2.5.1. Alpha 1-antitrypsin deficiency (A1ATD)
Alpha 1-antitrypsin (A1AT) belongs to the protein super family SERPIN (SERine Proteinase INhibitor). Members of this family are characterized by three beta sheets (A, B and C) and a mobile reactive loop that inhibits the target proteinase by presenting it a peptide sequence as a pseudo-substrates that are >30% homologous in their structure to each other (Topic, Ljujic, & Radojkovic, 2012). The primary role of A1AT is to inhibit the serine protease neutrophil elastase (NE), a major protease that cleaves a number of connective tissue substrates. It is an acute phase response, anti-inflammatory protein that blocks TNFα effects and is produced as a host response to tissue injury and inflammation (Stockley, 2015).
A1ATD is characterized by low levels of serum A1AT and affects 1:1800 to 1:2000 live births. It is the most common genetic cause of liver disease in children and increases risk for cirrhosis and HCC (Eriksson et al., 1986; Perlmutter, 2006). Lung disorders associated with A1AT occur due to a decrease in circulating A1AT and are attributed to a loss-of-function mechanism whereas liver abnormalities occur through a gain-of-toxic function mechanism (Ghouse, Chu, Wang, & Perlmutter, 2014). AT1ATD is associated with accumulation and polymerization of mutant A1AT in hepatocytes, mitochondrial dysfunction (Perlmutter, 2002; Teckman, An, Blomenkamp, Schmidt, & Perlmutter, 2004), delayed ER protein degradation (Wu et al., 1994) and altered regulation of cyclin D1 and melanoma cell adhesion molecule (MCAM) (Marcus et al., 2010).
2.5.2. Autoimmune hepatitis (AIH)
AIH is a chronic liver disease in which the body’s immune system attacks liver cells in genetically predisposed individuals. It is a polygenic, multifactorial disease that does not follow a typical inheritance pattern. AIH is linked to mutation in a human leukocyte antigen (HLA) class II gene—DR beta 1 (DRB1), which is involved in antigen presentation to CD4+ T cells. Additionally, mutations in Fas cell surface death receptor (FAS), TNFA and cytotoxic T lymphocyte associated protein 4 (CTLA4) genes are also linked to AIH (Liberal, Longhi, Mieli-Vergani, & Vergani, 2011). There are two main types of AH depending on what autoantigens are mediators of this disease. Type 1 AIH is seen in children and adults and characterized by the presence of anti-smooth muscle and antinuclear antibodies. Type 2 AIH is predominantly observed in children and characterized by anti-liver cytosol type 1 and/or anti-liver/kidney microsomal type 1 (anti-LKM1) antibodies (Sucher et al., 2019). The production of autoantibodies can be explained by a phenomenon termed “molecular mimicry.” For example, anti-LKM1 recognizes the autoantigen cytochrome P450IID6, which is molecularly similar to HCV antigens (Manns, Johnson, Griffin, Tan, & Sullivan, 1989; Zanger, Hauri, Loeper, Homberg, & Meyer, 1988). Prevalence of AH is 11–25/100,000 per year, with more women than men being affected. A meta-analysis of 11 studies indicate that the percentage of cirrhosis in AIH patients varies from 12% to 83% and 5–6% of AH patients develop HCC (Valean et al., 2019).
2.5.3. Hereditary hemochromatosis (HH)
Hemochromatosis is an iron overload disorder characterized by increased absorption of iron from the diet and accumulation of iron in organs like the liver, heart, pancreas and joints. There are two types of Hemochromatosis—hereditary/primary (which is further classified into types 1, 2, 3 and 4) and non-hereditary/secondary. Type 1 hereditary hemochromatosis is the most common (90%) hemochromatosis and is a result of mutations in the hemostatic iron regulator (HFE) gene (Radford-Smith, Powell, & Powell, 2018).
HFE encodes cell surface protein with a role in maintaining iron homeostasis by indirectly regulating the function of two proteins—ferroportin and transferrin. Ferroportin is an iron exporter found mainly in the intestinal epithelium where it transports absorbed dietary iron out of the cell and into the blood stream, increasing plasma iron concentration. Hepcidin is a protein that decreases iron delivery to plasma by binding to and destroying ferroportin. HFE regulates hepcidin expression through an unknown mechanism. In HH, HFE is mutated causing low levels of hepcidin, high ferroportin expression, increased iron uptake and systemic iron overload (Pietrangelo, 2006). Transferrin is the iron bound ligand of transferrin receptor 1 involved in cellular uptake of iron. HFE also binds to transferrin receptor 1 blocking its interaction with transferrin, preventing iron uptake by cells. In HH, there is increased uptake of iron by cells as a consequence of lack of functional HFE protein (Roy, Penny, Feder, & Enns, 1999). An increase in circulating iron levels and cellular uptake of iron leads to its deposition in various organs including the liver.
Iron overload can promote tumor growth by increasing cellular proliferation, cause DNA damage by increasing ROS levels and damage cell membranes of subcellular organelles through peroxidative damage (Bacon & Britton, 1989; Kowdley, 2004). Iron overload can also inhibit lymphocyte proliferation (Kowdley, 2004). Incidence of cirrhosis in HH patients is 10–25% and HCC incidence in HH patients is 8–10% (Kew, 2014) and the increase in risk for HCC development has been reported to be ~20-fold compared to healthy individuals (Elmberg et al., 2003).
2.5.4. Glycogen storage diseases (GSD)
Glycogen, a form of energy reserve for the body, is a branched polymer of linear chains of 8–12 glucose units linked by alpha (1→4) glycosidic bonds. GSDs are rare metabolic disorders involving glycogen synthesis or breakdown pathways. There are over 12 types of GSDs each due to deficiency of a different enzyme. The liver is the major site for glycogen metabolism and hence most affected by any error in the pathways. The most common types of GSDs are types I, III, and IV (Burda & Hochuli, 2015).
Type I or von Gierke’s disease is the most common form of GSD. This disease involves an autosomal recessive transmission with an incidence of 1 in 100,000 individuals (Ozen, 2007). There are four subtypes of Type I GSD—Type 1a, 1b, 1c and 1d, of which type 1a is the most common. People with type I GSD have a deficiency of the enzyme glucose-6-phosphatase, which is involved in breaking down glycogen to glucose (glycogenolysis) and synthesizing glucose from non-carbohydrates sources when glycogen reserves are depleted (gluconeogenesis). This enzyme is primarily present in the liver, kidney, and intestine and is involved in the terminal step, the conversion of glucose-6-phosphate to glucose, in both these pathways. Deficiency of this enzyme leads to severe hypoglycemia, due to low availability of glucose. Also, glucose-6-phosphate allosterically inhibits glycogen phosphorylase, the first enzyme in glycogenolysis, causing an accumulation of glycogen in the liver. Other biochemical abnormalities are lactic acidosis, hyperlipidemia and hyperuricemia. 57% and 8% of GSD type 1 patients develop hepatocellular adenoma and HCC, respectively (Jang et al., 2020). Autophagy impairment, mitochondrial dysfunction, metabolic reprogramming, oncogene activation and downregulation of tumor suppressors are potential mechanisms causing type 1GSD-related HCC (Bianchi, 1993; Cho, Lee, Bae, & Chou, 2020). Animal models of this disease did not develop cirrhosis (Resaz et al., 2014).
Type III, Cori disease, or Forbes disease is an autosomal recessive disease with an incidence of 1 in 100,000 individuals, initiated by a deficiency of the glycogen debranching enzymes—glucosyltransferase and glucosidase (Ozen, 2007). There are two subtypes—type IIIa (~80% of cases) where enzyme deficiency occurs in liver and muscle and type IIIb where only the liver is involved. Glycogen is a branched molecule with α-1,6 glycosidic bonds at branch points. Since the enzyme glycogen phosphorylase can only act on α-1,4 bonds, during glycogen breakdown a debranching enzyme removes the α-1,6 glycosidic bond leaving a linear chain for glycogen phosphorylase to continue the break down process. Deficiency of this enzyme leads to accumulation of short chain length branched glycogen molecules in the liver and muscles. Liver involvement in this condition is limited and the major cause of morbidity is muscle diseases in early adulthood (Kishnani et al., 2010). There have been isolated reports of liver cirrhosis in type III GSD patients, with less than 10 cases of HCC reported overall (Demo et al., 2007).
Type VI or Hers disease is an extremely rare condition with unknown prevalence, except in older Mennonite population where the disorder has a prevalence of 1:1000 (Ozen, 2007). It is an autosomal recessive disorder caused by a defect in the glycogenolysis enzyme glycogen phosphorylase. Symptoms of this disorder include hepatomegaly, poor growth, ketonic hypoglycemia, elevated hepatic transaminases, hyperlipidemia and low prealbumin level. There are limited reports of HCC development in type VI GSD patients. However, there is evidence that while rare, these patients can develop HCC. Also, fibrosis is more common than cirrhosis in these patients (Manzia et al., 2011).
2.5.5. Porphyria
Porphyrin is a compound formed of four modified pyrrole subunits interconnected at their alpha carbon atoms by methine bridges. Heme is chemically a protoporphyrin, a type of porphyrin, linked to an iron molecule. Porphyria represents a group of rare mostly genetic disorders caused by a deficiency of enzymes involved in heme biosynthesis, causing an accumulation of porphyrins and porphyrin precursors in the body. It can be broadly classified into acute and cutaneous porphyria. Acute porphyria (AP) causes sudden attacks of severe abdominal pain that can last for several days and primarily affects the nervous system. The subtypes of APs are acute intermittent porphyria (AIP), variegate porphyria (VP), aminolevulinic acid dehydratase deficiency porphyria (ALAD) and hereditary coproporphyria (HCP), each uniquely characterized by deficiency of a different enzyme. Non-acute or cutaneous porphyrias primarily cause blistering, swelling, reddening, itching and scarring of the skin as a result of exposure to sunlight. Their subtypes are X-linked dominant protoporphyria (XLDPP), congenital erythropoietic porphyria (CEP), porphyria cutanea tarda (PCT) and erythropoietic protoporphyria (EPP). Porphyria can also be classified into acute hepatic porphyria (AHP) and erythropoietic porphyria, based on the origin of excess precursors. AIP, PCT, HCP and VP are hepatic, with precursors originating in the liver and CEP and EPP are erythropoietic, where precursors originate in the bone marrow (Ramanujam & Anderson, 2015).
AHP are specifically associated with increased risk for HCC. They are autosomal dominant traits and one mutant allele is sufficient to reduce enzyme levels to 50%. However, other susceptibility factors like viral infections, alcohol abuse, HFE mutations or smoking are required to display the disease phenotype since more than a 50% decrease in enzyme activity is required to manifest this phenotype. Since these additional susceptibility factors in themselves can cause HCC, proper controlled studies are required to estimate the actual incidence and increased risk associated strictly with AHP (Gisbert et al., 2004). AHP patients have a 35-fold increased risk of developing HCC (Lang, Schafer, Schwender, Neumann, & Frank, 2015) and the incidence rate for AHP-related HCC is 0.16–0.35% (Peoc’h et al., 2019). PCT patients have abnormal liver enzymes and histological abnormalities. A 20-fold increase in risk for HCC (Baravelli et al., 2019) has been reported and a study with 39 patients reported 0.26% incidence per year. HCC was found in 4–27% of AIP patients (Andersson et al., 1996) and 1.3–5.4% of VP patients.
2.5.6. Tyrosinemia type 1
Hereditary Tyrosinemia type 1 (HT1) is an autosomal recessive genetic disorder resulting from a deficiency in the enzyme fumarylacetoacetate hydrolase, which breaks down 4-fumarylacetoacetate (FAA) and water into acetoacetate, fumarate, and H+ in the ultimate step of tyrosine breakdown (Bergeron, D’Astous, Timm, & Tanguay, 2001). FAA and associated toxic metabolites accumulate in the liver and cause severe liver dysfunction. Treatment for this condition involves 2-(2 nitro-4–3 trifluoro-methylbenzoyl)-1, 3-cyclohexanedione (NTBC), which is a compound that blocks the tyrosine catabolic pathway at an earlier step preventing the accumulation of most toxic metabolites. However, accumulation of tyrosine and phenylalanine (a precursor for tyrosine) still occurs which needs to be regulated through diet. Reports of HCC development have been observed in untreated patients or patients treated with NTBC after symptoms develop. If treated asymptomatically, HCC development in tyrosinemia type 1 patients can be prevented. However, the lack of newborn screening and NTBC availability still causes HCC due to untreated HT1 (van Ginkel, Pennings, & van Spronsen, 2017).
Twenty-five to 75% of HT1 positive individuals developed HCC (Ozcan et al., 2019; Seda Neto et al., 2014). In untreated patients, oxidative stress, inhibition of DNA repair enzymes, ER stress, Golgi complex disruption, and apoptosis resistance are some of the potential mechanisms for HCC development (Tanguay, Angileri, & Vogel, 2017).
3. Liver cancer staging
Liver cancer staging is the process of classifying liver cancer based on various factors. It helps determine the severity of the disease, potential prognosis and the best treatment plan after diagnosis. There are more than 18 staging systems, each with a different purpose and their own advantages and disadvantages. For example, Okuda and CLIP are score-based staging systems to predict survival whereas BCLC guides treatment decision. In addition to liver cancer staging systems, scoring systems like Child-Pugh and MELD are used to assess liver function.
3.1. Child-Pugh (CP) score
Child-Pugh or Child-Pugh-Turcotte scoring system was introduced in 1964 to classify patients undergoing liver decompression surgery for portal hypertension based on hepatic function to predict survival (Child & Turcotte, 1964; Pugh, Murray-Lyon, Dawson, Pietroni, & Williams, 1973). It was modified in 1973 to substitute the variable clinical nutritional status with prothrombin time (Pugh et al., 1973). The updated version uses blood albumin level (>35 g/L, 28–35 g/L, <28 g/L), blood bilirubin level (<2, 2–3, >3), presence or absence of ascites (absent, slight, moderate), encephalopathy grade (absent, grade 1–2, grade 3–4) and prothrombin time (<4s, 4–6s, >6s) to classify patients. Each variable can be scored 1, 2 or 3 with 1 indicating normal hepatic function and 3 indicating a compromised liver. The severity of cirrhosis is estimated based on the cumulative score—higher the score, worse the cirrhosis. A score of 5–6 is designated Child-Pugh A, 7–9 is Child-Pugh B and 10–15 is Child-Pugh C.
3.2. Model for end-stage liver disease (MELD)
MELD was introduced in 2000 to predict survival in patients undergoing transjugular intrahepatic portosystemic shunt procedure for portal hypertension (Malinchoc et al., 2000). The risk score in this method was calculated from 4 prognostic values—bilirubin level, creatinine level, International Normalized Ratio (INR), derived from prothrombin time and cause of cirrhosis. [0.957 × Log e (creatinine mg/dl) + 0.378 × Log e (bilirubin mg/dl) + 1.120 × Log e (INR) + 0.643 × 10, rounded off to the nearest integer].
Prior to 2002, the United Network for Organ Sharing which administers the national Organ Procurement and Transplantation Network, used Child-Pugh score to determine which patient qualified to receive an available donor liver. CP score is categorical and classified patients based on their liver function into status 1, 2A, 2B and 3. Within category 3 which had the sickest patients, priority was given to patients who had been on the list the longest. Hence, there was a good chance that a person that had the greatest need for a liver transplant might not receive it because they were added to the list at a later time. To overcome this problem, the CP score was replaced by the MELD score in 2002 (Freeman et al., 2002). In 2006, the MELD score was updated to include serum sodium levels and referred to as MELD-Na (Biggins et al., 2006). Another model called Albumin-Bilirubin (ALBI) score was introduced in February 2015 and uses serum albumin and bilirubin levels to assess liver function (Johnson et al., 2015).
3.3. Tumor node metastasis (TNM) system
The American Joint Committee on Cancer (AJCC) and the Union for International Cancer Control (UICC) developed the TNM staging system for multiple cancers. The first edition of the AJCC cancer staging manual was released in 1977. However, criteria for liver cancer staging was included only in the second edition in 1983. The most recent is the 8th edition of AJCC cancer staging manual, published in 2016. This is the most commonly used system in the US and includes tumor size (T), nodal involvement (N) and metastatic status (M), to stage liver cancer.
T refers to tumor size and can fall into one of the three categories (T1, T2, T3 and T4). T1 refers to a single tumor that has not grown into blood vessels. It is subcategorized based on tumor size into T1a (≤2 cm) or T2a (>2 cm). T2 refers to either a single >2-cm tumor that has grown into blood vessels or more than one tumor with maximum tumor size <5-cm. More than one tumor, with at least one tumor larger than 5-cm across is considered as T3 and T4 refers to any tumor that has grown into the hepatic or portal vein. Cancer can spread through the bloodstream to distant organs or through the lymphatic system to lymph nodes. N refers to nearby nodal involvement and can fall into one of the two types—N0 when the tumor has not spread and N1 when the tumor has spread to nearby lymph nodes. M indicates the state of metastasis. M1 and M0 refer to a tumor that has spread and not spread to distant organs, respectively.
Different combinations of T, N and M are classified into the following stages—I A (T1a, N0, M0), I B (T1b, N0, M0), II (T2, N0, M0), III A (T3, N0, M0), III B (T4, N0, M0), IV A (Any T, Any N, M0) and IV B (Any T, Any N, M1). Each revision of TNM staging system is based on evaluations done on current guidelines. The current version is based on two studies that indicated there was a need to subclassify T1, which was not subclassified in the previous edition, into T1a and T1b (Shindoh et al., 2013) and that there was no difference in survival between patients with T3a and T3b tumors or between those with T3b and T4 tumors (Chan et al., 2013). Evaluation of the current system suggests that it is better in predicting patient prognosis than the previous version, but also points that a sub-stratification of T2 group would help the system perform better (Kamarajah, Frankel, Sonnenday, Cho, & Nathan, 2018). A disadvantage of the TNM classification is that it includes only tumor characteristics and does not include liver function parameters.
3.4. The Okuda system
The Okuda classification was introduced in 1984 in Japan to predict prognosis in relation to disease stage and treatment (Okuda et al., 1984). The following four criteria were used for the classification—presence of ascites, tumor ≥50% of the 2-dimensional size of the liver, serum albumin ≤30 g/L, serum bilirubin ≥3 mg/dL. A person that does not meet any of the above criteria is classified as stage 1, 1 or 2 criteria is stage 2 and >3 criteria is stage 3.
3.5. Cancer of the liver Italian program (CLIP) system
The CLIP system was introduced in 1998 to produce a more sensitive prognostic index for HCC patients (A new prognostic system, 1998). CLIP score is calculated by assigning a score between 0 and 2 to four clinical factors Child-Pugh stage (A = 0, B = 1, C = 2), AFP (<400 ng/dL = 0, ≥ 400 ng/dL = 1), presence of portal vein thrombosis (no = 0, yes = 1) and tumor morphology (uninodular and extension ≤50% of the liver = 0, multinodular and extension ≤50% = 1 and massive or extension >50% = 2). These scores are added together to yield a CLIP score of 0–6, each score is linked to an estimated survival—0 = 42.5 months, 1 = 32.0 months, 2 = 16.5 months, 3 = 4.5 months, 4 = 2.5 months and 5–6 1 month.
3.6. Barcelona clinic liver cancer (BCLC) system
The BCLC system was proposed by the BCLC group from University of Barcelona in 1999 to classify HCC patients into 5-stages and link each HCC stage to a treatment option (Llovet, Bru, & Bruix, 1999). In addition to CP score and tumor size, BCLC uses the Eastern Cooperative Oncology Group (ECOG) scale to evaluate performance status (PS). PS can range from PS 0 where a person is fully active to PS4 where a person is in a chair or a bed all the time and needs complete care. There are 5-stages to the BCLC staging system. Stage 0 indicates very early stage, where the tumor is <2 cm, PS 0 and CP score A. Stage A indicates early stage, with one tumor of any size or up to 3 tumors all <3 cm, PS 0 and CP score A or B. Surgical ablation is the treatment option with best outcome for BCLC stages 0 and A. Stage B is intermediate stage with >3 tumors, PS 0, CP A or B and recommended Trans-Arterial Chemoembolization (TACE). Stage C is advanced with spreading of cancer into blood vessels, lymph nodes or other organs, PS 1 or 2 and CP A or B. Systemic therapy is recommended for these patients. Stage 4 is severe liver damage with CP C and PS 3 or 4, without any treatment except best supportive care.
4. Molecular classification of HCC
HCC staging is a classification based on tumor morphology and various clinical parameters to determine treatment with the most favorable outcome and patient prognosis. Despite belonging to the same HCC stage, tumors with different molecular signatures can respond differently to the same treatment. Although challenging due to molecular heterogeneity, various studies have classified HCC into a finite number of molecular categories, primarily using sequencing techniques (Table 3, Fig. 3). Molecular classification of HCC has a similar objective as HCC staging, but is based on differences at the molecular level. It can also help develop subtype-specific targeted HCC therapies.
Table 3.
An overview of various established HCC molecular classification systems.
| Type of classification | HCC classes | Basis for classification | Samples | Techniques | References |
|---|---|---|---|---|---|
| Gene-signature based classification | G1–G6 | Loss of heterozygosity, gene mutations, promoter methylation of CDH1 and CDKN2Aand HBV DNA copy | 57 HCCs and 3 hepatocellular adenomas. 63 additional HCCs (for validation) | Genome wide transcriptome microarray and unsupervised hierarchical clustering analysis | Boyault et al. (2007) |
| Class 1—5 | Hierarchical clustering of gene expression data | 103 tumor samples From transplant patients | Single-nucleotide polymorphism arrays, statistical analysis of copy number alterations, fluorescence in-situ hybridization, tissue microarrays | Chiang et al. (2008) | |
| EpCAM+ AFP+, EpCAM+ AFP−, EpCAM− AFP+, EpCAM− AFP− | AFP and EpCAM expression | 40 HCC samples.349 HCC samples (for validation) | cDNA microarray, oligonucleotide microarray and immunohistochemical analyses | Yamashita et al. (2008) | |
| S1–S3 | Expression of meta-analysis marker genes | 603 patients from eight independent cohorts | Subclass mapping (SubMap), gene set enrichment analysis, microarray (for validation) | Hoshida et al. (2009) | |
| Subtype A–D | Expression of top differentially expressed genes | 373 HCC samples and 50 controls | Differential gene expression analysis, enrichment analysis and gene–gene interaction | Agarwal, Narayan, Bhattacharyya, Saraswat, and Tomar (2017) | |
| iClust 1–3 | Unsupervised clustering of data from five platforms | 363 hepatocellular carcinoma (HCC) samples from various institutes | Whole exome sequencing, DNA copy number analysis, methylation profiling, mRNA-seq, miRNA-seq, and proteomic analysis | Wheeler and Roberts (2017) | |
| Metabolic classification | iHCC 1–3 | Expression status of stratifying metabolic genes identified in this study | Transcriptomics and clinical data of 369 HCC and 50 matched noncancer liver samples (TCGA) | “Functional” gene–gene networks-based characterization | Bidkhori et al. (2018) |
| C1–C3 | Gene expression profile of metabolic genes | Metadata set with 371 and 231 HCC samples from TCGA and the International Cancer Genome Consortium, respectively | Subsequent non-negative matrix factorization (NMF) clustering, gene set variation analysis, microenvironment cell population-counter to estimate immune filtration | Yang, Huang, Liu, Qin, and Wang (2020) | |
| Immunological classification | Immune-high, Immune-mid and Immune-low | Immune cell infiltration pattern | 158 samples from 141 patients | Multiplex IHC and cluster analysis | Kurebayashi et al. (2018) |
| Immunocompetent, Immunodeficient and Immunosuppressive | Tumor microenvironment including immune status, chemokines/cytokines and cell metabolism | 42 samples from eight HCC patients | Whole-exome sequencing, RNA-seq, quantitative proteomics by multiplexed tandem mass tag (TMT) MS, untargeted metabolomics by liquid chromatography (LC)-MS/MS, CyTOF analysis of immune cells | Zhang et al. (2019) | |
| Type I to IV | Tumor budding assessment and immune scores | 423 resected HCC samples | Tumor budding evaluation, Immunohistochemistry and hematoxylin-eosin staining, Whole-exome sequencing | Wei et al. (2020) | |
| Chromosomal classification | Poorly polyploid and highly polyploid | Percentage of polyploid hepatocytes | 75 tumor and non-tumor tissue pairs from HCC surgery patients and 13 normal liver samples | ImageJ quantification of cellular and nuclear ploidy | Bou-Nader et al. (2020) |
Fig. 3.

An overview of various molecular classification systems for HCC. For each classification system, the subgroup with better prognosis and worse prognosis are shaded yellow and gray, respectively. Correlating subgroups between multiple classification systems are connected using dotted lines. Created with Created with https://biorender.com.
4.1. Gene signature-based classification of HCC
High-resolution copy number analysis of 125 HCC tumors followed by validation using whole exome sequencing of 24 tumors and matched normal livers revealed 5 pathways that were frequently altered in HCC. The WNT/β-catenin pathway was mutated in 49.6% of tumors with three mutually exclusive mutations Catenin Beta 1 (CTNNB1) 32.8%, Axis inhibition protein 1 (AXIN1) 15.2% and adenomatous polyposis coli protein (APC) 1.6%. The second pathway most frequently mutated was p53 signaling in 28.8% of samples, specifically mutations in TP53 gene inactivation (20.8%) or cyclin dependent kinase inhibitor 2A (CDKN2A) 8%. Genes in chromatin remodeling complex (>24%) were the next frequently mutated, with AT-rich interaction domain (ARID) 1A and ARID2 mutations in 16.8% and 5.6% of samples. 9.6% of samples had a mutation in the ribosomal protein S6 kinase A3 (RPS6KA3) gene, a kinase in Ras/MAPK signaling pathway. Nuclear factor, erythroid 2 like 2 (NFE2L2), a transcription factor involved in maintaining cellular redox homeostasis was mutated in 6.4% of HCC tumors. This mutation was present with CTNNB1 mutations, potentiating alterations of the oxidative stress pathway in WNT/β-catenin signaling (Guichard et al., 2012).
4.1.1. G1–G6 classification
Boyault. et al. suggested an HCC classification system based on genome wide transcriptome microarray and unsupervised hierarchical clustering analysis of 123 tumors (Boyault et al., 2007). A combination of 16 gene signatures were used to classify HCC into 6 groups G1–G6. G1 group was associated with genes expressed during development (Myosin Heavy Chain 4, SRY-Box Transcription Factor 9), paternally imprinted genes (Insulin Like Growth Factor 2, Paternally-expressed gene 3, Paternally-expressed gene 10 and Sarcoglycan Epsilon) and high alpha-fetoprotein (AFP) expression and G2 with mutations in the phosphatidylinositol-4,5-bisphosphate 3-kinase catalytic subunit alpha (PIK3CA) gene. Both G1 and G2 have AXIN1 gene mutations and are related to HBV infection. However, G1 samples were associated with low and G2 with high copy numbers of viral DNA. G3 over-expresses genes implicated in cell cycle control including genes encoding cyclins, cell cycle checkpoint and DNA replication checkpoint proteins and has CDKN2A promoter hypermethylation. The G4 cluster comprised of the 5 samples of non-tumorous liver tissues, the 3 hepatocellular adenoma and 2 HCCs and had a T cell factor 1 (TCF1) mutation. G5 shows down-regulation of genes involved in stress and immune response. G6 tumors showed an overexpression of lymphoid enhancer binding factor 1 (LEF1), downregulation of E-cadherin, under expression of cadherin 1 (CDH1) and presence of satellite nodules around the principal tumor (Boyault et al., 2007).
In addition to the 6 classes mentioned above, the system classifies HCCs broadly into tumors with chromosomal instability (G1–G3) or chromosomal stability (G4–G6), TP53 mutated (G2–G3), CTNNB1 mutated (G5–G6) or neither mutated (G1, G4) and AKT activated (G1–G2), WNT activated (G5–G6) or neither activated (G3–G4). Unfortunately, none of the classification systems in this study were able to predict survival. However, they can act as a tool to identify patients for targeted therapy (Boyault et al., 2007). After almost a decade, the same group validated the system in another cohort and correlated the molecular alterations to HCC phenotype (Calderaro et al., 2017). CTNNB1 mutated tumors were larger, well differentiated, cholestatic, without inflammatory infiltrates and associated with intact tumor capsule and areas of micro-trabecular and pseudo-glandular histological patterns. TP53 tumors, on the other hand, were poorly differentiated, non-cholestatic, pleomorphic, multinucleated and associated with macrovascular and microvascular invasion, areas of compact histological pattern and foci of sarcomatous changes. The tumors were also associated with WHO histological classification of HCC. G1 tumors were associated with a progenitor phenotype, G3 with macro-trabecular massive subtype and G4 with steatohepatitic subtype (Calderaro et al., 2017).
This classification system was validated in other cohorts. Transcriptome analysis of 82 samples from Singapore assembled patients into similar groups using the same gene signatures. Although the distribution of patients in the 6 groups was different, overall the results were concordant. This study further examined at distinct clinical features of groups and found that subgroup G3 strongly associated with microvascular invasion (Allen. et al., 2016). Similarly, 205 Korean HCC samples were classified into the six subgroups and similar molecular characteristics were observed (Ahn et al., 2018).
4.1.2. Class 1–5 classification
Microarray analysis of gene expression profiles of 91 HCCs revealed 4 gene expression classes. Class 1 had high prevalence of CTNNB1 mutations. The tumors were >3 cm in size and several liver-specific marker genes were overexpressed. Class 2 tumors had increased proliferation, high AFP, chromosomal instability (4q loss, 13q loss and 6q loss) and insulin like growth factor (IGF) 1 receptor, ribosomal protein S6 (RPS6) and Akt phosphorylation. Class 3 tumors had lower expression of IGF2, CTNNB1 target genes, over-expression of ISG marker genes and associated with tumors <3 cm. Class 4 tumors contained polysomy of chromosome 7 and high expression of genes in this region like Cordon-Bleu WH2 repeat protein (COBL), claudin 15 (CLDN15), mitotic arrest deficient 1 like 1 (MAD1L1), DNA polymerase delta 2 (POLD2) and ephrin type-A receptor 1 (EPHA1). These tumors also lacked chromosome 8q gains. Class 5 consists of a group of unannotated tumors. The prognostic significance of this classification was not determined (Chiang et al., 2008).
4.1.3. EpCAM- and AFP-based classification
Epithelial cellular adhesion molecule (EpCAM) is a cell-cell adhesion molecule highly expressed in embryonic liver and hepatic stem cells (de Boer, van Krieken, Janssen-van Rhijn, & Litvinov, 1999; Schmelzer, Wauthier, & Reid, 2006). Mature hepatocytes lack EpCAM expression (de Boer et al., 1999; Schmelzer et al., 2006) whereas premalignant livers (Kim et al., 2004) and 35% of HCC patients express EpCAM (de Boer et al., 1999; Kim et al., 2004; Ruck, Wichert, Handgretinger, & Kaiserling, 2000; Schmelzer et al., 2006). Although controversial, AFP is the most commonly used serum biomarker for HCC and expressed in 60% of HCC patients (Trevisani et al., 2001).
Gene signatures associated with EpCAM expression were identified using microarray analysis of 40 primary HCC tissues (Yamashita et al., 2008). Over-expressed genes in EpCAM-positive tumors were associated with organ development and protein synthesis and linked to the signaling networks of nine genes caldesmon 1 (CALD1), CTNNB1, epidermal growth factor (EGF), insulin (Ins)-1, N-Myelocytomatosis (MYCN), myogenic differentiation 1 (MYOD1), PPARA, transforming growth factor (TGF) beta 1, and TP53. Similarly, genes involved in mature hepatocyte functions, such as lipid metabolism and drug metabolism, were down regulated by five genes [NFE2L2, UDP glucuronosyltransferase family 1 member A6 (UGT1A6), transcription factor T cell factor 1 (TCF1), hepatocyte nuclear factor 4 Alpha (HNF4A), and plasminogen (PLG)]. EpCAM+ and EpCAM− tumors were further stratified based on the expression of AFP into EpCAM+ AFP+, EpCAM+ AFP−, EpCAM− AFP+ and EpCAM− AFP−. Although gene signatures of these four groups were not studied, morphological differences between them were. EpCAM+ AFP+, EpCAM+ AFP−, EpCAM− AFP+, EpCAM− AFP− resembled hepatic stem cells, bile duct epithelial cells, hepatocyte progenitors and mature hepatocytes, respectively. EpCAM+ AFP+ and EpCAM− AFP+ groups correlated with poor prognosis whereas EpCAM− AFP− and EpCAM+ AFP− groups corresponded to intermediate and good prognosis, respectively (Yamashita et al., 2008). This classification was validated in three independent cohorts using cDNA microarray, oligonucleotide microarray, and immunohistochemistry. This classification can be used to determine prognosis and targeted therapy.
4.1.4. S1–S3 classification
Meta-analysis of gene expression data from 603 patients from nine independent patient cohorts from around the world by Hoshida et al. revealed three HCC subclasses termed S1, S2 and S3 (Hoshida et al., 2009). S1 tumors are characterized by TGF-β activation causing β-catenin to be localized in the cytoplasm resulting in WNT activation. These tumors also showed more vascular invasion and satellite lesions and associated with risk of early recurrence. S2 tumors exhibited suppression of interferon-target genes, activation of MYC and AKT signaling and high levels of AFP expression. This group also consisted of the largest tumors in the cohort. S3 tumors were the smallest, included most of the well-differentiated tumors, had activation of p53 and p21 target genes and associated with good survival. This classification has been validated in multiple cohorts in this study, has prognostic value and can be used for targeted therapy.
4.1.5. A–D classification
Gene expression data of 373 HCC samples and 50 adjacent non-tumor samples obtained from the TCGA database were analyzed to obtain differentially expressed genes (DEGs) and enriched biological pathways (Agarwal et al., 2017). HCC patients stratified using consensus unsupervised hierarchical clustering predicted 4 subtypes A, B, C and D. HCC subtype A was the only one without any overlap with the other subtypes and showed association with 11 kinase related genes. Subtype B showed an enrichment of pathways like those involved in β-catenin degradation and repression of wnt target genes. Subtype C primarily involved fibroblast growth factor (FGF) 2, FGF Receptor 2, FGF Receptor 3 genes and drug metabolism, oxidation and PI3K pathways. HCC subtype D involved PI3K pathway and IL-34 gene and had higher survival probability. This classification can be used for subtype specific therapeutic target selection.
4.1.6. iClust 1–3
Unsupervised clustering of data from multiple platform analysis of 363 HCC samples revealed three independent clusters iClust 1 (n = 65), 2 (n = 55) and 3 (n = 63) (Wheeler & Roberts, 2017). iClust 1 was characterized by low frequencies of CDKN2A silencing, CTNNB1 mutation and TERT promoter mutation, low TERT expression and high expression of proliferation marker genes. They were higher grade tumors with macrovascular invasion, iClust 2 consisted of lower grade tumors with less microvascular invasion and iClust 3 consisted of tumors with chromosomal instability, TP53 mutation and hypomethylation of multiple CpG sites. Although, there was no difference in overall survival between the 3 groups, iClust 1 had significantly worse prognosis than the other two groups. iClust 1 and iClust 3 corresponded to Hoshida S2 and S3 classes, respectively (Hoshida et al., 2009; Wheeler & Roberts, 2017).
4.2. Metabolic classification of HCC
Metabolic reprogramming, including enhanced glucose uptake and lactate production, overexpression of fatty acid synthase (FASN), altered lipid metabolism and oxidative metabolic imbalance gives a selective advantage to HCC cells (De Matteis et al., 2018). Metabolic classification of HCC patients can help determine patient prognosis or assist in developing specific antimetabolite-based targeted therapy (Agren et al., 2014).
4.2.1. iHCC 1–3 classification
Analysis of Genome-scale metabolic models and construction of functional gene–gene networks of 186 HCC and 50 matched normal liver samples stratified HCC patients into 3 subtypes—iHCC1 (n = 85), iHCC2 (n = 49), and iHCC3 (n = 52) (Bidkhori et al., 2018). 18 stratifying metabolic genes were identified. The highest survival rate was observed in iHCC1 followed by iHCC2 and iHCC3. Differential gene expression analysis showed upregulation of inflammatory pathways in iHCC1 and WNT/β-catenin pathway in iHCC2. Gene set enrichment analysis revealed upregulation of tryptophan and indole metabolism and downregulation of noncoding RNA metabolism and ribosome biogenesis in iHCC1, up-regulation of oxidative demethylation and heme, glutamine and drug metabolism as well as down-regulation of cell development and G protein-coupled receptor signaling in iHCC2. iHCC3 was characterized by an abundance of changes like downregulation of fatty acid and lipid oxidation, small-molecule and amino-acid metabolism, drug catabolism and response to xenobiotic stimulus. In addition to metabolic changes, iHCC3 showed upregulation of multiple processes associated with cell proliferation, cell-cycle progression and mitosis, development, chromosome segregation, cytoskeleton organization, immune response, DNA replication, and recombination. Most iHCC3 tumors (96%) correspond to Hoshida S2 and iHCC1 and iHCC2 tumors (>54%) correspond to Hoshida S3 class l (Hoshida et al., 2009).
4.2.2. C1–C3 classification
Transcriptome analysis of a metadata set of 602 patients revealed 3 subgroups of HCC based on expression of 2752 metabolism related genes C1, C2 and C3 (Yang et al., 2020). C1 (active) was enriched in amino acid, lipid and drug metabolism-relevant signatures, expressed low AFP, pathologic stage I/II, and histologic grade G1/G2 and had good prognosis. C2 (exhausted) did not contain any distinct metabolic signatures but had high immune and stromal cell infiltration. The poor prognosis in C2 may be attributed to the combined effects of low infiltration of regulatory T cells (Treg) and Th17, high expression of immune checkpoint genes, presence of vascular invasion, advanced pathologic stage (III/IV), histologic grade (G3/G4), and high serum AFP level. C3 was enriched in hormone and proteoglycan metabolism (intermediate), high AFP level and poor prognosis.
4.3. Immunological classification of HCC
Immune evasion is a cancer hallmark promoting tumor formation and growth (Vinay et al., 2015). The first line of defense against tumors is a cell-mediated innate immune response involving the activation of receptors on immune cells including dendritic cells, macrophages, monocytes and natural killer cells by PAMPs and DAMPs (Maruyama, Selmani, Ishii, & Yamaguchi, 2011). Adaptive immunity, on the other hand, is an immune response mounted against tumor specific antigens by B and T lymphocytes. T lymphocytes can be classified into T helper (CD4+), T regulatory (CD4+) and cytotoxic T (CD8+) cells. Under normal conditions, Tregs suppress any autoimmune response. However, in a tumor environment, their expression is increased, causing an increased production of immunosuppressive cytokines, suppressing tumor immunity. B lymphocytes are activated by T helper cells to produce plasma B cells that produce antibodies. A weak immune response to tumors could be due to increased number of Tregs. Lack of CD4+ T cells can also weaken immune response by causing a depletion of CD8+ T cells (Hiraoka, 2010). Programmed death-ligand 1 (PDL1) on cancer cells and APCs can bind to Programmed cell death protein 1 (PD1) on T, B, myeloid or tumor cells to block proliferation, cytokine release and cytotoxic activities of T cells (Wu, Chen, Xu, & Gu, 2019). High levels of PD1+ CD8+ cells is seen in HCC cells (Tan, Chacko, & Chew, 2019).
4.3.1. Immune-high, mid and low classification
Cluster analysis of multiplex IHC data from 919 regions in 158 HCCs revealed three distinct HCC subtypes based on the immune microenvironment—immune-high, immune-mid and immune-low subtypes (Kurebayashi et al., 2018). Immune high group had increased B cell, plasma cell, and T cell infiltration. It was associated with poor differentiation, lower grade fibrosis, better prognosis among poorly differentiated tumors, increased PD1+ CD8+ T cells and high expression of PD-L1 in tumor and immune cells. The immune-mid group showed fibrosis and moderately increased infiltration with T cells and lesser infiltration with B and plasma cells. Immune-mid group is further subdivided into immune-mid-1 and immune-mid-2. Immune-mid-1 is a relatively non-homogeneous subtype including regions with increased granuloma formation, mast-cell infiltration, or neutrophil infiltration and associated with steatosis and ballooning. Immune-mid-2 is a more homogenous group. Immune-low subtype had low immune cell infiltration with well to moderately differentiated HCC. It was subdivided into immune-low-1, characterized by lower Treg/CD4 ratios and immune-low-2 with higher Treg/CD4 ratios. Immune-low-1 subtype was significantly less associated with poorly differentiated regions and fibrosis and associated with poorer prognosis whereas Immune-low-2 subtype was significantly associated with poorly differentiated regions and fibrosis. In addition to having prognostic significance, the study also identified the association of these subgroups with Hoshida’s and Boyault’s classification system. Immune-high group was associated with Hoshida’s S1 and Boyault’s G2 and Immune-low subtype with Hoshida’s S3 and Boyault’s G6 subclasses (Boyault et al., 2007; Hoshida et al., 2009).
4.3.2. Immunocompetent, immunodeficient and immunosuppressive classification
Evaluation of tumor heterogeneity of 42 samples from eight HCC patients using whole-exome sequencing, RNA sequencing, proteomic analysis, metabolomic analysis, cytometry, and single-cell analysis revealed three immune-based HCC subtypes—1 (immunocompetent), 2 (immunodeficient) and 3 (immunosuppressive). HCC subtype 1 patients had relatively competent antitumoral immunity with high expression of T cell recruiting molecules, normal T cell infiltration, fewer regulatory B-cell infiltration and increased urea cycle activity. Subtype 2 had reduced lymphocyte infiltration, high levels of monocytes and immune suppressive marker genes and functional genes, increased nucleotide synthesis, and low levels of chemokines and cytokines. HCC subtype 3 exhibited normal lymphocyte infiltration, increased number of immunosuppressive cells, inhibited glycolysis, increased mitochondrial respiration, over expression of genes encoding tumor suppressive chemokines/cytokines, and high expression of T cell recruiting molecules. This classification has a prognostic significance with subtype 1 having the best prognosis followed by subtype 2 and subtype 3 (Zhang et al., 2019).
4.3.3. Type I to IV classification
Tumor budding assessment and immune scores of 423 patients were used to classify HCC patients into four subgroups (Wei et al., 2020). Tumor budding refers to isolated or small groups of tumor cells present at the invasive front or in the tumor’s center (Cho & Kakar, 2018). Although extensively studied as a prognostic factor for colorectal cancer, its role in HCC has only recently been studied. HCC patients were classified into three groups based on the number of tumor buds—Grade 1 (0–4), Grade 2 (5–9) and Grade 3 (≥10). For survival analysis, grades 1 and 2 were consolidated into one group—low grade and grade 3 was considered high grade. An immune score was assigned to each tumor based on five parameters—CD8 stromal, PD-L1 stromal, Mast-cell stromal, CD68 stromal, and FOXP3 stromal and patients were classified into immune type A and immune type B groups. According to tumor budding grade and immune type, patients were classified into four subgroups: ISA-TBhigh (type I), ISB-TBhigh (type II), ISA-TBlow (type III) and ISB-TBlow (type IV). Type I patients had higher frequencies of TP53 mutations, higher levels of CD8+ immune cell, and lower levels of CD68+ and PD-L1+ immune cells. Type II patients exhibited low levels of CD68+ macrophages and PD-L1+ immune cells and a higher level of CD8+ T cells. Type II and type III tumors had the worst and best overall and disease-free survivals, respectively. Type IV tumors had a high frequency of CTNNB1 mutations (Wei et al., 2020).
4.4. Chromosomal classification of HCC
Human hepatocytes exhibit nuclear ploidy, a single nuclear hepatocyte containing more than 2 sets of chromosomes, and cellular ploidy, a binuclear hepatocyte containing 2 or more than 2 sets of chromosomes (Bou-Nader et al., 2020). Analysis of the ploidy profile of 75 tumor and non-tumor tissue pairs and 13 normal liver samples revealed that although the ratio between binuclear fractions (2 × 2n/2 × ≥ 4_n_) was similar in all three groups, the number of binuclear polyploid hepatocytes was reduced in both tumor and non-tumor tissues compared to the normal liver. Tumor tissues also had more mononuclear 4_n_ and ≥8_n_ hepatocytes compared to non-tumor tissues and normal liver tissue. Mononuclear polyploid cells were associated with TP53 mutations and had an increase in proliferation-related gene expression. Based on the ploidy profile, two groups of tumors were defined: poorly polyploid, if less than >50% of hepatocytes are polyploid and highly polyploid if >50% of hepatocytes are polyploid. Highly polyploid tumors had reduced 2-year and 5-year disease free survival.
5. Discussion
Advancements in multi-omic analyses in the past 1–2 decades have culminated in molecular classifications of HCC based on genetic, metabolic, immune and chromosomal profiles. However, the ultimate purpose of establishing a classification system is its application in a clinical setting. In order to achieve that outcome, it is important to further validate most of the reported studies in other independent HCC cohorts. Also, the etiology of the patient needs to be considered to determine if a certain subtype is more significantly correlated to one etiology than to others. This will allow a more global application of these systems, since HCC etiology varies based on geography. It will also help explain any of the observed differences between independent cohorts classified within the same system. These have been done in certain studies but clearly needs to be expanded in others.
Boyault’s G1–G6 classification is probably the most significant classification system (Boyault et al., 2007). It was established in 2006 and was then validated in South east Asian and Korean populations (Ahn et al., 2018; Allen. et al., 2016). It allows classification based on various parameters such as chromosomal stability, gene mutation, gene methylation, clinical features and biological pathways. Moreover, two of the subgroups have shown a better correlation with HBV infections. As of now, clear prognostic significance of this classification system has not been observed, although, in one study, the G3 group was associated with microvascular invasion, which negatively associates with survival (Allen. et al., 2016). In the immune profile-based classification immune-high group was associated with Boyault’s G2 and Immune-low subtype with Boyault’s G6 subclasses (Kurebayashi et al., 2018).
Hoshida’s S1–S3 classification is another well-established classification system (Hoshida et al., 2009). Several other classification systems have identified correlations between their HCC classes and Hoshida’s classes. In iClust 1–3 classification, iClust 1 and iClust 3 corresponded to Hoshida S2 and S3 classes, respectively (Wheeler & Roberts, 2017). In iHCC 1–3 classification, most iHCC3 tumors (96%) corresponded to Hoshida S2 and iHCC1 and iHCC2 tumors (>54%) corresponded to Hoshida S3 class l (Bidkhori et al., 2018). In the immune profile-based classification immune-high group was associated with Hoshida’s S1 and immune-low subtype with Hoshida’s S3 subclasses (Kurebayashi et al., 2018). The validation of a gene-based classification system in a metabolic- and immune-based classification system is promising. In addition, this system also has prognostic significance.
With respect to prognostic significance, other than Boyault’s G1–G6 and the five-class system, all classification systems displayed some level of correlation with survival, although this aspect of these classification systems need further validation (Boyault et al., 2007; Chiang et al., 2008). The lack of data for correlation between etiology and HCC classes can be attributed to their small sample sizes. Increasing the sample size would provide more significant data. HCC heterogeneity makes it difficult to propose a system of molecular classification that would encompass 100% of HCC populations within a finite number of mutually exclusive groups. However, stratification of patients to any extent could have immense practical applications. Differences in disease etiology and inherent genetic differences between different populations makes it important to validate any classification system with multiple independent cohorts and diagnostic platforms that can confirm generalizability of the observations and conclusions. Such validation has been performed for a limited number of the discussed classification systems making them potentially useful in a clinical setting.
Acknowledgments
The present study was supported in part by The National Institute of Diabetes and Digestive and Kidney Diseases (NIDDK) Grant 1R01DK107451-01A1 (D.S.), National Cancer Institute (NCI) Grants 1R01CA230561-01A1 (D.S.), 1R01CA240004-01 (D.S.) and 1R01CA244993-01 (D.S. and P.B.F.), and Department of Defense (DOD) Grant CA170048 (D.S.).
List of abbreviations
A1AT
alpha 1-antitrypsin
A1ATD
alpha 1-antitrypsin deficiency
ABCB1
ATP binding cassette subfamily B member 1
ADAM17
ADAM metallopeptidase domain 17
ADAR1
RNA-specific adenosine deaminase
ADH
alcohol dehydrogenase
ADPRM
ADP-ribose/CDP-alcohol diphosphatase
AEG-1
Astrocyte elevated gene-1
AFB1
aflatoxin B
AFL
alcohol-associated fatty liver
AFP
alpha fetoprotein
AH
alcoholic hepatitis
AHP
acute hepatic porphyria
AHRR
aryl hydrocarbon receptor repressor
AIH
autoimmune hepatitis
AIP
acute intermittent porphyria
AJCC
American Joint Committee on Cancer
ALAD
aminolevulinic acid dehydratase deficiency
ALBI
albumin-bilirubin
ALD
alcohol-related liver disease
ALDH
aldehyde dehydrogenase
anti-LKM1
anti-liver/kidney microsomal type 1
AP
acute porphyria
APC
adenomatous polyposis coli
API5
apoptosis Inhibitor-5
ARHGEF12
Rho guanine nucleotide exchange factor 12
ARID
AT-rich interaction domain
AXIN1
axis inhibition protein 1
BCL2L10
BCL2-Like 10
BCL2L2
BCL2-like protein 2
BCLC
Barcelona clinic liver cancer
BubR1
benzimidazol related protein 1
CALD1
caldesmon 1
CBX7
chromobox 7
cccDNA
covalently closed circular DNA
CCNE1
cyclin E1
CD
cluster of differentiation
CDH1
cadherin 1
CDK6
cyclin-dependent Kinase 6
CDKN2A
cyclin dependent kinase inhibitor 2A
CEP
congenital erythropoietic porphyria
CLDN15
claudin 15
CLIP
cancer of the liver Italian program
COBL
cordon-Bleu WH2 repeat protein
COX2
cyclooxygenase-2
CP
Child-Pugh
CTLA4
cytotoxic T lymphocyte associated protein 4
CTNNB1
catenin beta 1
DAMPs
damage-associated molecular patterns
DEGs
differentially expressed genes
DNL
de novo lipogenesis
DRB1
DR beta 1
dslDNA
double stranded linear DNA
ECM
extracellular matrix
ECOG
eastern cooperative oncology group
EGF
epidermal growth factor
Enh1
enhancer 1
EpCAM
epithelial cellular adhesion molecule
EPHA1
ephrin type-A receptor 1
EPP
erythropoietic protoporphyria
ER
endoplasmic reticulum
ETC
electron transport chain
EZH2
enhancer of Zeste 2 polycomb repressive complex 2 subunit
FAA
4-fumarylacetoacetate
FAO
fatty acid β-oxidation
FAS
Fas cell surface death receptor
FASN
fatty acid synthase
FFA
free fatty acids
FGF
fibroblast growth factor
FN1
fibronectin 1
Foxa2
forkhead box A2
FOXO3a
forkhead box O3a
FZD7
frizzled class receptor 7
GAB1
GRB2-associated binding protein 1
GSD
glycogen storage disease
HBcAg
HBV core antigen
HBeAg
HBV pre-core antigen
HBV
hepatitis B virus
HBx
HBV regulatory protein
HBXIP
hepatitis B virus X-interacting protein
HCC
hepatocellular carcinoma
HCP
hereditary coproporphyria
HCV
hepatitis C virus
HDAC2
histone deacetylase 2
HH
hereditary hemochromatosis
HLA
human leukocyte antigen
HNF4A
hepatocyte nuclear factor 4 alpha
HOTTIP
HOXA Transcript at the distal tip
HSC
hepatic stellate cells
HT1
hereditary tyrosinemia type 1
hTERT
human telomerase reverse transcriptase
ICC
intrahepatic cholangiocarcinoma
IGF
insulin like growth factor
IL
interleukin
INR
international normalized ratio
IRES
internal ribosome entry site
IRF2
interferon regulatory factor 2
IRS1
insulin receptor substrate 1
ISGs
interferon stimulated genes
JAG1
jagged 1
JNK
c-Jun N-terminal kinase
KLF5
Kruppel-like factor 5
KRT32
keratin 32
LEF
lymphoid enhancer factor
LEF1
lymphoid enhancer binding factor 1
lncRNAs
long non-coding RNAs
LPS
lipopolysaccharide
MACC1
metastasis-associated gene in colon cancer 1
MAD1L1
mitotic arrest deficient 1 like 1
MCAM
melanoma cell adhesion molecule
MD
myeloid differentiation factor
MELD
model for end-stage liver disease
miRNA
microRNA
MLL4
mixed lineage leukemia gene homolog 4
MYCN
N-myelocytomatosis
MYOD1
myogenic differentiation 1
NASH
non-alcoholic steatohepatitis
NDRG3
N-myc downstream-regulated gene 3
NE
neutrophil elastase
NFE2L2
nuclear factor, erythroid 2 Like 2
NF-κB
nuclear factor kappa-light-chain-enhancer of activated B cells
NK
natural killer
NOD
nucleotide-binding oligomerization domain
NRG3
neuregulin 3
NTBC
2-(2 nitro-4–3 trifluoro-methylbenzoyl)-1, 3-cyclohexanedione
NTPase
nucleoside-triphosphatase
OAS1
5′-oligoadenylate synthetase 1
ORF
open reading frame
PAMPs
pathogen-associated molecular patterns
PCT
porphyria cutanea tarda
PD1
programmed cell death protein 1
PDL1
programmed death ligand 1
PHF2
plant homeodomain finger protein 2
PIK3CA
phosphatidylinositol-4,5-bisphosphate 3-kinase catalytic subunit alpha
PKR
protein kinase R
PLG
plasminogen
POLD2
DNA polymerase delta 2
PPAR
peroxisome proliferator-activated receptor
PPR
pattern recognition receptors
PS
performance status
PTEN
phosphatase and tensin homolog
PTPRD
protein tyrosine phosphatase receptor type-D
RBFOX1
RNA binding fox-1 homolog 1
rcDNA
relaxed circular DNA
RIG-I
retinoic acid-inducible gene I
ROCK1
Rho associated coiled coil containing protein kinase 1
RPS6
ribosomal protein S6
RPS6KA3
ribosomal protein S6 kinase A3
SERPIN
SERine proteinase INhibitor
SOX9
SRY-box transcription factor 9
SREBP-1
sterol regulatory element-binding protein 1
STAT1
signal transducer and activator of transcription 1
TACE
trans-arterial chemoembolization
TCF1
T cell factor 1
TGF
transforming growth factor
TKI
tyrosine kinase inhibitor
TLR
toll-like receptor
TNFSF14
tumor necrosis factor superfamily member 14
TNM
tumor node metastasis
Treg
regulatory T-cells
TXNRD1
thioredoxin reductase 1
UGT1A6
UDP glucuronosyltransferase family 1 member A6
UICC
Union for International Cancer Control
UNC5D
UNC-5 netrin receptor D
UTR
untranslated region
VEGF
vascular endothelial growth factor
VP
variegate porphyria
WHO
World Health Organization
XLDPP
X-linked dominant protoporphyria
ZEB2
zinc finger E-box binding homeobox 2
References
- A new prognostic system. (1998). A new prognostic system for hepatocellular carcinoma: A retrospective study of 435 patients: The Cancer of the Liver Italian Program (CLIP) investigators. Hepatology, 28(3), 751–755. [DOI] [PubMed] [Google Scholar]
- Agarwal R, Narayan J, Bhattacharyya A, Saraswat M, & Tomar AK (2017). Gene expression profiling, pathway analysis and subtype classification reveal molecular heterogeneity in hepatocellular carcinoma and suggest subtype specific therapeutic targets. Cancer Genetics, 216–217, 37–51. [DOI] [PubMed] [Google Scholar]
- Agren R, Mardinoglu A, Asplund A, Kampf C, Uhlen M, & Nielsen J (2014). Identification of anticancer drugs for hepatocellular carcinoma through personalized genome-scale metabolic modeling. Molecular Systems Biology, 10, 721. [DOI] [PMC free article] [PubMed] [Google Scholar]
- Aguilar F, Hussain SP, & Cerutti P (1993). Aflatoxin B1 induces the transversion of G- ->T in codon 249 of the p53 tumor suppressor gene in human hepatocytes. Proceedings of the National Academy of Sciences of the United States of America, 90(18), 8586–8590. [DOI] [PMC free article] [PubMed] [Google Scholar]
- Ahn SM, Haq F, Park I, Nault JC, Zucman-Rossi J, & Yu E (2018). The clinical implications of G1–G6 transcriptomic signature and 5-gene score in Korean patients with hepatocellular carcinoma. BMC Cancer, 18(1), 571. [DOI] [PMC free article] [PubMed] [Google Scholar]
- Allen JC Jr., Nault JC, Zhu G, Khor AY, Liu J, Lim TK, et al. (2016). The transcriptomic G1–G6 signature of hepatocellular carcinoma in an Asian population: Association of G3 with microvascular invasion. Medicine (Baltimore), 95(47), e5263. [DOI] [PMC free article] [PubMed] [Google Scholar]
- Amisaki M, Tsuchiya H, Sakabe T, Fujiwara Y, & Shiota G (2019). Identification of genes involved in the regulation of TERT in hepatocellular carcinoma. Cancer Science, 110(2), 550–560. [DOI] [PMC free article] [PubMed] [Google Scholar]
- Andant C, Puy H, Bogard C, Faivre J, Soule JC, Nordmann Y, et al. (2000). Hepatocellular carcinoma in patients with acute hepatic porphyria: frequency of occurrence and related factors. Journal of Hepatology, 32(6), 933–939. [DOI] [PubMed] [Google Scholar]
- Andersson C, Bjersing L, & Lithner F (1996). The epidemiology of hepatocellular carcinoma in patients with acute intermittent porphyria. Journal of Internal Medicine, 240(4), 195–201. [DOI] [PubMed] [Google Scholar]
- Antoury C, Lopez R, Zein N, Stoller JK, & Alkhouri N (2015). Alpha-1 antitrypsin deficiency and the risk of hepatocellular carcinoma in end-stage liver disease. World Journal of Hepatology, 7(10), 1427–1432. [DOI] [PMC free article] [PubMed] [Google Scholar]
- Ascha MS, Hanouneh IA, Lopez R, Tamimi TA, Feldstein AF, & Zein NN (2010). The incidence and risk factors of hepatocellular carcinoma in patients with non-alcoholic steatohepatitis. Hepatology, 51(6), 1972–1978. [DOI] [PubMed] [Google Scholar]
- Ashfaq UA, Javed T, Rehman S, Nawaz Z, & Riazuddin S (2011). An overview of HCV molecular biology, replication and immune responses. Virology Journal, 8, 161. [DOI] [PMC free article] [PubMed] [Google Scholar]
- Asselah T, Rubbia-Brandt L, Marcellin P, & Negro F (2006). Steatosis in chronic hepatitis C: Why does it really matter? Gut, 55(1), 123–130. [DOI] [PMC free article] [PubMed] [Google Scholar]
- Bacon BR, & Britton RS (1989). Hepatic injury in chronic iron overload. Role of lipid peroxidation. Chemico-Biological Interactions, 70(3–4), 183–226. [DOI] [PubMed] [Google Scholar]
- Baravelli CM, Sandberg S, Aarsand AK, & Tollanes MC (2019). Porphyria cutanea tarda increases risk of hepatocellular carcinoma and premature death: A nationwide cohort study. Orphanet Journal of Rare Diseases, 14(1), 77. [DOI] [PMC free article] [PubMed] [Google Scholar]
- Benn J, & Schneider RJ (1994). Hepatitis B virus HBx protein activates Ras-GTP complex formation and establishes a Ras, Raf, MAP kinase signaling cascade. Proceedings of the National Academy of Sciences of the United States of America, 91(22), 10350–10354. [DOI] [PMC free article] [PubMed] [Google Scholar]
- Bergeron A, D’Astous M, Timm DE, & Tanguay RM (2001). Structural and functional analysis of missense mutations in fumarylacetoacetate hydrolase, the gene deficient in hereditary tyrosinemia type 1. The Journal of Biological Chemistry, 276(18), 15225–15231. [DOI] [PubMed] [Google Scholar]
- Bianchi L (1993). Glycogen storage disease I and hepatocellular tumours. European Journal of Pediatrics, 152(Suppl. 1), S63–S70. [DOI] [PubMed] [Google Scholar]
- Bidkhori G, Benfeitas R, Klevstig M, Zhang C, Nielsen J, Uhlen M, et al. (2018). Metabolic network-based stratification of hepatocellular carcinoma reveals three distinct tumor subtypes. Proceedings of the National Academy of Sciences of the United States of America, 115(50), E11874–E11883. [DOI] [PMC free article] [PubMed] [Google Scholar]
- Biggins SW, Kim WR, Terrault NA, Saab S, Balan V, Schiano T, et al. (2006). Evidence-based incorporation of serum sodium concentration into MELD. Gastroenterology, 130(6), 1652–1660. [DOI] [PubMed] [Google Scholar]
- Bou-Nader M, Caruso S, Donne R, Celton-Morizur S, Calderaro J, Gentric G, et al. (2020). Polyploidy spectrum: A new marker in HCC classification. Gut, 69(2), 355–364. [DOI] [PMC free article] [PubMed] [Google Scholar]
- Boyault S, Rickman DS, de Reynies A, Balabaud C, Rebouissou S, Jeannot E, et al. (2007). Transcriptome classification of HCC is related to gene alterations and to new therapeutic targets. Hepatology, 45(1), 42–52. [DOI] [PubMed] [Google Scholar]
- Bradbear RA, Bain C, Siskind V, Schofield FD, Webb S, Axelsen EM, et al. (1985). Cohort study of internal malignancy in genetic hemochromatosis and other chronic non-alcoholic liver diseases. The Journal of the National Cancer Institute, 75(1), 81–84. [PubMed] [Google Scholar]
- Bray F, Ferlay J, Soerjomataram I, Siegel RL, Torre LA, & Jemal A (2018). Global cancer statistics 2018: GLOBOCAN estimates of incidence and mortality worldwide for 36 cancers in 185 countries. CA: A Cancer Journal for Clinicians, 68(6), 394–424. [DOI] [PubMed] [Google Scholar]
- Brooks PJ, & Theruvathu JA (2005). DNA adducts from acetaldehyde: Implications for alcohol-related carcinogenesis. Alcohol, 35(3), 187–193. [DOI] [PubMed] [Google Scholar]
- Bukh J (2016). The history of hepatitis C virus (HCV): Basic research reveals unique features in phylogeny, evolution and the viral life cycle with new perspectives for epidemic control. Journal of Hepatology, 65(1 Suppl), S2–S21. [DOI] [PubMed] [Google Scholar]
- Burda P, & Hochuli M (2015). Hepatic glycogen storage disorders: What have we learned in recent years? Current Opinion in Clinical Nutrition and Metabolic Care, 18(4), 415–421. [DOI] [PubMed] [Google Scholar]
- Buzzetti E, Pinzani M, & Tsochatzis EA (2016). The multiple-hit pathogenesis of non-alcoholic fatty liver disease (NAFLD). Metabolism, 65(8), 1038–1048. [DOI] [PubMed] [Google Scholar]
- Calderaro J, Couchy G, Imbeaud S, Amaddeo G, Letouzé E, Blanc JF, et al. (2017). Histological subtypes of hepatocellular carcinoma are related to gene mutations and molecular tumour classification. Journal of Hepatology, 67(4), 727–738. [DOI] [PubMed] [Google Scholar]
- Cao K, Li J, Zhao Y, Wang Q, Zeng Q, He S, et al. (2016). miR-101 inhibiting cell proliferation, migration and invasion in hepatocellular carcinoma through down-regulating Girdin. Molecules and Cells, 39(2), 96–102. [DOI] [PMC free article] [PubMed] [Google Scholar]
- Cha MY, Kim CM, Park YM, & Ryu WS (2004). Hepatitis B virus X protein is essential for the activation of Wnt/beta-catenin signaling in hepatoma cells. Hepatology, 39(6), 1683–1693. [DOI] [PubMed] [Google Scholar]
- Chan AC, Fan ST, Poon RT, Cheung TT, Chok KS, Chan SC, et al. (2013). Evaluation of the seventh edition of the American Joint Committee on Cancer tumour-node-metastasis (TNM) staging system for patients undergoing curative resection of hepatocellular carcinoma: Implications for the development of a refined staging system. HPB: The Official Journal of the International Hepato Pancreato Biliary Association, 15(6), 439–448. [DOI] [PMC free article] [PubMed] [Google Scholar]
- Chen SY, Ma DN, Chen QD, Zhang JJ, Tian YR, Wang ZC, et al. (2017). MicroRNA-200a inhibits cell growth and metastasis by targeting Foxa2 in hepatocellular carcinoma. Journal of Cancer, 8(4), 617–625. [DOI] [PMC free article] [PubMed] [Google Scholar]
- Cheng AS, Yu J, Lai PB, Chan HL, & Sung JJ (2008). COX-2 mediates hepatitis B virus X protein abrogation of p53-induced apoptosis. Biochemical and Biophysical Research Communications, 374(2), 175–180. [DOI] [PubMed] [Google Scholar]
- Chiang DY, Villanueva A, Hoshida Y, Peix J, Newell P, Minguez B, et al. (2008). Focal gains of VEGFA and molecular classification of hepatocellular carcinoma. Cancer Research, 68(16), 6779–6788. [DOI] [PMC free article] [PubMed] [Google Scholar]
- Child CG, & Turcotte JG (1964). Surgery and portal hypertension. Major Problems in Clinical Surgery, 1, 1–85. [PubMed] [Google Scholar]
- Chirillo P, Pagano S, Natoli G, Puri PL, Burgio VL, Balsano C, et al. (1997). The hepatitis B virus X gene induces p53-mediated programmed cell death. Proceedings of the National Academy of Sciences of the United States of America, 94(15), 8162–8167. [DOI] [PMC free article] [PubMed] [Google Scholar]
- Cho SJ, & Kakar S (2018). Tumor budding in colorectal carcinoma: Translating a morphologic score into clinically meaningful results. Archives of Pathology & Laboratory Medicine, 142(8), 952–957. [DOI] [PubMed] [Google Scholar]
- Cho JH, Lee YM, Bae SH, & Chou JY (2020). Activation of tumor-promoting pathways implicated in hepatocellular adenoma/carcinoma, a long-term complication of glycogen storage disease type Ia. Biochemical and Biophysical Research Communications, 522(1), 1–7. [DOI] [PMC free article] [PubMed] [Google Scholar]
- Cross JC, Wen P, & Rutter WJ (1993). Transactivation by hepatitis B virus X protein is promiscuous and dependent on mitogen-activated cellular serine/threonine kinases. Proceedings of the National Academy of Sciences of the United States of America, 90(17), 8078–8082. [DOI] [PMC free article] [PubMed] [Google Scholar]
- de Boer CJ, van Krieken JH, Janssen-van Rhijn CM, & Litvinov SV (1999). Expression of Ep-CAM in normal, regenerating, metaplastic, and neoplastic liver. The Journal of Pathology, 188(2), 201–206. [DOI] [PubMed] [Google Scholar]
- De Matteis S, Ragusa A, Marisi G, De Domenico S, Casadei Gardini A, Bonafe M, et al. (2018). Aberrant metabolism in hepatocellular carcinoma provides diagnostic and therapeutic opportunities. Oxidative Medicine and Cellular Longevity, 2018, 7512159. [DOI] [PMC free article] [PubMed] [Google Scholar]
- Demo E, Frush D, Gottfried M, Koepke J, Boney A, Bali D, et al. (2007). Glycogen storage disease type III-hepatocellular carcinoma a long-term complication? Journal of Hepatology, 46(3), 492–498. [DOI] [PMC free article] [PubMed] [Google Scholar]
- Ding D, Lou X, Hua D, Yu W, Li L, Wang J, et al. (2012). Recurrent targeted genes of hepatitis B virus in the liver cancer genomes identified by a next-generation sequencing-based approach. PLoS Genetics, 8(12), e1003065. [DOI] [PMC free article] [PubMed] [Google Scholar]
- Ding W, Tan H, Zhao C, Li X, Li Z, Jiang C, et al. (2016). MiR-145 suppresses cell proliferation and motility by inhibiting ROCK1 in hepatocellular carcinoma. Tumour Biology, 37(5), 6255–6260. [DOI] [PubMed] [Google Scholar]
- Donato F, Boffetta P, & Puoti M (1998). A meta-analysis of epidemiological studies on the combined effect of hepatitis B and C virus infections in causing hepatocellular carcinoma. International Journal of Cancer, 75(3), 347–354. [DOI] [PubMed] [Google Scholar]
- Dong H, Zhang L, Qian Z, Zhu X, Zhu G, Chen Y, et al. (2015). Identification of HBV-MLL4 integration and its molecular basis in Chinese hepatocellular carcinoma. PLoS One, 10(4), e0123175. [DOI] [PMC free article] [PubMed] [Google Scholar]
- Donohue TM Jr. (2007). Alcohol-induced steatosis in liver cells. World Journal of Gastroenterology, 13(37), 4974–4978. [DOI] [PMC free article] [PubMed] [Google Scholar]
- Elmberg M, Hultcrantz R, Ekbom A, Brandt L, Olsson S, Olsson R, et al. (2003). Cancer risk in patients with hereditary hemochromatosis and in their first-degree relatives. Gastroenterology, 125(6), 1733–1741. [DOI] [PubMed] [Google Scholar]
- Elmore LW, Hancock AR, Chang SF, Wang XW, Chang S, Callahan CP, et al. (1997). Hepatitis B virus X protein and p53 tumor suppressor interactions in the modulation of apoptosis. Proceedings of the National Academy of Sciences of the United States of America, 94(26), 14707–14712. [DOI] [PMC free article] [PubMed] [Google Scholar]
- El-Serag HB, & Rudolph KL (2007). Hepatocellular carcinoma: Epidemiology and molecular carcinogenesis. Gastroenterology, 132(7), 2557–2576. [DOI] [PubMed] [Google Scholar]
- Elzouki AN, & Eriksson S (1996). Risk of hepatobiliary disease in adults with severe alpha 1-antitrypsin deficiency (PiZZ): Is chronic viral hepatitis B or C an additional risk factor for cirrhosis and hepatocellular carcinoma? European Journal of Gastroenterology & Hepatology, 8, 989–994. [DOI] [PubMed] [Google Scholar]
- Eriksson S, Carlson J, & Velez R (1986). Risk of cirrhosis and primary liver cancer in alpha 1-antitrypsin deficiency. The New England Journal of Medicine, 314(12), 736–739. [DOI] [PubMed] [Google Scholar]
- Estes C, Razavi H, Loomba R, Younossi Z, & Sanyal AJ (2018). Modeling the epidemic of nonalcoholic fatty liver disease demonstrates an exponential increase in burden of disease. Hepatology, 67(1), 123–133. [DOI] [PMC free article] [PubMed] [Google Scholar]
- Fan CG, Wang CM, Tian C, Wang Y, Li L, Sun WS, et al. (2011). miR-122 inhibits viral replication and cell proliferation in hepatitis B virus-related hepatocellular carcinoma and targets NDRG3. Oncology Reports, 26(5), 1281–1286. [DOI] [PubMed] [Google Scholar]
- Feng J, Wang J, Chen M, Chen G, Wu Z, Ying L, et al. (2015). miR-200a suppresses cell growth and migration by targeting MACC1 and predicts prognosis in hepatocellular carcinoma. Oncology Reports, 33(2), 713–720. [DOI] [PubMed] [Google Scholar]
- Forgues M, Difilippantonio MJ, Linke SP, Ried T, Nagashima K, Feden J, et al. (2003). Involvement of Crm1 in hepatitis B virus X protein-induced aberrant centriole replication and abnormal mitotic spindles. Molecular and Cellular Biology, 23(15), 5282–5292. [DOI] [PMC free article] [PubMed] [Google Scholar]
- Fracanzani AL, Conte D, Fraquelli M, Taioli E, Mattioli M, Losco A, et al. (2001). Increased cancer risk in a cohort of 230 patients with hereditary hemochromatosis in comparison to matched control patients with non-iron-related chronic liver disease. Hepatology, 33(3), 647–651. [DOI] [PubMed] [Google Scholar]
- Freeman RB Jr., Wiesner RH, Harper A, McDiarmid SV, Lake J, Edwards E, et al. (2002). The new liver allocation system: Moving toward evidence-based transplantation policy. Liver Transplantation, 8(9), 851–858. [DOI] [PubMed] [Google Scholar]
- Fu Y, Liu M, Li F, Qian L, Zhang P, Lv F, et al. (2019). MiR-221 promotes hepatocellular carcinoma cells migration via targeting PHF2. BioMed Research International, 2019, 4371405. [DOI] [PMC free article] [PubMed] [Google Scholar]
- Fujii R, Zhu C, Wen Y, Marusawa H, Bailly-Maitre B, Matsuzawa S, et al. (2006). HBXIP, cellular target of hepatitis B virus oncoprotein, is a regulator of centrosome dynamics and cytokinesis. Cancer Research, 66(18), 9099–9107. [DOI] [PubMed] [Google Scholar]
- Fujimoto A, Totoki Y, Abe T, Boroevich KA, Hosoda F, Nguyen HH, et al. (2012). Whole-genome sequencing of liver cancers identifies etiological influences on mutation patterns and recurrent mutations in chromatin regulators. Nature Genetics, 44(7), 760–764. [DOI] [PubMed] [Google Scholar]
- Furuta M, Tanaka H, Shiraishi Y, Unida T, Imamura M, Fujimoto A, et al. (2018). Characterization of HBV integration patterns and timing in liver cancer and HBV-infected livers. Oncotarget, 9(38), 25075–25088. [DOI] [PMC free article] [PubMed] [Google Scholar]
- Ganne-Carrie N, & Nahon P (2019). Hepatocellular carcinoma in the setting of alcohol-related liver disease. Journal of Hepatology, 70(2), 284–293. [DOI] [PubMed] [Google Scholar]
- Gao B, & Bataller R (2011). Alcoholic liver disease: Pathogenesis and new therapeutic targets. Gastroenterology, 141(5), 1572–1585. [DOI] [PMC free article] [PubMed] [Google Scholar]
- Ghouse R, Chu A, Wang Y, & Perlmutter DH (2014). Mysteries of alpha1-antitrypsin deficiency: Emerging therapeutic strategies for a challenging disease. Disease Models & Mechanisms, 7(4), 411–419. [DOI] [PMC free article] [PubMed] [Google Scholar]
- Gisbert JP, Garcia-Buey L, Alonso A, Rubio S, Hernandez A, Pajares JM, et al. (2004). Hepatocellular carcinoma risk in patients with porphyria cutanea tarda. European Journal of Gastroenterology & Hepatology, 16(7), 689–692. [DOI] [PubMed] [Google Scholar]
- Guichard C, Amaddeo G, Imbeaud S, Ladeiro Y, Pelletier L, Maad IB, et al. (2012). Integrated analysis of somatic mutations and focal copy-number changes identifies key genes and pathways in hepatocellular carcinoma. Nature Genetics, 44(6), 694–698. [DOI] [PMC free article] [PubMed] [Google Scholar]
- Hamid AS, Tesfamariam IG, Zhang Y, & Zhang ZG (2013). Aflatoxin B1-induced hepatocellular carcinoma in developing countries: Geographical distribution, mechanism of action and prevention. Oncology Letters, 5(4), 1087–1092. [DOI] [PMC free article] [PubMed] [Google Scholar]
- Hiraoka N (2010). Tumor-infiltrating lymphocytes and hepatocellular carcinoma: Molecular biology. International Journal of Clinical Oncology, 15(6), 544–551. [DOI] [PubMed] [Google Scholar]
- Hoshida Y, Nijman SM, Kobayashi M, Chan JA, Brunet JP, Chiang DY, et al. (2009). Integrative transcriptome analysis reveals common molecular subclasses of human hepatocellular carcinoma. Cancer Research, 69(18), 7385–7392. [DOI] [PMC free article] [PubMed] [Google Scholar]
- Hsieh A, Kim HS, Lim SO, Yu DY, & Jung G (2011). Hepatitis B viral X protein interacts with tumor suppressor adenomatous polyposis coli to activate Wnt/beta-catenin signaling. Cancer Letters, 300(2), 162–172. [DOI] [PubMed] [Google Scholar]
- Hu L, Chen L, Yang G, Li L, Sun H, Chang Y, et al. (2011). HBx sensitizes cells to oxidative stress-induced apoptosis by accelerating the loss of Mcl-1 protein via caspase-3 cascade. Molecular Cancer, 10, 43. [DOI] [PMC free article] [PubMed] [Google Scholar]
- Hua S, Quan Y, Zhan M, Liao H, Li Y, & Lu L (2019). miR-125b-5p inhibits cell proliferation, migration, and invasion in hepatocellular carcinoma via targeting TXNRD1. Cancer Cell International, 19, 203. [DOI] [PMC free article] [PubMed] [Google Scholar]
- Hui AM, Makuuchi M, & Li X (1998). Cell cycle regulators and human hepatocarcinogenesis. Hepato-Gastroenterology, 45(23), 1635–1642. [PubMed] [Google Scholar]
- Hyams KC (1995). Risks of chronicity following acute hepatitis B virus infection: A review. Clinical Infectious Diseases, 20(4), 992–1000. [DOI] [PubMed] [Google Scholar]
- Innala E, & Andersson C (2011). Screening for hepatocellular carcinoma in acute intermittent porphyria: A 15-year follow-up in northern Sweden. Journal of Internal Medicine, 269, 538–545. [DOI] [PubMed] [Google Scholar]
- Jang HJ, Yang HR, Ko JS, Moon JS, Chang JY, & Seo JK (2020). Development of hepatocellular carcinoma in patients with glycogen storage disease: A single center retrospective study. Journal of Korean Medical Science, 35(1), e5. [DOI] [PMC free article] [PubMed] [Google Scholar]
- Jin Y, Lee WY, Toh ST, Tennakoon C, Toh HC, Chow PK, et al. (2019). Comprehensive analysis of transcriptome profiles in hepatocellular carcinoma. Journal of Translational Medicine, 17(1), 273. [DOI] [PMC free article] [PubMed] [Google Scholar]
- Jin Y, Wang J, Han J, Luo D, & Sun Z (2017). MiR-122 inhibits epithelial-mesenchymal transition in hepatocellular carcinoma by targeting Snail1 and Snail2 and suppressing WNT/beta-cadherin signaling pathway. Experimental Cell Research, 360(2), 210–217. [DOI] [PubMed] [Google Scholar]
- Jin Y, Wu D, Yang W, Weng M, Li Y, Wang X, et al. (2017). Hepatitis B virus x protein induces epithelial-mesenchymal transition of hepatocellular carcinoma cells by regulating long non-coding RNA. Virology Journal, 14(1), 238. [DOI] [PMC free article] [PubMed] [Google Scholar]
- Johnson PJ, Berhane S, Kagebayashi C, Satomura S, Teng M, Reeves HL, et al. (2015). Assessment of liver function in patients with hepatocellular carcinoma: A new evidence-based approach-the ALBI grade. Journal of Clinical Oncology, 33(6), 550–558. [DOI] [PMC free article] [PubMed] [Google Scholar]
- Kamarajah SK, Frankel TL, Sonnenday C, Cho CS, & Nathan H (2018). Critical evaluation of the American Joint Commission on Cancer (AJCC) 8th edition staging system for patients with hepatocellular carcinoma (HCC): A Surveillance, Epidemiology, End Results (SEER) analysis. Journal of Surgical Oncology, 117(4), 644–650. [DOI] [PubMed] [Google Scholar]
- Kannan M, Jayamohan S, Moorthy RK, Chabattula SC, Ganeshan M, & Arockiam AJV (2019). AEG-1/miR-221 Axis cooperatively regulates the progression of hepatocellular carcinoma by targeting PTEN/PI3K/AKT signaling pathway. International Journal of Molecular Sciences, 20(22), 5526. [DOI] [PMC free article] [PubMed] [Google Scholar] [Retracted]
- Kauppinen R, & Mustajoki P (1988). Acute hepatic porphyria and hepatocellular carcinoma. British Journal of Cancer, 57(1), 117–120. [DOI] [PMC free article] [PubMed] [Google Scholar]
- Kew MC (2003). Synergistic interaction between aflatoxin B1 and hepatitis B virus in hepatocarcinogenesis. Liver International, 23(6), 405–409. [DOI] [PubMed] [Google Scholar]
- Kew MC (2014). Hepatic iron overload and hepatocellular carcinoma. Liver Cancer, 3(1), 31–40. [DOI] [PMC free article] [PubMed] [Google Scholar]
- Kim CW, & Chang KM (2013). Hepatitis C virus: Virology and life cycle. Clinical and Molecular Hepatology, 19(1), 17–25. [DOI] [PMC free article] [PubMed] [Google Scholar]
- Kim M, Lee HC, Tsedensodnom O, Hartley R, Lim YS, Yu E, et al. (2008). Functional interaction between Wnt3 and Frizzled-7 leads to activation of the Wnt/beta-catenin signaling pathway in hepatocellular carcinoma cells. Journal of Hepatology, 48(5), 780–791. [DOI] [PMC free article] [PubMed] [Google Scholar]
- Kim JK, Noh JH, Jung KH, Eun JW, Bae HJ, Kim MG, et al. (2013). Sirtuin7 oncogenic potential in human hepatocellular carcinoma and its regulation by the tumor suppressors MiR-125a-5p and MiR-125b. Hepatology, 57(3), 1055–1067. [DOI] [PubMed] [Google Scholar]
- Kim S, Park SY, Yong H, Famulski JK, Chae S, Lee JH, et al. (2008). HBV X protein targets hBubR1, which induces dysregulation of the mitotic checkpoint. Oncogene, 27(24), 3457–3464. [DOI] [PubMed] [Google Scholar]
- Kim JW, Ye Q, Forgues M, Chen Y, Budhu A, Sime J, et al. (2004). Cancer-associated molecular signature in the tissue samples of patients with cirrhosis. Hepatology, 39(2), 518–527. [DOI] [PubMed] [Google Scholar]
- Kishnani PS, Austin SL, Arn P, Bali DS, Boney A, Case LE, et al. (2010). Glycogen storage disease type III diagnosis and management guidelines. Genetics in Medicine, 12(7), 446–463. [DOI] [PubMed] [Google Scholar]
- Kota J, Chivukula RR, O’Donnell KA, Wentzel EA, Montgomery CL, Hwang HW, et al. (2009). Therapeutic microRNA delivery suppresses tumorigenesis in a murine liver cancer model. Cell, 137(6), 1005–1017. [DOI] [PMC free article] [PubMed] [Google Scholar]
- Kowdley KV (2004). Iron, hemochromatosis, and hepatocellular carcinoma. Gastroenterology, 127(5 Suppl. 1), S79–S86. [DOI] [PubMed] [Google Scholar]
- Kulik L, & El-Serag HB (2019). Epidemiology and management of hepatocellular carcinoma. Gastroenterology, 156(2), 477–491.e471. [DOI] [PMC free article] [PubMed] [Google Scholar]
- Kumar P, Mahato DK, Kamle M, Mohanta TK, & Kang SG (2016). Aflatoxins: A global concern for food safety, human health and their management. Frontiers in Microbiology, 7, 2170. [DOI] [PMC free article] [PubMed] [Google Scholar]
- Kuo TC, & Chao CC (2010). Hepatitis B virus X protein prevents apoptosis of hepatocellular carcinoma cells by upregulating SATB1 and HURP expression. Biochemical Pharmacology, 80(7), 1093–1102. [DOI] [PubMed] [Google Scholar]
- Kurebayashi Y, Ojima H, Tsujikawa H, Kubota N, Maehara J, Abe Y, et al. (2018). Landscape of immune microenvironment in hepatocellular carcinoma and its additional impact on histological and molecular classification. Hepatology, 68(3), 1025–1041. [DOI] [PubMed] [Google Scholar]
- Lackner C, & Tiniakos D (2019). Fibrosis and alcohol-related liver disease. Journal of Hepatology, 70(2), 294–304. [DOI] [PubMed] [Google Scholar]
- Lang E, Schafer M, Schwender H, Neumann NJ, & Frank J (2015). Occurrence of malignant tumours in the acute hepatic porphyrias. JIMD Reports, 22, 17–22. [DOI] [PMC free article] [PubMed] [Google Scholar]
- Larsson C (1978). Natural history and life expectancy in severe alpha1-antitrypsin deficiency, Pi Z. Acta Medica Scandinavica, 204, 345–351. [DOI] [PubMed] [Google Scholar]
- Lee YI, Kang-Park S, Do SI, & Lee YI (2001). The hepatitis B virus-X protein activates a phosphatidylinositol 3-kinase-dependent survival signaling cascade. The Journal of Biological Chemistry, 276(20), 16969–16977. [DOI] [PubMed] [Google Scholar]
- Lee SW, Lee YM, Bae SK, Murakami S, Yun Y, & Kim KW (2000). Human hepatitis B virus X protein is a possible mediator of hypoxia-induced angiogenesis in hepatocarcinogenesis. Biochemical and Biophysical Research Communications, 268(2), 456–461. [DOI] [PubMed] [Google Scholar]
- Lee S, Tarn C, Wang WH, Chen S, Hullinger RL, & Andrisani OM (2002). Hepatitis B virus X protein differentially regulates cell cycle progression in X-transforming versus nontransforming hepatocyte (AML12) cell lines. The Journal of Biological Chemistry, 277(10), 8730–8740. [DOI] [PubMed] [Google Scholar]
- Leong TY, & Leong AS (2005). Epidemiology and carcinogenesis of hepatocellular carcinoma. HPB: The Official Journal of the International Hepato Pancreato Biliary Association, 7(1), 5–15. [DOI] [PMC free article] [PubMed] [Google Scholar]
- Li CL, Li CY, Lin YY, Ho MC, Chen DS, Chen PJ, et al. (2019). Androgen receptor enhances hepatic telomerase reverse transcriptase gene transcription after hepatitis B virus integration or point mutation in promoter region. Hepatology, 69(2), 498–512. [DOI] [PubMed] [Google Scholar]
- Li Y, Ren M, Zhao Y, Lu X, Wang M, Hu J, et al. (2017). MicroRNA-26a inhibits proliferation and metastasis of human hepatocellular carcinoma by regulating DNMT3B-MEG3 axis. Oncology Reports, 37(6), 3527–3535. [DOI] [PubMed] [Google Scholar]
- Li Q, Wang G, Shan JL, Yang ZX, Wang HZ, Feng J, et al. (2010). MicroRNA-224 is upregulated in HepG2 cells and involved in cellular migration and invasion. Journal of Gastroenterology and Hepatology, 25(1), 164–171. [DOI] [PubMed] [Google Scholar]
- Li GL, Yuan JH, Zhuang GD, & Wu DQ (2018). miR-199b exerts tumor suppressive functions in hepatocellular carcinoma by directly targeting JAG1. European Review for Medical and Pharmacological Sciences, 22(22), 7679–7687. [DOI] [PubMed] [Google Scholar]
- Liang TJ (2009). Hepatitis B: The virus and disease. Hepatology, 49(5 Suppl), S13–S21. [DOI] [PMC free article] [PubMed] [Google Scholar]
- Liaw YF, Tai DI, Chu CM, & Chen TJ (1988). The development of cirrhosis in patients with chronic type B hepatitis: A prospective study. Hepatology, 8(3), 493–496. [DOI] [PubMed] [Google Scholar]
- Liberal R, Longhi MS, Mieli-Vergani G, & Vergani D (2011). Pathogenesis of autoimmune hepatitis. Best Practice & Research. Clinical Gastroenterology, 25(6), 653–664. [DOI] [PubMed] [Google Scholar]
- Lin CJ, Gong HY, Tseng HC, Wang WL, & Wu JL (2008). miR-122 targets an anti-apoptotic gene, Bcl-w, in human hepatocellular carcinoma cell lines. Biochemical and Biophysical Research Communications, 375(3), 315–320. [DOI] [PubMed] [Google Scholar]
- Lin X, Li AM, Li YH, Luo RC, Zou YJ, Liu YY, et al. (2020). Silencing MYH9 blocks HBx-induced GSK3beta ubiquitination and degradation to inhibit tumor stemness in hepatocellular carcinoma. Signal Transduction and Targeted Therapy, 5(1), 13. [DOI] [PMC free article] [PubMed] [Google Scholar]
- Liu Z, Wang C, Jiao X, Zhao S, Liu X, Wang Y, et al. (2016). miR-221 promotes growth and invasion of hepatocellular carcinoma cells by constitutive activation of NFkappaB. American Journal of Translational Research, 8(11), 4764–4777. [PMC free article] [PubMed] [Google Scholar]
- Liu Y, Wu C, Wang Y, Wen S, Wang J, Chen Z, et al. (2014). MicroRNA-145 inhibits cell proliferation by directly targeting ADAM17 in hepatocellular carcinoma. Oncology Reports, 32(5), 1923–1930. [DOI] [PubMed] [Google Scholar]
- Livezey KW, Negorev D, & Simon D (2002). Increased chromosomal alterations and micronuclei formation in human hepatoma HepG2 cells transfected with the hepatitis B virus HBX gene. Mutation Research, 505(1–2), 63–74. [DOI] [PubMed] [Google Scholar]
- Lleo A, de Boer YS, Liberal R, & Colombo M (2019). The risk of liver cancer in autoimmune liver diseases. Therapeutic Advances in Medical Oncology, 11. 1758835919861914. [DOI] [PMC free article] [PubMed] [Google Scholar]
- Llovet JM, Bru C, & Bruix J (1999). Prognosis of hepatocellular carcinoma: The BCLC staging classification. Seminars in Liver Disease, 19(3), 329–338. [DOI] [PubMed] [Google Scholar]
- Lumley SF, McNaughton AL, Klenerman P, Lythgoe KA, & Matthews PC (2018). Hepatitis B virus adaptation to the CD8+ T cell response: Consequences for host and pathogen. Frontiers in Immunology, 9, 1561. [DOI] [PMC free article] [PubMed] [Google Scholar]
- Ma D, Tao X, Gao F, Fan C, & Wu D (2012). miR-224 functions as an onco-miRNA in hepatocellular carcinoma cells by activating AKT signaling. Oncology Letters, 4(3), 483–488. [DOI] [PMC free article] [PubMed] [Google Scholar]
- Malinchoc M, Kamath PS, Gordon FD, Peine CJ, Rank J, & ter Borg PC (2000). A model to predict poor survival in patients undergoing transjugular intrahepatic portosystemic shunts. Hepatology, 31(4), 864–871. [DOI] [PubMed] [Google Scholar]
- Manns MP, Johnson EF, Griffin KJ, Tan EM, & Sullivan KF (1989). Major antigen of liver kidney microsomal autoantibodies in idiopathic autoimmune hepatitis is cytochrome P450db1. The Journal of Clinical Investigation, 83(3), 1066–1072. [DOI] [PMC free article] [PubMed] [Google Scholar]
- Manzia TM, Angelico R, Toti L, Cillis A, Ciano P, Orlando G, et al. (2011). Glycogen storage disease type Ia and VI associated with hepatocellular carcinoma: Two case reports. Transplantation Proceedings, 43(4), 1181–1183. [DOI] [PubMed] [Google Scholar]
- Marcus NY, Brunt EM, Blomenkamp K, Ali F, Rudnick DA, Ahmad M, et al. (2010). Characteristics of hepatocellular carcinoma in a murine model of alpha-1-antitrypsin deficiency. Hepatology Research, 40(6), 641–653. [DOI] [PMC free article] [PubMed] [Google Scholar]
- Maruyama K, Selmani Z, Ishii H, & Yamaguchi K (2011). Innate immunity and cancer therapy. International Immunopharmacology, 11(3), 350–357. [DOI] [PubMed] [Google Scholar]
- Maurice J, & Manousou P (2018). Non-alcoholic fatty liver disease. Clinical Medicine (London, England), 18(3), 245–250. [DOI] [PMC free article] [PubMed] [Google Scholar]
- Mekuria AN, Routledge MN, Gong YY, & Sisay M (2020). Aflatoxins as a risk factor for liver cirrhosis: A systematic review and meta-analysis. BMC Pharmacology and Toxicology, 21(1), 39. [DOI] [PMC free article] [PubMed] [Google Scholar]
- Meng F, Henson R, Wehbe-Janek H, Ghoshal K, Jacob ST, & Patel T (2007). MicroRNA-21 regulates expression of the PTEN tumor suppressor gene in human hepatocellular cancer. Gastroenterology, 133(2), 647–658. [DOI] [PMC free article] [PubMed] [Google Scholar]
- Moon EJ, Jeong CH, Jeong JW, Kim KR, Yu DY, Murakami S, et al. (2004). Hepatitis B virus X protein induces angiogenesis by stabilizing hypoxia-inducible factor-1alpha. The FASEB Journal, 18(2), 382–384. [DOI] [PubMed] [Google Scholar]
- Noh JH, Chang YG, Kim MG, Jung KH, Kim JK, Bae HJ, et al. (2013). MiR-145 functions as a tumor suppressor by directly targeting histone deacetylase 2 in liver cancer. Cancer Letters, 335(2), 455–462. [DOI] [PubMed] [Google Scholar]
- Ogunwobi OO, Harricharran T, Huaman J, Galuza A, Odumuwagun O, Tan Y, et al. (2019). Mechanisms of hepatocellular carcinoma progression. World Journal of Gastroenterology, 25(19), 2279–2293. [DOI] [PMC free article] [PubMed] [Google Scholar]
- Okuda K, Obata H, Nakajima Y, Ohtsuki T, Okazaki N, & Ohnishi K (1984). Prognosis of primary hepatocellular carcinoma. Hepatology, 4(1 Suppl), 3S–6S. [DOI] [PubMed] [Google Scholar]
- Ozcan HN, Karcaaltincaba M, Pektas E, Sivri HS, Oguz B, Dursun A, et al. (2019). Imaging liver nodules in tyrosinemia type-1: A retrospective review of 16 cases in a tertiary pediatric hospital. European Journal of Radiology, 116, 41–46. [DOI] [PubMed] [Google Scholar]
- Ozen H (2007). Glycogen storage diseases: New perspectives. World Journal of Gastroenterology, 13(18), 2541–2553. [DOI] [PMC free article] [PubMed] [Google Scholar]
- Peng XM, Peng WW, & Yao JL (1998). Codon 249 mutations of p53 gene in development of hepatocellular carcinoma. World Journal of Gastroenterology, 4(2), 125–127. [DOI] [PMC free article] [PubMed] [Google Scholar]
- Peoc’h K, Manceau H, Karim Z, Wahlin S, Gouya L, Puy H, et al. (2019). Hepatocellular carcinoma in acute hepatic porphyrias: A Damocles Sword. Molecular Genetics and Metabolism, 128(3), 236–241. [DOI] [PubMed] [Google Scholar]
- Perlmutter DH (2002). Liver injury in alpha1-antitrypsin deficiency: An aggregated protein induces mitochondrial injury. The Journal of Clinical Investigation, 110(11), 1579–1583. [DOI] [PMC free article] [PubMed] [Google Scholar]
- Perlmutter DH (2006). Pathogenesis of chronic liver injury and hepatocellular carcinoma in alpha-1-antitrypsin deficiency. Pediatric Research, 60(2), 233–238. [DOI] [PubMed] [Google Scholar]
- Petruzziello A, Marigliano S, Loquercio G, Cozzolino A, & Cacciapuoti C (2016). Global epidemiology of hepatitis C virus infection: An up-date of the distribution and circulation of hepatitis C virus genotypes. World Journal of Gastroenterology, 22(34), 7824–7840. [DOI] [PMC free article] [PubMed] [Google Scholar]
- Pierantonelli I, & Svegliati-Baroni G (2019). Nonalcoholic fatty liver disease: Basic pathogenetic mechanisms in the progression from NAFLD to NASH. Transplantation, 103(1), e1–e13. [DOI] [PubMed] [Google Scholar]
- Pietrangelo A (2006). Hereditary hemochromatosis. Biochimica et Biophysica Acta, 1763(7), 700–710. [DOI] [PubMed] [Google Scholar]
- Plissonnier ML, Herzog K, Levrero M, & Zeisel MB (2018). Non-coding RNAs and hepatitis C virus-induced hepatocellular carcinoma. Viruses, 10(11), 591. [DOI] [PMC free article] [PubMed] [Google Scholar]
- Pugh RN, Murray-Lyon IM, Dawson JL, Pietroni MC, & Williams R (1973). Transection of the oesophagus for bleeding oesophageal varices. The British Journal of Surgery, 60(8), 646–649. [DOI] [PubMed] [Google Scholar]
- Radford-Smith DE, Powell EE, & Powell LW (2018). Haemochromatosis: A clinical update for the practising physician. Internal Medicine Journal, 48(5), 509–516. [DOI] [PubMed] [Google Scholar]
- Ramanujam VS, & Anderson KE (2015). Porphyria diagnostics-part 1: A brief overview of the porphyrias. Current Protocols in Human Genetics, 86, 17.20.11–17.20.26. [DOI] [PMC free article] [PubMed] [Google Scholar]
- Rehermann B (2009). Hepatitis C virus versus innate and adaptive immune responses: A tale of coevolution and coexistence. The Journal of Clinical Investigation, 119(7), 1745–1754. [DOI] [PMC free article] [PubMed] [Google Scholar]
- Resaz R, Vanni C, Segalerba D, Sementa AR, Mastracci L, Grillo F, et al. (2014). Development of hepatocellular adenomas and carcinomas in mice with liver-specific G6Pase-alpha deficiency. Disease Models & Mechanisms, 7(9), 1083–1091. [DOI] [PMC free article] [PubMed] [Google Scholar]
- Roy CN, Penny DM, Feder JN, & Enns CA (1999). The hereditary hemochromatosis protein, HFE, specifically regulates transferrin-mediated iron uptake in HeLa cells. The Journal of Biological Chemistry, 274(13), 9022–9028. [DOI] [PubMed] [Google Scholar]
- Ruck P, Wichert G, Handgretinger R, & Kaiserling E (2000). Ep-CAM in malignant liver tumours. The Journal of Pathology, 191(1), 102–103. [DOI] [PubMed] [Google Scholar]
- Saigo K, Yoshida K, Ikeda R, Sakamoto Y, Murakami Y, Urashima T, et al. (2008). Integration of hepatitis B virus DNA into the myeloid/lymphoid or mixed-lineage leukemia (MLL4) gene and rearrangements of MLL4 in human hepatocellular carcinoma. Human Mutation, 29(5), 703–708. [DOI] [PubMed] [Google Scholar]
- Salata H, Cortes JM, de Salamanca RE, Oliva H, Castro A, Kusak E, et al. (1985). Porphyria cutanea tarda and hepatocellular carcinoma: Frequency of occurrence and related factors. Journal of Hepatology, 1(5), 477–487. [DOI] [PubMed] [Google Scholar]
- Sanz-Cameno P, Martin-Vilchez S, Lara-Pezzi E, Borque MJ, Salmeron J, Munoz de Rueda P, et al. (2006). Hepatitis B virus promotes angiopoietin-2 expression in liver tissue: Role of HBV x protein. The American Journal of Pathology, 169(4), 1215–1222. [DOI] [PMC free article] [PubMed] [Google Scholar]
- Sarma UP, Bhetaria PJ, Devi P, & Varma A (2017). Aflatoxins: Implications on health. Indian Journal of Clinical Biochemistry, 32(2), 124–133. [DOI] [PMC free article] [PubMed] [Google Scholar]
- Sartorius K, Makarova J, Sartorius B, An P, Winkler C, Chuturgoon A, et al. (2019). The regulatory role of MicroRNA in hepatitis-B virus-associated hepatocellular carcinoma (HBV-HCC) pathogenesis. Cells, 8(12), 1504. [DOI] [PMC free article] [PubMed] [Google Scholar]
- Schmelzer E, Wauthier E, & Reid LM (2006). The phenotypes of pluripotent human hepatic progenitors. Stem Cells, 24(8), 1852–1858. [DOI] [PubMed] [Google Scholar]
- Schneider-Yin X, van Tuyll van Serooskerken AM, Went P, Tyblewski W, Poblete-Gutierrez P, Minder EI, et al. (2010). Hepatocellular carcinoma in variegate porphyria: A serious complication. Acta Dermato-Venereologica, 90(5), 512–515. 10.2340/00015555-0870. [DOI] [PubMed] [Google Scholar]
- Schuppan D, Ashfaq-Khan M, Yang AT, & Kim YO (2018). Liver fibrosis: Direct antifibrotic agents and targeted therapies. Matrix Biology, 68–69, 435–451. [DOI] [PubMed] [Google Scholar]
- Seda Neto J, Leite KM, Porta A, Fonseca EA, Feier FH, Pugliese R, et al. (2014). HCC prevalence and histopathological findings in liver explants of patients with hereditary tyrosinemia type 1. Pediatric Blood & Cancer, 61(9), 1584–1589. [DOI] [PubMed] [Google Scholar]
- Setshedi M, Wands JR, & Monte SM (2010). Acetaldehyde adducts in alcoholic liver disease. Oxidative Medicine and Cellular Longevity, 3(3), 178–185. [DOI] [PMC free article] [PubMed] [Google Scholar]
- Shen L, Zhang X, Hu D, Feng T, Li H, Lu Y, et al. (2013). Hepatitis B virus X (HBx) play an anti-apoptosis role in hepatic progenitor cells by activating Wnt/beta-catenin pathway. Molecular and Cellular Biochemistry, 383(1–2), 213–222. [DOI] [PubMed] [Google Scholar]
- Shindoh J, Andreou A, Aloia TA, Zimmitti G, Lauwers GY, Laurent A, et al. (2013). Microvascular invasion does not predict long-term survival in hepatocellular carcinoma up to 2 cm: Reappraisal of the staging system for solitary tumors. Annals of Surgical Oncology, 20(4), 1223–1229. [DOI] [PMC free article] [PubMed] [Google Scholar]
- Shiraishi Y, Fujimoto A, Furuta M, Tanaka H, Chiba K, Boroevich KA, et al. (2014). Integrated analysis of whole genome and transcriptome sequencing reveals diverse transcriptomic aberrations driven by somatic genomic changes in liver cancers. PLoS One, 9(12), e114263. [DOI] [PMC free article] [PubMed] [Google Scholar]
- Song J, Gao L, Yang G, Tang S, Xie H, Wang Y, et al. (2014). MiR-199a regulates cell proliferation and survival by targeting FZD7. PLoS One, 9(10), e110074. [DOI] [PMC free article] [PubMed] [Google Scholar]
- Song S, Yang Y, Liu M, Liu B, Yang X, Yu M, et al. (2018). MiR-125b attenuates human hepatocellular carcinoma malignancy through targeting SIRT6. American Journal of Cancer Research, 8(6), 993–1007. [PMC free article] [PubMed] [Google Scholar]
- Stockley RA (2015). The multiple facets of alpha-1-antitrypsin. Annals of Translational Medicine, 3(10), 130. [DOI] [PMC free article] [PubMed] [Google Scholar]
- Strohmeyer G, Niederau C, & Stremmel W (1988). Survival and causes of death in hemochromatosis. Observations in 163 patients. Annals of the New York Academy of Sciences, 526, 245–257. [DOI] [PubMed] [Google Scholar]
- Su F, & Schneider RJ (1996). Hepatitis B virus HBx protein activates transcription factor NF-kappaB by acting on multiple cytoplasmic inhibitors of rel-related proteins. Journal of Virology, 70(7), 4558–4566. [DOI] [PMC free article] [PubMed] [Google Scholar]
- Su F, & Schneider RJ (1997). Hepatitis B virus HBx protein sensitizes cells to apoptotic killing by tumor necrosis factor alpha. Proceedings of the National Academy of Sciences of the United States of America, 94(16), 8744–8749. [DOI] [PMC free article] [PubMed] [Google Scholar]
- Su H, Yang JR, Xu T, Huang J, Xu L, Yuan Y, et al. (2009). MicroRNA-101, down-regulated in hepatocellular carcinoma, promotes apoptosis and suppresses tumorigenicity. Cancer Research, 69(3), 1135–1142. [DOI] [PubMed] [Google Scholar]
- Sucher E, Sucher R, Gradistanac T, Brandacher G, Schneeberger S, & Berg T (2019). Autoimmune hepatitis-immunologically triggered liver pathogenesis-diagnostic and therapeutic strategies. Journal of Immunology Research, 2019, 9437043. [DOI] [PMC free article] [PubMed] [Google Scholar]
- Sung WK, Zheng H, Li S, Chen R, Liu X, Li Y, et al. (2012). Genome-wide survey of recurrent HBV integration in hepatocellular carcinoma. Nature Genetics, 44(7), 765–769. [DOI] [PubMed] [Google Scholar]
- Szabo G, & Bala S (2010). Alcoholic liver disease and the gut-liver axis. World Journal of Gastroenterology, 16(11), 1321–1329. [DOI] [PMC free article] [PubMed] [Google Scholar]
- Sze KM, Ho DW, Chiu YT, Tsui YM, Chan LK, Lee JM, et al. (2020). HBVTERT promoter integration harnesses host ELF4 resulting in TERT gene transcription in hepatocellular carcinoma. Hepatology. In press. [DOI] [PMC free article] [PubMed] [Google Scholar]
- Takano S, Yokosuka O, Imazeki F, Tagawa M, & Omata M (1995). Incidence of hepatocellular carcinoma in chronic hepatitis B and C: A prospective study of 251 patients. Hepatology, 21(3), 650–655. [PubMed] [Google Scholar]
- Tan KW, Chacko AM, & Chew V (2019). PD-1 expression and its significance in tumour microenvironment of hepatocellular carcinoma. Translational Gastroenterology and Hepatology, 4, 51. [DOI] [PMC free article] [PubMed] [Google Scholar]
- Tan A, Koh S, & Bertoletti A (2015). Immune response in hepatitis B virus infection. Cold Spring Harbor Perspectives in Medicine, 5(8), a021428. [DOI] [PMC free article] [PubMed] [Google Scholar]
- Tanguay RM, Angileri F, & Vogel A (2017). Molecular pathogenesis of liver injury in hereditary tyrosinemia 1. Advances in Experimental Medicine and Biology, 959, 49–64. [DOI] [PubMed] [Google Scholar]
- Tarocchi M, Polvani S, Marroncini G, & Galli A (2014). Molecular mechanism of hepatitis B virus-induced hepatocarcinogenesis. World Journal of Gastroenterology, 20(33), 11630–11640. [DOI] [PMC free article] [PubMed] [Google Scholar]
- Teckman JH, An JK, Blomenkamp K, Schmidt B, & Perlmutter D (2004). Mitochondrial autophagy and injury in the liver in alpha 1-antitrypsin deficiency. American Journal of Physiology. Gastrointestinal and Liver Physiology, 286(5), G851–G862. [DOI] [PubMed] [Google Scholar]
- Topic A, Ljujic M, & Radojkovic D (2012). Alpha-1-antitrypsin in pathogenesis of hepatocellular carcinoma. Hepatitis Monthly, 12(10 HCC), e7042. [DOI] [PMC free article] [PubMed] [Google Scholar]
- Tran BM, Flanagan DJ, Ebert G, Warner N, Tran H, Fifis T, et al. (2020). The hepatitis B virus pre-core protein p22 activates Wnt signaling. Cancers, 12(6), 1435. [DOI] [PMC free article] [PubMed] [Google Scholar]
- Trevisani F, D’Intino PE, Morselli-Labate AM, Mazzella G, Accogli E, Caraceni P, et al. (2001). Serum alpha-fetoprotein for diagnosis of hepatocellular carcinoma in patients with chronic liver disease: Influence of HBsAg and anti-HCV status. Journal of Hepatology, 34(4), 570–575. [DOI] [PubMed] [Google Scholar]
- Tsang FH, Au SL, Wei L, Fan DN, Lee JM, Wong CC, et al. (2015). Long non-coding RNA HOTTIP is frequently up-regulated in hepatocellular carcinoma and is targeted by tumour suppressive miR-125b. Liver International, 35(5), 1597–1606. [DOI] [PubMed] [Google Scholar]
- Tu T, Budzinska MA, Shackel NA, & Urban S (2017). HBV DNA integration: Molecular mechanisms and clinical implications. Viruses, 9(4), 75. [DOI] [PMC free article] [PubMed] [Google Scholar]
- Turati F, Galeone C, Rota M, Pelucchi C, Negri E, Bagnardi V, et al. (2014). Alcohol and liver cancer: A systematic review and meta-analysis of prospective studies. Annals of Oncology, 25(8), 1526–1535. [DOI] [PubMed] [Google Scholar]
- Turkez H, & Sisman T (2012). The genoprotective activity of resveratrol on aflatoxin B (1)-induced DNA damage in human lymphocytes in vitro. Toxicology and Industrial Health, 28(5), 474–480. [DOI] [PubMed] [Google Scholar]
- Ueda H, Ullrich SJ, Gangemi JD, Kappel CA, Ngo L, Feitelson MA, et al. (1995). Functional inactivation but not structural mutation of p53 causes liver cancer. Nature Genetics, 9(1), 41–47. [DOI] [PubMed] [Google Scholar]
- Valderrama-Trevino AI, Barrera-Mera B, Ceballos-Villalva JC, & Montalvo-Jave EE (2017). Hepatic metastasis from colorectal cancer. Euroasian Journal of Hepatogastroenterology, 7(2), 166–175. [DOI] [PMC free article] [PubMed] [Google Scholar]
- Valean S, Acalovschi M, Dumitrascu DL, Ciobanu L, Nagy G, & Chira R (2019). Hepatocellular carcinoma in patients with autoimmune hepatitis—A systematic review of the literature published between 1989–2016. Medicine and Pharmacy Reports, 92(2), 99–105. [DOI] [PMC free article] [PubMed] [Google Scholar]
- van Ginkel WG, Pennings JP, & van Spronsen FJ (2017). Liver cancer in tyrosinemia type 1. Advances in Experimental Medicine and Biology, 959, 101–109. [DOI] [PubMed] [Google Scholar]
- Villanueva A, & Luedde T (2016). The transition from inflammation to cancer in the liver. Clinical Liver Disease, 8(4), 89–93. [DOI] [PMC free article] [PubMed] [Google Scholar]
- Vinay DS, Ryan EP, Pawelec G, Talib WH, Stagg J, Elkord E, et al. (2015). Immune evasion in cancer: Mechanistic basis and therapeutic strategies. Seminars in Cancer Biology, 35(Suppl), S185–S198. [DOI] [PubMed] [Google Scholar]
- von Olshausen G, Quasdorff M, Bester R, Arzberger S, Ko C, van de Klundert M, et al. (2018). Hepatitis B virus promotes beta-catenin-signalling and disassembly of adherens junctions in a Src kinase dependent fashion. Oncotarget, 9(74), 33947–33960. [DOI] [PMC free article] [PubMed] [Google Scholar]
- Wang J, Chu Y, Xu M, Zhang X, Zhou Y, & Xu M (2019). miR-21 promotes cell migration and invasion of hepatocellular carcinoma by targeting KLF5. Oncology Letters, 17(2), 2221–2227. [DOI] [PMC free article] [PubMed] [Google Scholar]
- Wang XW, Forrester K, Yeh H, Feitelson MA, Gu JR, & Harris CC (1994). Hepatitis B virus X protein inhibits p53 sequence-specific DNA binding, transcriptional activity, and association with transcription factor ERCC3. Proceedings of the National Academy of Sciences of the United States of America, 91(6), 2230–2234. [DOI] [PMC free article] [PubMed] [Google Scholar]
- Wang XW, Gibson MK, Vermeulen W, Yeh H, Forrester K, Sturzbecher HW, et al. (1995). Abrogation of p53-induced apoptosis by the hepatitis B virus X gene. Cancer Research, 55(24), 6012–6016. [PubMed] [Google Scholar]
- Wang Y, Hu C, Cheng J, Chen B, Ke Q, Lv Z, et al. (2014). MicroRNA-145 suppresses hepatocellular carcinoma by targeting IRS1 and its downstream Akt signaling. Biochemical and Biophysical Research Communications, 446(4), 1255–1260. [DOI] [PubMed] [Google Scholar]
- Wang Y, Lee AT, Ma JZ, Wang J, Ren J, Yang Y, et al. (2008). Profiling microRNA expression in hepatocellular carcinoma reveals microRNA-224 up-regulation and apoptosis inhibitor-5 as a microRNA-224-specific target. The Journal of Biological Chemistry, 283(19), 13205–13215. [DOI] [PubMed] [Google Scholar]
- Wang X, Lu J, Cao J, Ma B, Gao C, & Qi F (2018). MicroRNA-18a promotes hepatocellular carcinoma proliferation, migration, and invasion by targeting Bcl2L10. Oncotargets and Therapy, 11, 7919–7934. [DOI] [PMC free article] [PubMed] [Google Scholar]
- Wang J, Song W, Shen W, Yang X, Sun W, Qu S, et al. (2017). MicroRNA-200a suppresses cell invasion and migration by directly targeting GAB1 in hepatocellular carcinoma. Oncology Research, 25(1), 1–10. [DOI] [PMC free article] [PubMed] [Google Scholar]
- Wei L, Delin Z, Kefei Y, Hong W, Jiwei H, & Yange Z (2020). A classification based on tumor budding and immune score for patients with hepatocellular carcinoma. Oncoimmunology, 9(1), 1672495. [DOI] [PMC free article] [PubMed] [Google Scholar]
- Wei X, Xiang T, Ren G, Tan C, Liu R, Xu X, et al. (2013). miR-101 is down-regulated by the hepatitis B virus x protein and induces aberrant DNA methylation by targeting DNA methyltransferase 3A. Cellular Signalling, 25(2), 439–446. [DOI] [PubMed] [Google Scholar]
- Wen Y, Golubkov VS, Strongin AY, Jiang W, & Reed JC (2008). Interaction of hepatitis B viral oncoprotein with cellular target HBXIP dysregulates centrosome dynamics and mitotic spindle formation. The Journal of Biological Chemistry, 283(5), 2793–2803. [DOI] [PubMed] [Google Scholar]
- Wheeler DA, & Roberts LR (2017). Comprehensive and integrative genomic characterization of hepatocellular carcinoma. Cell, 169(7), 1327–1341.e1323. [DOI] [PMC free article] [PubMed] [Google Scholar]
- Wong QW, Ching AK, Chan AW, Choy KW, To KF, Lai PB, et al. (2010). MiR-222 overexpression confers cell migratory advantages in hepatocellular carcinoma through enhancing AKT signaling. Clinical Cancer Research, 16(3), 867–875. [DOI] [PubMed] [Google Scholar]
- Wong QW, Lung RW, Law PT, Lai PB, Chan KY, To KF, et al. (2008). MicroRNA-223 is commonly repressed in hepatocellular carcinoma and potentiates expression of Stathmin1. Gastroenterology, 135(1), 257–269. [DOI] [PubMed] [Google Scholar]
- Wu Y, Chen W, Xu ZP, & Gu W (2019). PD-L1 distribution and perspective for cancer immunotherapy-blockade, knockdown, or inhibition. Frontiers in Immunology, 10, 2022. [DOI] [PMC free article] [PubMed] [Google Scholar]
- Wu Y, Whitman I, Molmenti E, Moore K, Hippenmeyer P, & Perlmutter DH (1994). A lag in intracellular degradation of mutant alpha 1-antitrypsin correlates with the liver disease phenotype in homozygous PiZZ alpha 1-antitrypsin deficiency. Proceedings of the National Academy of Sciences of the United States of America, 91(19), 9014–9018. [DOI] [PMC free article] [PubMed] [Google Scholar]
- Xiao F, Zhang W, Zhou L, Xie H, Xing C, Ding S, et al. (2013). microRNA-200a is an independent prognostic factor of hepatocellular carcinoma and induces cell cycle arrest by targeting CDK6. Oncology Reports, 30(5), 2203–2210. [DOI] [PubMed] [Google Scholar]
- Xu Y, An Y, Wang Y, Zhang C, Zhang H, Huang C, et al. (2013). miR-101 inhibits autophagy and enhances cisplatin-induced apoptosis in hepatocellular carcinoma cells. Oncology Reports, 29(5), 2019–2024. [DOI] [PubMed] [Google Scholar]
- Xu J, An P, Winkler CA, & Yu Y (2020). Dysregulated microRNAs in hepatitis B virus-related hepatocellular carcinoma: Potential as biomarkers and therapeutic targets. Frontiers in Oncology, 10, 1271. [DOI] [PMC free article] [PubMed] [Google Scholar]
- Xu L, Beckebaum S, Iacob S, Wu G, Kaiser GM, Radtke A, et al. (2014). MicroRNA-101 inhibits human hepatocellular carcinoma progression through EZH2 downregulation and increased cytostatic drug sensitivity. Journal of Hepatology, 60(3), 590–598. [DOI] [PubMed] [Google Scholar]
- Yamashita T, Forgues M, Wang W, Kim JW, Ye Q, Jia H, et al. (2008). EpCAM and alpha-fetoprotein expression defines novel prognostic subtypes of hepatocellular carcinoma. Cancer Research, 68(5), 1451–1461. [DOI] [PubMed] [Google Scholar]
- Yang C, Huang X, Liu Z, Qin W, & Wang C (2020). Metabolism-associated molecular classification of hepatocellular carcinoma. Molecular Oncology, 14(4), 896–913. [DOI] [PMC free article] [PubMed] [Google Scholar]
- Yang X, Wang J, Qu S, Zhang H, Ruan B, Gao Y, et al. (2015). MicroRNA-200a suppresses metastatic potential of side population cells in human hepatocellular carcinoma by decreasing ZEB2. Oncotarget, 6(10), 7918–7929. [DOI] [PMC free article] [PubMed] [Google Scholar]
- Yang T, Zheng ZM, Li XN, Li ZF, Wang Y, Geng YF, et al. (2013). MiR-223 modulates multidrug resistance via downregulation of ABCB1 in hepatocellular carcinoma cells. Experimental Biology and Medicine (Maywood, N.J.), 238(9), 1024–1032. [DOI] [PubMed] [Google Scholar]
- Yongyu Z, Lewei Y, Jian L, & Yuqin S (2018). MicroRNA-18a targets IRF2 and CBX7 to promote cell proliferation in hepatocellular carcinoma. Oncology Research, 26, 1327–1334. [DOI] [PMC free article] [PubMed] [Google Scholar]
- Younossi ZM (2019). Non-alcoholic fatty liver disease—A global public health perspective. Journal of Hepatology, 70(3), 531–544. [DOI] [PubMed] [Google Scholar]
- Yun C, Cho H, Kim SJ, Lee JH, Park SY, Chan GK, et al. (2004). Mitotic aberration coupled with centrosome amplification is induced by hepatitis B virus X oncoprotein via the Ras-mitogen-activated protein/extracellular signal-regulated kinase-mitogen-activated protein pathway. Molecular Cancer Research, 2(3), 159–169. [PubMed] [Google Scholar]
- Zanger UM, Hauri HP, Loeper J, Homberg JC, & Meyer UA (1988). Antibodies against human cytochrome P-450db1 in autoimmune hepatitis type II. Proceedings of the National Academy of Sciences of the United States of America, 85(21), 8256–8260. [DOI] [PMC free article] [PubMed] [Google Scholar]
- Zhang Y, Guo X, Xiong L, Kong X, Xu Y, Liu C, et al. (2012). MicroRNA-101 suppresses SOX9-dependent tumorigenicity and promotes favorable prognosis of human hepatocellular carcinoma. FEBS Letters, 586(24), 4362–4370. [DOI] [PubMed] [Google Scholar]
- Zhang Q, Lou Y, Yang J, Wang J, Feng J, Zhao Y, et al. (2019). Integrated multiomic analysis reveals comprehensive tumour heterogeneity and novel immunophenotypic classification in hepatocellular carcinomas. Gut, 68(11), 2019–2031. [DOI] [PMC free article] [PubMed] [Google Scholar]
- Zhao WT, Lin XL, Liu Y, Han LX, Li J, Lin TY, et al. (2019). miR-26a promotes hepatocellular carcinoma invasion and metastasis by inhibiting PTEN and inhibits cell growth by repressing EZH2. Laboratory Investigation, 99(10), 1484–1500. [DOI] [PubMed] [Google Scholar]
- Zhao LH, Liu X, Yan HX, Li WY, Zeng X, Yang Y, et al. (2016). Genomic and oncogenic preference of HBV integration in hepatocellular carcinoma. Nature Communications, 7, 12992. [DOI] [PMC free article] [PubMed] [Google Scholar]
- Zhou Y, Chen E, Tang Y, Mao J, Shen J, Zheng X, et al. (2019). miR-223 over-expression inhibits doxorubicin-induced autophagy by targeting FOXO3a and reverses chemoresistance in hepatocellular carcinoma cells. Cell Death & Disease, 10(11), 843. [DOI] [PMC free article] [PubMed] [Google Scholar]
- Zoulim F (2005). New insight on hepatitis B virus persistence from the study of intrahepatic viral cccDNA. Journal of Hepatology, 42(3), 302–308. [DOI] [PubMed] [Google Scholar]