Histone H3K9 modifications are a local chromatin event involved in ethanol-induced neuroadaptation of the NR2B gene (original) (raw)
Abstract
Expression of the NMDA receptor 2B (NR2B) gene is upregulated following chronic intermittent ethanol (CIE) treatment and withdrawal, which underlies behavioral alterations in addiction. The goal of this study was to characterize the changes of histone modifications induced by CIE treatment and its subsequent removal associated to the upregulation of NR2B gene transcription. To investigate the involvement of histone acetylation in the effect of ethanol on the NR2B gene, we examined the influence of CIE on histone acetylation in the 5′ regulatory region of NR2B using a qChIP assay. CIE treatment and its subsequent removal produced a remarkable and selected increase in histone H3K9 acetylation. Interestingly, the majority of the increased H3K9 acetylation occurred after ethanol removal, which was coincident with a decrease in H3K9 methylation in the same time duration. Further examination of the mechanisms of ethanol-induced alterations on the histone modifications revealed that CIE-induced acetylation of H3K9 was not due to the changes in global enzyme activities or the expression of histone acetyltransferases (HATs) and deacetylase (HDACs). Instead, we found a significant downregulation in some histone methyltransferases (HMTs) at both the global level and the local chromatin of the NR2B gene following CIE treatment. Moreover, our experiments also indicated a decrease of G9a, Suv39 h1 and HDAC1–3 in the chromatin of the NR2B gene promoter, which may be responsible for the altered H3K9 modifications. Taken together, the findings suggest a mechanism where the changes in H3K9 modifications in the local chromatin of the NR2B gene underlie alcohol-induced neuroadaptation.
Key words: ethanol, histone, acetylation, methylation, epigenetics, cortical neuronal culture, NR2B, gene regulation
Introduction
The NMDA receptor (NMDAR) is a major target of ethanol in the brain.1–3 An increase in NMDAR function has been implicated in ethanol-associated phenotypes, such as tolerance, dependence, withdrawal, craving and relapse.3–5 In particular, withdrawal of alcohol results in hyperactivity of the glutamate system, at least in part from NMDA receptor upregulation.3,6,7 The activity of NMDARs that contain the NR2B subunit mediates several effects of ethanol in the CNS. The fact that NR2B selective antagonists, such as ifenprodil and Ro 25-6981, potently inhibit withdrawal signs in alcohol- and other drug-dependent animals8–12 suggests an important role of this subunit in the development of addiction. Our work and that of others has demonstrated that repeated ethanol exposure and removal causes a long-lasting adaptive increase in NR2B gene expression and channel function in both in vivo12–16 and in vitro models.1,17–22 This may contribute to the molecular and cellular mechanisms underlying the development and maintenance of alcohol withdrawal relevant disorders, which can lead to alcohol drinking behaviors. However, the mechanisms underlying the long-lasting changes in NR2B gene expression during the alcohol withdrawal period remain to be elucidated.
Post-translational histone modifications are involved in the epigenetic regulation of gene expression and genome organization. Modifications of histones have emerged as important mechanisms for the translation of a variety of environmental stimuli, including the administration of drugs of abuse, into specific changes in gene expression.23,24 Despite several reports indicating that histone modifications are involved in alcohol-related events,25,26 it is still unclear how this occurs. Histone modifications typically include acetylation, methylation, phosphorylation and ubiquitination. Histone acetylation and methylation are the two major modifications that function as specific transcription regulators in response to various cellular signals. Among these modifications, histone acetylation is the best studied and is linked to the activation of gene transcription.27 Histone methylation, on the other hand, can result in either activation or repression of transcription; depending on the residue that is modified within the histone protein (e.g., H3K9 and H3K27 are associated with transcriptional repression, whereas H3K4 and H3K36 are associated with transcriptional activation). Moreover, it has recently been shown that extensive crosstalk between DNA and histone methylation,28,29 histone acetylation and methylation,30,31 and histone phosphorylation and acetylation32–34 occurs, which may indicate a concerted epigenomic mechanism. Recently, we demonstrated that chronic intermittent ethanol (CIE) treatment and removal induced DNA demethylation in a site-specific manner in the 5′ regulatory region of the NR2B gene.35 These changes in DNA demethylation persisted after ethanol removal and correlated with a compensatory upregulation in the expression of the NR2B gene. Since DNA methylation interacts with histone modifications in many ways for the regulation of gene expression, we decided to determine whether CIE treatment concomitantly alters the state of histone modifications, which may mediate CIE-induced NR2B gene upregulation. Using a cortical neuronal cell culture model, we report here that CIE causes a selective and substantial increase in the acetylation of histone 3 at the K9 lysine residue, which occurs concomitantly with a decrease in histone H3K9 di- and tri-methylation in the chromatin context of the NR2B gene promoter. This process is likely mediated by a CIE-induced reduction of histone methyltransferase (HMT), Suv39 h1, and its local interaction with histone deacetyltransferases (HDACs) in chromatin. The findings of this study suggest a potential mechanism for the neuroadaptation of the NR2B gene following CIE treatment and its removal.
Results
Trichostatin A (TSA) induces an upregulation of NR2B gene transcription.
Histone acetylation strongly enhances gene transcription36–39 and is an extensively studied epigenetic marker. To provide evidence that histone acetylation could be involved in the regulation of NR2B gene transcription, we studied effects of the histone deacetylase inhibitor TSA in primary cortical neuronal cultures. TSA was used in two doses (0.1 µg/ml and 1 µg/ml) and at two time points (24 h and 5 d). After a 24 h treatment, a significant effect was observed at the higher dose (1 µg/ml), but not at the lower dose (0.1 µg/ml). Repeated treatment with TSA at the lower dose (0.1 µg/ml) also caused an increase in NR2B gene expression (Fig. 1). Thus, increasing histone acetylation by inhibiting its deacetylation increases NR2B gene expression and furthermore an effect can be seen after 5 days of treatment with a low dose. Because of this, we then proceeded to study effects of CIE treatment for 5 days.
Figure 1.

TSA increases NR2B gene transcription. The cortical neuronal cultures were treated with the histone deacetylase inhibitor TSA at the indicated concentration and duration. For the 24 h treatment, TSA was added to the culture medium and harvested at the end of 24 h. For the 5-day treatment, TSA was added freshly each day with fresh medium. Total RNA was isolated and qPCR was performed to measure NR2B mRNA expression. The expression of GAPDH was used as the internal control. Results are presented as the mean ratio to control ± SEM; *p < 0.05; ***p < 0.001 compared to control levels (one-way ANOVA, F = 42.62, p < 0.0001, post hoc Newman-Keuls post hoc comparison).
The validation of the CIE model for studying histone modifications associated with the regulation of NR2B gene transcription in primary cortical neuronal cultures.
Although chronic ethanol-induced upregulation of NR2B expression found in animals and neuronal cultures was consistent with that founded in previous studies in references 1, 14–22, it has been reported that NR2B expression is developmentally regulated.40–42 To validate our cortical neuronal culture model, we isolated RNA from our neuronal cultures from DIV 3, 6, 8 and 13. Real-time PCR results (Fig. 2A) indicate that during the 10 day experimental period, NR2B mRNA expression significantly increased over time compared to the value at DIV 3 (one-way ANOVA, F = 8.33, N = 3, p < 0.001). These developmental effects were observed on both NR2B gene expression and histone modifications. Because of this, appropriate age matched control value were used when evaluating the effect of CIE treatment. As shown in Figure 2C, effects of CIE in cells at different times of division (3–7 days vs. 8–13 day) were very similar. Therefore, these results validate our cell culture model for studying neuronal adaptive changes in histone modifications in response to chronic ethanol treatment and removal.
Figure 2.

(A) Developmental changes of NR2B gene transcription in primary cultured neurons. Total RNA were isolated from cultured neuronal cells at DIV 3, 6, 8 and 13. Real time PCR was performed to amplify NR2B mRNA expression. The expression of GAPDH was used as the internal control. Values are presented as means ± SEM and represent the fold increases verse the value of DIV 3. *p < 0.05, ***p < 0.001 compared to those in DIV 3. (B) Developmental changes of histone H3-K9 acetylation and dimethylation. The neurons were harvested from same time points and ChIP assay was performed with the anti-Ac-H3K9 and anti-dimethylation-H3K9 antibodies and followed by real time PCR to amplify the two regions on the NR2B promoter (see Fig. S1). Values are presented as means ± SEM and represent the fold increases over the control (control = 1). *p < 0.05, **p < 0.01 and ***p < 0.001 compared to the control. (C) Comparison of the changes of histone H3-K9 acetylation and methylation in response to CIE treatment between DIV 3–7 and DIV 8–13. The cultures were treated with the CIE regimen during DIV 3–7 and DIV 8–13, respectively. Their respective age-matched controls were subjected to the media changes for the same duration. The ChIP assay was performed with the anti-Ac-H3K9 and anti-dimethyl-H3K9 antibodies followed by real time PCR to amplify the two regions on the NR2B promoter. Values are presented as means ± SEM and represent the fold changes over the control (control = 1).
CIE selectively increases histone acetylation at H3K9.
We have previously reported a persistent upregulation of NR2B gene transcription following CIE treatment and its subsequent removal.17,22 To investigate whether histone acetylation is involved in mediating this effect of ethanol, we examined the effect of CIE on histone acetylation in the chromatin region of the NR2B gene using qChIP assay. A preliminary experiment was performed to examine H3K9 acetylation on the NR2B 5′ regulatory region and showed that histone acetylation of H3K9 increased robustly at selected regions A, B, C and G in the NR2B 5′ regulatory region (Fig. S1 and Table S1). Since regions B, C and G are related to our previous finding in DNA methylation,35 we used these three regions to examine the effect of ethanol on histone modifications (Figs. 3 and 4).
Figure 3.

Ethanol-induced changes in histone acetylation. Multiple qChIP assays were performed to examine the acetylation levels of H3 and H4 in Areas B, C and G in the 5′ regulatory region of the NR2B, respectively. There specific antibodies (see Methods) used are indicated in each sub-graph. Data shown are the representatives of 3 separate experiments. Values are presented as means ± SEM and represent the fold change over their corresponding controls (control = 1). *p < 0.05, **p < 0.01 and ***p < 0.001, two-way MANOVA followed by Newman-Keuls post hoc comparison.
Figure 4.

Ethanol-induced selective histone H3K9 acetylation. Multiple qChIP assays were performed to examine the acetylation levels of the indicated residues of histone H3 in Areas B, C and G in the 5′ regulatory region of the NR2B, respectively. Specific antibodies (see Methods) used are indicated in each sub-graph. Data shown are the representatives of three separate experiments. Values are presented as means ± SEM and represent the fold change over their corresponding controls (control = 1). *p < 0.05, **p < 0.01 and ***p < 0.001, two-way MANOVA followed by Newman-Keuls post hoc comparison.
All core histones are acetylated in vivo, but the acetylation of H3 and H4 has been more extensively characterized than that of H2A and H2B. Therefore, to specifically assess this modification, we first carried out the qChIP assay using antibodies specific to Ac-H3 and Ac-H4. A two-way MANOVA indicated that ethanol treatment had a significant effect on H3 acetylation, but not in H4 acetylation (Table S2). CIE had no effect on the acetylation of H3 or H4 compared to the controls, whereas removal from CIE selectively increased the histone acetylation and H3 acetylation (Fig. 3). To further determine the specificity of the effect of ethanol on H3 acetylation, we performed multiple qChIP experiments on H3 acetylation by analyzing the six different lysine residues (H3K-4, -9, -14, -18, -23 and -27) using site-specific anti-Ac histone H3 antibodies. The results showed that ethanol treatment selectively increased the acetylation of H3K9 (two-way MANOVA, Table S3); essentially this occurred only upon removal from CIE. In general, removal of CIE for five days had an even greater effect than removal for two days (Fig. 4).
Mechanisms involved in ethanol-induced histone acetylation.
The effect of CIE on HAT and HDAC activities. Histone acetylation is regulated by a balance of opposing HAT and HDAC activities. The activity of these enzymes may be direct targets of ethanol.43 To investigate the mechanism regarding CIE-induced alterations of H3K9 acetylation, we next examined the effect of ethanol on the activities of HATs and HDACs. Nuclear extracts were prepared as sources of HATs and HDACs from cortical neuronal cultures treated with or without CIE. For the HAT assay, six micrograms of nuclear extracts from control or CIE-treated cell cultures were incubated with unmodified H3 peptides. The acetylation level of the H3 peptide was measured as fluorescent units. The HDAC assay was performed using a similar method. As a control, TSA was used and effectively inhibited HDAC activity in the control samples. However, neither HAT nor HDAC activity was affected by ethanol treatment and removal (Fig. 5). These data suggest that ethanol-induced histone acetylation may act through indirect mechanisms.
Figure 5.

HAT and HDAC activities. Nuclear extracts were prepared and incubated with unmodified histone H3 peptide. HAT and HDAC activity assays were performed and the acetylation level of the peptide was measured. Values are presented as means ± SEM of three separate experiments. p > 0.05 (one-way ANOVA, F = 0.048, p = 0.985).
The effect of CIE on the expression of epigenetic modification enzymes. A host of enzymes, including HATs, HDACs and HMTs, have been reported to regulate histone modifications.44–46 The expression of these proteins is influenced by various environmental factors.47–50 Therefore, we next analyzed 59 enzymes categorized as HATs, HDACs or HMTs to examine the possible changes in the expression of these enzymes that were produced by CIE treatment and removal. A qPCR array analysis was performed and the data were analyzed by a two-way ANOVA followed by Newman-Keuls post hoc comparison. No significant changes in any of the HATs or HDACs were found, which is consistent with the result from the HAT and HDAC activity experiments. However, CIE induced a significant decrease in the expression of nine genes (G9a, Prmt6, Setdb2, Suv39 h1, Setd1a, Setd1b, Setd4, Setd6 and Setdb1) from the histone HMTs family (Table S4).
CIE induces a decrease in histone methylation at H3K9 on the NR2B regulatory region. Histone H3K9 can be mono-, di- and trimethylated.51,52 H3K9 dimethylation (H3K9Me2) and trimethylation (H3K9Me3) are hallmarks of transcriptionally repressed chromatin.44,52,53 To determine whether the CIE-mediated reduction of histone methyltransferase expression reflects the reduction of the methylation level at H3K9, neuronal cells were treated with the CIE regimen and a qChIP assay using anti-dimethyl- and anti-trimethyl-H3K9 antibodies was carried out, respectively. The methylation levels of H3K9Me2 and H3K9Me3 were similarly reduced. In Area A, B and C (H3K9Me2) and Area A, B and G (H3K9Me3), these changes appeared with CIE and lasted during the five-day removal period. Whereas, in most the other areas, when changes occurred, they were generally associated with removal (Fig. 6 and Table S3).
Figure 6.

Ethanol-mediated reduction of histone H3K9Me2 and H3K9Me3 methylation. A to G represent the seven amplified regions by qPCR on the 5′ regulatory area of the NR2B shown as Figure S4. Methylation levels of H3K9Me2 and H3K9Me3 in the NR2B 5′ regulatory region were determined by the qChIP assay with antibodies specific for H3K9 dimehtylation (Upstate, 07-441) and trimethylation (abcam, ab8898), respectively. Values are presented as means ± SEM and represent the fold changes over their corresponding controls. *p < 0.05, **p < 0.01 and ***p < 0.001, two-way MANOVA followed by Newman-Keuls post hoc comparison.
The interaction between Suv39 h1 and HDACs. A recent study found that different H3K9 HMTs can functionally cooperate to regulate gene expression in a multimeric complex that includes the Suv39 h1 family of proteins as well as other cofactors.54 In addition, Suv39 h1 has been reported to physically interact with HDAC-1, -2 and -3, which appears to subsequently mediate chromatin repression through HDAC activity.31 We therefore addressed whether such cooperation also occurs at the NR2B promoter locus. Using the qChIP assay with antibodies to Suv39 h1 and HDACs, we examined the status of the genomic occupancy of Suv39 h1, G9a and HDAC -1, -2 and -3, separately. Our results not only confirmed the expected reduction of Suv39 h1 and G9a binding (Fig. 7 and Table S5) in Areas B and C in the NR2B promoter, but also showed that HDAC1-3 also had reduced binding in both Area B and C (Fig. 8 and Table S6). In an attempt to provide further evidence that Suv39 h1 and HDACs regulate H3K9 in a cooperative manner, a qRe-ChIP assay was performed using anti-Suv39 h1 and then anti-HDACs antibodies, followed by qPCR. The co-occupancy of Suv39 h1 and HDACs was greatly reduced after CIE treatment and removal in region B and significantly reduced after CIE and P2 in region C (Fig. 9), which suggests the possibility of co-regulation of the H3K9 modification.
Figure 7.

CIE-induced loss of occupancy of G9a and Suv39 h1 at the NR2B promoter. qChIP assays were performed with antibodies specific for histone methyltransferase G9a and Suv39 h1 (abcam, ab40542 and ab12405), respectively. Data shown represent an average of 3 separate experiments. Values are presented as means ± SEM of the fold increase over their corresponding controls (control = 1). *p < 0.05 and **p < 0.01, two-way MANOVA followed by Newman-Keuls post hoc comparison.
Figure 8.

CIE-induced loss of occupancy of HDACs to the NR2B 5′ regulatory region. Region B and C are the representative regions in the 5′ regulatory region of the NR2B. The qChIP assays were performed with antibodies to HDAC1-3 (HDAC1 and HDAC2, Active motif, 39532 and 39533; HDAC3, abcam, ab7030) in region B and C. Data shown are representatives of 4 separate experiments. Values are presented as means ± SEM and represent the fold increase over their corresponding controls (control = 1). *p < 0.05 and **p < 0.01, two-way MANOVA followed by Newman-Keuls post hoc comparison.
Figure 9.
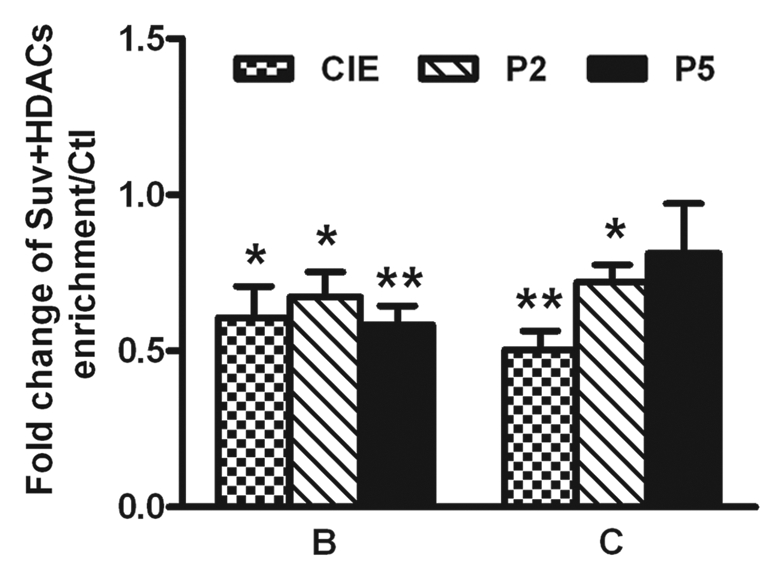
CIE-induced loss of co-occupancy of Suv39 h1 and HDACs to chromatin at the NR2B 5′ regulatory region. B and C are the representative regions in the 5′ regulatory region of the NR2B described in Figure S1. qRe-ChIP assays were performed with antibodies against Suv39 h1 and HDAC1-3. Data shown are representatives of the mean of 3 separate experiments. Values are presented as means ± SEM and represent the fold increases over their corresponding controls (control = 1). *p < 0.05 and **p < 0.01, two-way ANOVA followed by Newman-Keuls post hoc comparison.
Discussion
Repeated ethanol treatment-induced histone modifications that selectively occur at the H3K9 residue in the NR2B gene promoter region may underlie a role in neuroadaptation.
The CIE exposure regimen, which consists of repeated episodes of ethanol intoxication and removal, can result in persistent molecular and cellular adaptations during the period of ethanol withdrawal.2,6 These molecular adaptations lead to the functional alterations that characterize addiction: tolerance, dependence, withdrawal, craving and relapse.55 Emerging evidence indicates that histone modifications are involved in alcohol and other drug actions.25,43,48 To investigate the role of histone modifications on the adaptive events regarding ethanol treatment and removal, we treated cortical neuronal cultures with the CIE regimen and examined the changes of histone modifications on the NR2B 5′ regulatory region in different stages of ethanol exposure and removal. The amino-terminal tails of histones are subjected to chemical modifications including acetylation and methylation, and the acetylation of lysine residues on histones H3 and H4 leads to the formation of an open chromatin structure. In the case of H3, acetylation is known to occur at Lys-4, -9, -14, -18, -23 and -27. We first investigated the effect of ethanol on the histone acetylation levels of H3 and H4 in the NR2B gene promoter region using a qChIP assay and found that only H3 was influenced by CIE treatment. To specify the CIE-induced changes of histone acetylation, we subsequently examined acetylation at different residues of histone H3. The results indicated that CIE treatment and removal robustly and selectively increased histone acetylation at H3 Lys9. It is worthwhile to note that the majority of the significant alterations occurred after ethanol removal, including acetylation as well as the corresponding modifications in histone methylation and enzymatic machinery, although some regions had significant alterations after CIE treatment. The NMDA receptor has been commonly considered to be a critical component in withdrawal-related hyperexcitation, whereas NR2B upregulation clearly contributes to the hyperexcitation.10,11 Therefore, the changes in histone acetylation that are linked to removal-related upregulation of the NR2B gene may be critically involved in alcohol withdrawal symptoms. Although animal behavioral data are not currently available, the observed removal-related alterations in histone modifications are consistent with previously reported studies on other types of drug abuse. For example, the level of acetylated H3 at the BDNF promoter was strikingly high after one week of withdrawal from cocaine exposure.56 A similar increase in H3 acetylation at the NPY promoter was also seen within ten days of abstinence from cocaine exposure.57 These experiments resulted in long-lasting changes in drug seeking behavior. However, the exact mechanisms responsible for these observations will require further assessment using adequate animal models in future studies.
The CIE-induced increase in histone acetylation is most likely a local event that may be derived from reduced histone methylation during CIE removal.
Histone acetylation is highly regulated by two families of enzymes: HATs and HDACs. The expression and activity of these enzymes as direct targets of ethanol has been reported in rat hepatocytes43,58 and rat amygdala.25 However, in this study, we failed to find a differential change in either gene expression or enzyme activity at the global level after CIE treatment and removal, although there was a significant increase in acetylation at H3K9 in the chromatin region of the NR2B gene.
H3K9 is the only residue that can be acetylated or methylated, but not both at the same time.59 Previously studies have shown that histone H3K9 acetylation is “inversely correlated” with H3K9 methylation.60,61 Since histone acetylation and methylation are mutually exclusive at H3 Lys9, a relative ratio of acetylation to methylation was used to evaluate the dynamics of modifications in this particular gene loci.28 Therefore, in a specific gene locus, the balance of these two modifications is the determinant to either facilitate the activation or repression of a specific transcriptional program. In agreement with this, we found that CIE removal-induced increases in histone H3 Lys9 acetylation were well associated with decreased histone H3 Lys9 methylation in the NR2B regulatory region during CIE removal. To provide further evidence for the possible interaction between the enzymes at Lys9, Suv39 h1, an enzyme that specifically catalyzes histone H3K9 methylation,33 was found to decrease in occupancy with HDAC 1–3 in the promoter region of the NR2B gene. Therefore, it is possible that the reduced expression of histone methylation enzymes is involved in controlling the balance between methylation and acetylation at histone H3K9 through the interacting with HDACs, whereas the increased acetylation may be a consequence of the decrease in histone methylation. In addition, different HDAC may have role in different stages. For example, the HDAC1 and 3 may be responsible for the alteration after CIE treatment; whereas the HDAC 2 for those during P2 and P5 (Fig. 8). Thus, the mechanism of chromatin remodeling that contributes to the long-lasting upregulation of NR2B gene transcription may be a local event at this specific chromatin context.
Both H3K9Me2 and H3K9Me3 mediate the ethanol effect on the NR2B promoter.
One of the most abundant and stable histone modifications is methylation of histone H3 at H3K9, which has been recently reported to occur in both the gene repression in cognition and adaptive behavior.48,62 Histone H3K9 can be mono-, di- and tri-methylated,51,52 and each degree of modification has been associated with different biological responses.63 In mammals, an earlier study indicated that heterochromatic regions are highly trimethylated on H3K9 and are associated with Suv39 h1 and Suv39 h2 methyltransferases, whereas silent euchromatin regions are enriched for mono- and dimethylated H3K9 and are associated with a methyltransferase complex that includes GLP/G9a.64 A recent observation demonstrated a more complicated interaction between the two enzymes. For example, many G9a targeted gene promoters are trimethylated on H3K9, suggesting that G9a recruits a H3K9 trimethylase to ensure they remain silenced. A subset of G9a targeted genes is upregulated in cells that lack the Suv39 h trimethylase, which is associated with a decrease in H3K9 di- and trimethylation at the corresponding promoters.54 In agreement with these studies, we found that CIE-induced alterations in H3K9 methylation had a similarly decreased pattern in both H3k9Me2 and H3K9Me3 in the chromatin of the NR2B promoter. Moreover, the reduced methylation level occurred concomitantly with the global downregulated of histone methyltransferases G9a, Suv39 h1 and Setdb1 expression, which all catalyze the addition of methyl groups to lysine 9 on histone 3. Accordingly, there was reduction in the binding of G9a and Suv39 h1 to chromatin, although no change was observed for Setdb1 in this study. A more recent study demonstrated that Suv39 h1, Setdb1, G9a and GLP participate in a multimeric complex, and this complex is likely to be involved in the regulation of both gene expression and pericentric heterochromatin formation,54 suggesting that a new regulatory mechanism may exist in CIE-induced neuroadaptation of NR2B expression. In addition, we found that the downregulated Suv39 h1 recovered to the level of control group by P5 (Table S4), whereas the trimethylation levels in most regions remained low (Fig. 6). A possible explanation for this observation is that the local Suv39 h1 may participate in a multimeric complex,54 in which the other components, such as G9a and GLP may impact Suv39 h1's local distribution and function. Thus, the local level of Suv39 h1 and trimethylation could differ in some regions from global level of gene expression at P5.
Histone modifications associate with DNA methylation in mediating CIE-induced upregulation of the NR2B gene.
Histone methylation, like DNA methylation, is a stable, heritable chromatin modification that regulates long term changes in gene expression. Studies have shown that both DNA and histone methylation are critical for neural functions, including high order cognitive functions such as learning and memory.65,66 Moreover, each modification appears to be involved in the regulation of the other. In the present study, we showed that CIE treatment results in a loss of H3K9 methylation during the subsequent removal of ethanol, which is similar to our previously published results that showed CIE-induced DNA demethylation of cytosines in the NR2B regulatory region during removal of ethanol.35 We found that application of 5′AZA, a DNA methyltransferase, caused a marked increase in histone H3K9 acetylation in this region (Fig. S2). Similarly, a mutual regulation relationship has previously been shown. For example, in mouse embryonic stem cells, DNA methylation by DNMT3A and DNMT3B is dependent on Suv39 h1-mediated histone methylation.67 H3K9 methylation has the ability to direct DNA methylation in Neurospora crassa.68,69 In turn, when DNA methyltransferase was inhibited by 5-aza-CdR, the promoter was demethylated, which resulted in an increase in acetylation and decrease in methylation of the histone.70 However, direct evidence for the interactions between histone methylation and DNA methylation in matured neurons is limited. Our present study presents the possibility that DNA and histone methylation may have a mutually reinforcing relationship in the formation of the long-lasting effect that ethanol and other abused drugs cause.71
Based on the finding of this study, we propose the following mechanistic model: CIE treatment and removal initially induces the downregulation of a set of HMTs (e.g., G9a, Suv39 h1 and others observed in this study), although the impact of some of the other enzymes on the actions of ethanol has not yet been determined. The downregulation results in reduced methylation of H3K9 lysine residue. These enzymes may work in a complex that possesses a lower level of Suv39 h1, which subsequently decreases the recruitment of HDACs. With a balance of HATs and HDACs, the histone acetylation level inversely increases on the same residue of the local chromatin of the NR2B gene. Consequently, these changes promote, at least in part, NR2B transcription. Taken together, the findings observed in this study may improve our understanding of the complex biological mechanisms of addiction.
Materials and Methods
Cell culture and CIE model.
Primary cortical neurons were prepared from C57BL/6 mouse fetuses as previously described in reference 22, with minor modifications. The cultured cells were assigned to one of the following four groups: Controls (Ctls), neurons were kept in normal medium and subjected to the media changes at the time of treatments for each of the other three groups, respectively; CIE, neurons were exposed to 75 mM ethanol for five cycles, with each cycle consisting of 14 h of ethanol exposure followed by a 10 h intermittent removal of ethanol (neurons were harvested in the last cycle after 14 h of ethanol treatment); P2 (two days post-CIE), CIE treatment plus two days of full removal of ethanol; and P5 (5 days post-CIE), CIE treatment plus five days of full removal of ethanol. The ethanol-treated neuronal cultures were kept in an incubator saturated with ethanol, which maintained the ethanol concentration at the level added to the medium as determined by the constant monitoring of the alcohol concentration using an Analox AM1 analyzer (Analox Instruments USA). During the removal cycles, the cultures were kept in a separate ethanol-free incubator. In view of the developmental changes during culture, we started treatments at different times for the different groups and harvested cells at the same age (DIV 13) as cultured neurons (e.g., Ctls, no ethanol treatment; CIE, starting ethanol treatment on DIV 8; P2, on DIV 6; and P5, on DIV 3).
RNA isolation.
Total RNA was isolated from cultured primary neurons with or without CIE treatment using the mirVanaTM miRNA isolation kit (Ambion, AM1561) according to the manufacturer's instructions. RNA concentration and integrity were determined using the NanoDrop 2000c (Fisher Scientific).
qPCR and qPCR array.
Two-step qPCR was performed as previously described in reference 72. Using 1 µg of total RNA as the template, single-stranded cDNAs were synthesized using random hexamers and the TaqMan reverse transcription reagent kit (Applied Biosystems, N808-0234). For the qPCR reaction, probe and primers (Applied Biosystems, Mm00433820) were used for NR2B expression and SyBr green plus primers were used for the other genes. qPCR was performed using the ABI Prism 7900 sequence detection system. The 2−ΔΔCt method was used for quantification with 18S or GAPDH as the endogenous control. Gene expression in CIE treated cells was expressed as fold changes compared to the control.
Epigenetic modification enzyme rodent qPCR Arrays (SABiosciences, PAMM-085) were performed using the cDNA described above for qPCR. Fifty-nine enzymes categorized as HATs, HDACs or HMTs were examined. All reagents were obtained from same kit. Automatic baseline settings and a threshold of 0.2 were used. Cycle threshold (Ct) values were obtained and fold changes were calculated with the template provided by SABiosciences.
ChIP/Re-ChIP assay and qChIP.
ChIP/Re-ChIP assays were performed as previously described in reference 35 and 73, by using ChIP Express/Re-ChIP kits (Active Motif, 53008/102289). Briefly, cultured primary cortical neurons were cross-linked with 1% formaldehyde for 10 min at room temperature, then glycine was added to stop the fixation, and the cell pellets were then lysed. The nuclei were collected and subjected to shearing by sonication. One-tenth of the sheared DNA was kept to evaluate fragment size and DNA concentration before immunoprecipitation and used as the input. The sizes of the majority of sonicated genomic DNA range from 300 to 600 bp. Equal amounts of the soluble chromatin from each sample were subjected to immunoprecipitation with different antibodies or IgG (negative control) as indicated. The complexes were drawn off with protein G magnetic beads and washed sequentially with wash buffer provide by the kits. For the Re-ChIP assay, we then processed the second immunoprecipitation with different antibodies that followed by a similar washing procedure. Finally, the cross-linking was reversed and the samples were treated with proteinase-K. DNA fragments were then purified with a DNA extraction kit (Qiagen, 28106).
The levels of histone acetylation and methylation in the 5′ regulatory area of the NR2B gene were determined by measuring the amount of enrichment in the chromatin area by qPCR. Primers were used as previously described in reference 35. To control the specificity of antibody binding, we used non-immune rabbit IgG (Santa Cruz Biotechnology, sc-324) to immunoprecipitate chromatin samples, which resulted in negligible levels as determined by qPCR (data not shown). For an internal control of qChIP, we designed primers to amplify the GAPDH promoter (F: 5′-CCA AAG ACA GAA GCC AGG AG-3′; R: 5′-CAT CGA ACC TCT CCC CAT TA-3′). The level of binding at the promoter of the GAPDH gene was measured and no difference was found after CIE treatments.35
Measurement of HAT and HDAC activities.
HAT and HDAC were examined by using HAT and HDAC Assay Kits (Active Motif, 56, 100 and 56200), respectively, according to the manufacturer's instructions. Nuclear extracts from cultured cortical neurons were prepared as previously described in reference 72. For the HAT assay, preliminary experiments measuring the response (i.e., the incorporation of acetyl-CoA into an H3 peptide) by using different amounts of nuclear extract (0–20 µg) and a constant amount of acetyl-CoA (100 µM) showed that HAT activity increased with increasing amounts of nuclear extract, suggesting that the acetyl-CoA level was not rate limiting in this range. Six micrograms of nuclear extracts from control or CIE-treated cell cultures were incubated with 20 µl of unmodified H3 peptide for 30 min at room temperature. All samples were measured in duplicate. The acetylation level of H3 peptides was measured using a fluorescent plate reader. The HDAC assay was performed similarly. In this assay, TSA was used as a control.
Statistics.
Two-way MANOVA followed by Student Newman-Keuls multiple comparison tests were used to assess the significance of the differences between CIE treatments and individual promoter region when there were multiple dependent variables. One-way or two-way ANOVA followed by Newman-Keuls multiple comparison tests were used for all other data when necessary.
Acknowledgments
The authors especially thank Drs. Alan Frazer and Randy Strong for the helpful discussion of the results and critically reading the manuscript. The authors also thank Dr. Shoujun Zhao (University of California, San Francisco) for his help with the qPCR Array data analysis, as well as Ms. Weiqun Tong and Dr. Megan Green (The University of Texas Health Science Center at San Antonio) for their help with the MANOVA analysis. This research is supported by NIAAA AA017362.
Abbreviations
CIE
chronic intermittent ethanol
ChIP
chromatin immunoprecipitation
HATs
histone acetyltransferases
HDACs
histone deacetylase
HMTs
histone methyltransferases
NMDAR
NMDA receptor
Supplementary Material
Supplementary Material
References
- 1.Kumari M, Ticku MK. Regulation of NMDA receptors by ethanol. Prog Drug Res. 2000;54:152–189. [PubMed] [Google Scholar]
- 2.Ron D, Jurd R. The “ups and downs” of signaling cascades in addiction. Sci STKE. 2005;2005:14. doi: 10.1126/stke.3092005re14. [DOI] [PubMed] [Google Scholar]
- 3.Krystal JH, Petrakis IL, Mason G, Trevisan L, D'Souza DC. N-methyl-D-aspartate glutamate receptors and alcoholism: reward, dependence, treatment and vulnerability. Pharmacol Ther. 2003;99:79–94. doi: 10.1016/s0163-7258(03)00054-8. [DOI] [PubMed] [Google Scholar]
- 4.Khanna JM, Shah G, Weiner J, Wu PH, Kalant H. Effect of NMDA receptor antagonists on rapid tolerance to ethanol. Eur J Pharmacol. 1993;230:23–31. doi: 10.1016/0014-2999(93)90405-7. [DOI] [PubMed] [Google Scholar]
- 5.Holter SM, Danysz W, Spanagel R. Novel uncompetitive N-methyl-D-aspartate (NMDA)-receptor antagonist MRZ 2/579 suppresses ethanol intake in long-term ethanol-experienced rats and generalizes to ethanol cue in drug discrimination procedure. J Pharmacol Exp Ther. 2000;292:545–552. [PubMed] [Google Scholar]
- 6.Littleton J. Neurochemical mechanisms underlying alcohol withdrawal. Alcohol Health Res World. 1998;22:13–24. [PMC free article] [PubMed] [Google Scholar]
- 7.Grant KA, Valverius P, Hudspith M, Tabakoff B. Ethanol withdrawal seizures and the NMDA receptor complex. Eur J Pharmacol. 1990;176:289–296. doi: 10.1016/0014-2999(90)90022-x. [DOI] [PubMed] [Google Scholar]
- 8.Nagy J, Horvath C, Farkas S, Kolok S, Szombathelyi Z. NR2B subunit selective NMDA antagonists inhibit neurotoxic effect of alcohol-withdrawal in primary cultures of rat cortical neurones. Neurochem Int. 2004;44:17–23. doi: 10.1016/s0197-0186(03)00100-1. [DOI] [PubMed] [Google Scholar]
- 9.Nagy J, Laszlo L. Increased sensitivity to NMDA is involved in alcohol-withdrawal induced cytotoxicity observed in primary cultures of cortical neurones chronically pre-treated with ethanol. Neurochem Int. 2002;40:585–591. doi: 10.1016/s0197-0186(01)00131-0. [DOI] [PubMed] [Google Scholar]
- 10.Narita M, Soma M, Mizoguchi H, Tseng LF, Suzuki T. Implications of the NR2B subunit-containing NMDA receptor localized in mouse limbic forebrain in ethanol dependence. Eur J Pharmacol. 2000;401:191–195. doi: 10.1016/s0014-2999(00)00428-3. [DOI] [PubMed] [Google Scholar]
- 11.Bisaga A, Popik P, Bespalov AY, Danysz W. Therapeutic potential of NMDA receptor antagonists in the treatment of alcohol and substance use disorders. Expert Opin Investig Drugs. 2000;9:2233–2248. doi: 10.1517/13543784.9.10.2233. [DOI] [PubMed] [Google Scholar]
- 12.Wang J, Carnicella S, Phamluong K, Jeanblanc J, Ronesi JA, Chaudhri N, et al. Ethanol induces long-term facilitation of NR2B-NMDA receptor activity in the dorsal striatum: implications for alcohol drinking behavior. J Neurosci. 2007;27:3593–3602. doi: 10.1523/JNEUROSCI.4749-06.2007. [DOI] [PMC free article] [PubMed] [Google Scholar]
- 13.Nelson TE, Ur CL, Gruol DL. Chronic intermittent ethanol exposure enhances NMDA-receptor-mediated synaptic responses and NMDA receptor expression in hippocampal CA1 region. Brain Res. 2005;1048:69–79. doi: 10.1016/j.brainres.2005.04.041. [DOI] [PubMed] [Google Scholar]
- 14.Roberto M, Bajo M, Crawford E, Madamba SG, Siggins GR. Chronic ethanol exposure and protracted abstinence alter NMDA receptors in central amygdala. Neuropsychopharmacology. 2006;31:988–996. doi: 10.1038/sj.npp.1300840. [DOI] [PubMed] [Google Scholar]
- 15.Henniger MS, Wotjak CT, Holter SM. Long-term voluntary ethanol drinking increases expression of NMDA receptor 2B subunits in rat frontal cortex. Eur J Pharmacol. 2003;470:33–36. doi: 10.1016/s0014-2999(03)01787-4. [DOI] [PubMed] [Google Scholar]
- 16.Follesa P, Ticku MK. Chronic ethanol treatment differentially regulates NMDA receptor subunit mRNA expression in rat brain. Brain Res Mol Brain Res. 1995;29:99–106. doi: 10.1016/0169-328x(94)00235-7. [DOI] [PubMed] [Google Scholar]
- 17.Sheela Rani CS, Ticku MK. Comparison of chronic ethanol and chronic intermittent ethanol treatments on the expression of GABA(A) and NMDA receptor subunits. Alcohol. 2006;38:89–97. doi: 10.1016/j.alcohol.2006.05.002. [DOI] [PubMed] [Google Scholar]
- 18.Follesa P, Ticku MK. Chronic ethanol-mediated upregulation of the N-methyl-D-aspartate receptor polypeptide subunits in mouse cortical neurons in culture. J Biol Chem. 1996;271:13297–13299. doi: 10.1074/jbc.271.23.13297. [DOI] [PubMed] [Google Scholar]
- 19.Hu XJ, Follesa P, Ticku MK. Chronic ethanol treatment produces a selective upregulation of the NMDA receptor subunit gene expression in mammalian cultured cortical neurons. Brain Res Mol Brain Res. 1996;36:211–218. doi: 10.1016/0169-328x(95)00223-f. [DOI] [PubMed] [Google Scholar]
- 20.Hu XJ, Ticku MK. Chronic ethanol treatment upregulates the NMDA receptor function and binding in mammalian cortical neurons. Brain Res Mol Brain Res. 1995;30:347–356. doi: 10.1016/0169-328x(95)00019-o. [DOI] [PubMed] [Google Scholar]
- 21.Hu XJ, Ticku MK. Functional characterization of a kindling-like model of ethanol withdrawal in cortical cultured neurons after chronic intermittent ethanol exposure. Brain Res. 1997;767:228–234. doi: 10.1016/s0006-8993(97)00581-7. [DOI] [PubMed] [Google Scholar]
- 22.Qiang M, Denny AD, Ticku MK. Chronic Intermittent Ethanol Treatment Selectively Alters NMDA Receptor Subunits Surface Expression in Cultured Cortical Neurons. Mol Pharmacol. 2007 doi: 10.1124/mol.106.033043. [DOI] [PubMed] [Google Scholar]
- 23.Berger SL. The complex language of chromatin regulation during transcription. Nature. 2007;447:407–412. doi: 10.1038/nature05915. [DOI] [PubMed] [Google Scholar]
- 24.Roth TL, Sweatt JD. Regulation of chromatin structure in memory formation. Curr Opin Neurobiol. 2009;19:336–342. doi: 10.1016/j.conb.2009.05.011. [DOI] [PMC free article] [PubMed] [Google Scholar]
- 25.Pandey SC, Ugale R, Zhang H, Tang L, Prakash A. Brain chromatin remodeling: a novel mechanism of alcoholism. J Neurosci. 2008;28:3729–3737. doi: 10.1523/JNEUROSCI.5731-07.2008. [DOI] [PMC free article] [PubMed] [Google Scholar]
- 26.Weaver IC, Meaney MJ, Szyf M. Maternal care effects on the hippocampal transcriptome and anxiety-mediated behaviors in the offspring that are reversible in adulthood. Proc Natl Acad Sci USA. 2006;103:3480–3485. doi: 10.1073/pnas.0507526103. [DOI] [PMC free article] [PubMed] [Google Scholar]
- 27.Peterson CL, Laniel MA. Histones and histone modifications. Curr Biol. 2004;14:546–551. doi: 10.1016/j.cub.2004.07.007. [DOI] [PubMed] [Google Scholar]
- 28.Kondo Y, Shen L, Issa JP. Critical role of histone methylation in tumor suppressor gene silencing in colorectal cancer. Mol Cell Biol. 2003;23:206–215. doi: 10.1128/MCB.23.1.206-215.2003. [DOI] [PMC free article] [PubMed] [Google Scholar]
- 29.Cedar H, Bergman Y. Linking DNA methylation and histone modification: patterns and paradigms. Nat Rev Genet. 2009;10:295–304. doi: 10.1038/nrg2540. [DOI] [PubMed] [Google Scholar]
- 30.Rice JC, Allis CD. Histone methylation versus histone acetylation: new insights into epigenetic regulation. Curr Opin Cell Biol. 2001;13:263–273. doi: 10.1016/s0955-0674(00)00208-8. [DOI] [PubMed] [Google Scholar]
- 31.Vaute O, Nicolas E, Vandel L, Trouche D. Functional and physical interaction between the histone methyl transferase Suv39H1 and histone deacetylases. Nucleic Acids Res. 2002;30:475–481. doi: 10.1093/nar/30.2.475. [DOI] [PMC free article] [PubMed] [Google Scholar]
- 32.Nowak SJ, Corces VG. Phosphorylation of histone H3: a balancing act between chromosome condensation and transcriptional activation. Trends Genet. 2004;20:214–220. doi: 10.1016/j.tig.2004.02.007. [DOI] [PubMed] [Google Scholar]
- 33.Rea S, Eisenhaber F, O'Carroll D, Strahl BD, Sun ZW, Schmid M, et al. Regulation of chromatin structure by site-specific histone H3 methyltransferases. Nature. 2000;406:593–599. doi: 10.1038/35020506. [DOI] [PubMed] [Google Scholar]
- 34.Lo WS, Trievel RC, Rojas JR, Duggan L, Hsu JY, Allis CD, et al. Phosphorylation of serine 10 in histone H3 is functionally linked in vitro and in vivo to Gcn5-mediated acetylation at lysine 14. Mol Cell. 2000;5:917–926. doi: 10.1016/s1097-2765(00)80257-9. [DOI] [PubMed] [Google Scholar]
- 35.Qiang M, Denny A, Chen J, Ticku MK, Yan B, Henderson G. The site specific demethylation in the 5′-regulatory area of NMDA receptor 2B subunit gene associated with CIE-induced upregulation of transcription. PLoS One. 2010;5:8798. doi: 10.1371/journal.pone.0008798. [DOI] [PMC free article] [PubMed] [Google Scholar]
- 36.Hansen JC, Tse C, Wolffe AP. Structure and function of the core histone N-termini: more than meets the eye. Biochemistry. 1998;37:17637–17641. doi: 10.1021/bi982409v. [DOI] [PubMed] [Google Scholar]
- 37.Allfrey VG, Faulkner R, Mirsky AE. Acetylation and Methylation of Histones and Their Possible Role in the Regulation of Rna Synthesis. Proc Natl Acad Sci USA. 1964;51:786–794. doi: 10.1073/pnas.51.5.786. [DOI] [PMC free article] [PubMed] [Google Scholar]
- 38.Kemp MG, Ghosh M, Liu G, Leffak M. The histone deacetylase inhibitor trichostatin A alters the pattern of DNA replication origin activity in human cells. Nucleic Acids Res. 2005;33:325–336. doi: 10.1093/nar/gki177. [DOI] [PMC free article] [PubMed] [Google Scholar]
- 39.Liu JC, Baker RE, Chow W, Sun CK, Elsholtz HP. Epigenetic mechanisms in the dopamine D2 receptor-dependent inhibition of the prolactin gene. Mol Endocrinol. 2005;19:1904–1917. doi: 10.1210/me.2004-0111. [DOI] [PubMed] [Google Scholar]
- 40.Wenzel A, Fritschy JM, Mohler H, Benke D. NMDA receptor heterogeneity during postnatal development of the rat brain: differential expression of the NR2A, NR2B and NR2C subunit proteins. J Neurochem. 1997;68:469–478. doi: 10.1046/j.1471-4159.1997.68020469.x. [DOI] [PubMed] [Google Scholar]
- 41.Sheng M, Cummings J, Roldan LA, Jan YN, Jan LY. Changing subunit composition of heteromeric NMDA receptors during development of rat cortex. Nature. 1994;368:144–147. doi: 10.1038/368144a0. [DOI] [PubMed] [Google Scholar]
- 42.Mizuta I, Katayama M, Watanabe M, Mishina M, Ishii K. Developmental expression of NMDA receptor subunits and the emergence of glutamate neurotoxicity in primary cultures of murine cerebral cortical neurons. Cell Mol Life Sci. 1998;54:721–725. doi: 10.1007/s000180050199. [DOI] [PMC free article] [PubMed] [Google Scholar]
- 43.Park PH, Lim RW, Shukla SD. Involvement of histone acetyltransferase (HAT) in ethanol-induced acetylation of histone H3 in hepatocytes: potential mechanism for gene expression. Am J Physiol Gastrointest Liver Physiol. 2005;289:1124–1136. doi: 10.1152/ajpgi.00091.2005. [DOI] [PubMed] [Google Scholar]
- 44.Kouzarides T. Chromatin modifications and their function. Cell. 2007;128:693–705. doi: 10.1016/j.cell.2007.02.005. [DOI] [PubMed] [Google Scholar]
- 45.Sterner DE, Berger SL. Acetylation of histones and transcription-related factors. Microbiol Mol Biol Rev. 2000;64:435–459. doi: 10.1128/mmbr.64.2.435-459.2000. [DOI] [PMC free article] [PubMed] [Google Scholar]
- 46.Klose RJ, Zhang Y. Regulation of histone methylation by demethylimination and demethylation. Nat Rev Mol Cell Biol. 2007;8:307–318. doi: 10.1038/nrm2143. [DOI] [PubMed] [Google Scholar]
- 47.Sharma RP, Grayson DR, Gavin DP. Histone deactylase 1 expression is increased in the prefrontal cortex of schizophrenia subjects: analysis of the National Brain Databank microarray collection. Schizophr Res. 2008;98:111–117. doi: 10.1016/j.schres.2007.09.020. [DOI] [PMC free article] [PubMed] [Google Scholar]
- 48.Maze I, Covington HE, 3rd, Dietz DM, LaPlant Q, Renthal W, Russo SJ, et al. Essential role of the histone methyltransferase G9a in cocaine-induced plasticity. Science. 327:213–216. doi: 10.1126/science.1179438. [DOI] [PMC free article] [PubMed] [Google Scholar]
- 49.Renthal W, Maze I, Krishnan V, Covington HE, 3rd, Xiao G, Kumar A, et al. Histone deacetylase 5 epigenetically controls behavioral adaptations to chronic emotional stimuli. Neuron. 2007;56:517–529. doi: 10.1016/j.neuron.2007.09.032. [DOI] [PubMed] [Google Scholar]
- 50.Borrelli E, Nestler EJ, Allis CD, Sassone-Corsi P. Decoding the epigenetic language of neuronal plasticity. Neuron. 2008;60:961–974. doi: 10.1016/j.neuron.2008.10.012. [DOI] [PMC free article] [PubMed] [Google Scholar]
- 51.Paik WK, Kim S. Protein methylation. Science. 1971;174:114–119. doi: 10.1126/science.174.4005.114. [DOI] [PubMed] [Google Scholar]
- 52.Zhang Y, Reinberg D. Transcription regulation by histone methylation: interplay between different covalent modifications of the core histone tails. Genes Dev. 2001;15:2343–2360. doi: 10.1101/gad.927301. [DOI] [PubMed] [Google Scholar]
- 53.Cao R, Wang L, Wang H, Xia L, Erdjument-Bromage H, Tempst P, et al. Role of histone H3 lysine 27 methylation in Polycomb-group silencing. Science. 2002;298:1039–1043. doi: 10.1126/science.1076997. [DOI] [PubMed] [Google Scholar]
- 54.Fritsch L, Robin P, Mathieu JR, Souidi M, Hinaux H, Rougeulle C, et al. A subset of the histone H3 lysine 9 methyltransferases Suv39 h1, G9a, GLP and SETDB1 participate in a multimeric complex. Mol Cell. 37:46–56. doi: 10.1016/j.molcel.2009.12.017. [DOI] [PubMed] [Google Scholar]
- 55.Volkow ND, Li TK. Drug addiction: the neurobiology of behaviour gone awry. Nat Rev Neurosci. 2004;5:963–970. doi: 10.1038/nrn1539. [DOI] [PubMed] [Google Scholar]
- 56.Kumar A, Choi KH, Renthal W, Tsankova NM, Theobald DE, Truong HT, et al. Chromatin remodeling is a key mechanism underlying cocaine-induced plasticity in striatum. Neuron. 2005;48:303–314. doi: 10.1016/j.neuron.2005.09.023. [DOI] [PubMed] [Google Scholar]
- 57.Freeman WM, Patel KM, Brucklacher RM, Lull ME, Erwin M, Morgan D, et al. Persistent alterations in mesolimbic gene expression with abstinence from cocaine self-administration. Neuropsychopharmacology. 2008;33:1807–1817. doi: 10.1038/sj.npp.1301577. [DOI] [PMC free article] [PubMed] [Google Scholar]
- 58.Shepard BD, Tuma PL. Alcohol-induced protein hyperacetylation: mechanisms and consequences. World J Gastroenterol. 2009;15:1219–1230. doi: 10.3748/wjg.15.1219. [DOI] [PMC free article] [PubMed] [Google Scholar]
- 59.Nakayama J, Rice JC, Strahl BD, Allis CD, Grewal SI. Role of histone H3 lysine 9 methylation in epigenetic control of heterochromatin assembly. Science. 2001;292:110–113. doi: 10.1126/science.1060118. [DOI] [PubMed] [Google Scholar]
- 60.Yamada N, Nishida Y, Tsutsumida H, Hamada T, Goto M, Higashi M, et al. MUC1 expression is regulated by DNA methylation and histone H3 lysine 9 modification in cancer cells. Cancer Res. 2008;68:2708–2716. doi: 10.1158/0008-5472.CAN-07-6844. [DOI] [PubMed] [Google Scholar]
- 61.Meng CF, Zhu XJ, Peng G, Dai DQ. Re-expression of methylation-induced tumor suppressor gene silencing is associated with the state of histone modification in gastric cancer cell lines. World J Gastroenterol. 2007;13:6166–6171. doi: 10.3748/wjg.v13.i46.6166. [DOI] [PMC free article] [PubMed] [Google Scholar]
- 62.Schaefer A, Sampath SC, Intrator A, Min A, Gertler TS, Surmeier DJ, et al. Control of cognition and adaptive behavior by the GLP/G9a epigenetic suppressor complex. Neuron. 2009;64:678–691. doi: 10.1016/j.neuron.2009.11.019. [DOI] [PMC free article] [PubMed] [Google Scholar]
- 63.Martin C, Zhang Y. The diverse functions of histone lysine methylation. Nat Rev Mol Cell Biol. 2005;6:838–849. doi: 10.1038/nrm1761. [DOI] [PubMed] [Google Scholar]
- 64.Rice JC, Briggs SD, Ueberheide B, Barber CM, Shabanowitz J, Hunt DF, et al. Histone methyltransferases direct different degrees of methylation to define distinct chromatin domains. Mol Cell. 2003;12:1591–1598. doi: 10.1016/s1097-2765(03)00479-9. [DOI] [PubMed] [Google Scholar]
- 65.Lubin FD, Roth TL, Sweatt JD. Epigenetic regulation of BDNF gene transcription in the consolidation of fear memory. J Neurosci. 2008;28:10576–10586. doi: 10.1523/JNEUROSCI.1786-08.2008. [DOI] [PMC free article] [PubMed] [Google Scholar]
- 66.Ooi L, Wood IC. Regulation of gene expression in the nervous system. Biochem J. 2008;414:327–341. doi: 10.1042/BJ20080963. [DOI] [PubMed] [Google Scholar]
- 67.Lehnertz B, Ueda Y, Derijck AA, Braunschweig U, Perez-Burgos L, Kubicek S, et al. Suv39 h-mediated histone H3 lysine 9 methylation directs DNA methylation to major satellite repeats at pericentric heterochromatin. Curr Biol. 2003;13:1192–1200. doi: 10.1016/s0960-9822(03)00432-9. [DOI] [PubMed] [Google Scholar]
- 68.Tamaru H, Selker EU. A histone H3 methyltransferase controls DNA methylation in Neurospora crassa. Nature. 2001;414:277–283. doi: 10.1038/35104508. [DOI] [PubMed] [Google Scholar]
- 69.Jackson JP, Lindroth AM, Cao X, Jacobsen SE. Control of CpNpG DNA methylation by the KRYPTONITE histone H3 methyltransferase. Nature. 2002;416:556–560. doi: 10.1038/nature731. [DOI] [PubMed] [Google Scholar]
- 70.Fahrner JA, Eguchi S, Herman JG, Baylin SB. Dependence of histone modifications and gene expression on DNA hypermethylation in cancer. Cancer Res. 2002;62:7213–7218. [PubMed] [Google Scholar]
- 71.Davison JM, Mellott TJ, Kovacheva VP, Blusztajn JK. Gestational choline supply regulates methylation of histone H3, expression of histone methyltransferases G9a (Kmt1c) and Suv39 h1 (Kmt1a) and DNA methylation of their genes in rat fetal liver and brain. J Biol Chem. 2009;284:1982–1989. doi: 10.1074/jbc.M807651200. [DOI] [PMC free article] [PubMed] [Google Scholar]
- 72.Qiang M, Rani CS, Ticku MK. Neuron-restrictive silencer factor regulates the N-methyl-D-aspartate receptor 2B subunit gene in basal and ethanol-induced gene expression in fetal cortical neurons. Mol Pharmacol. 2005;67:2115–2125. doi: 10.1124/mol.104.010751. [DOI] [PubMed] [Google Scholar]
- 73.Qiang M, Ticku MK. Role of AP-1 in ethanol-induced N-methyl-D-aspartate receptor 2B subunit gene upregulation in mouse cortical neurons. J Neurochem. 2005;95:1332–1341. doi: 10.1111/j.1471-4159.2005.03464.x. [DOI] [PubMed] [Google Scholar]
Associated Data
This section collects any data citations, data availability statements, or supplementary materials included in this article.
Supplementary Materials
Supplementary Material