Table Charts (original) (raw)
Last Updated : 23 Dec, 2025
A table chart is a widely used and highly effective method of organizing numerical data, especially when accuracy and detailed comparison are required. It presents information in a structured format using rows and columns, allowing values to be read, compared, and analyzed systematically. This arrangement makes it easier to perform calculations such as totals, averages, percentages, and ratios, helping candidates interpret data efficiently without unnecessary visual complexity.
**Example: A table showing the annual sales of different products across multiple years can be used to compare growth, calculate percentages, and identify trends efficiently.
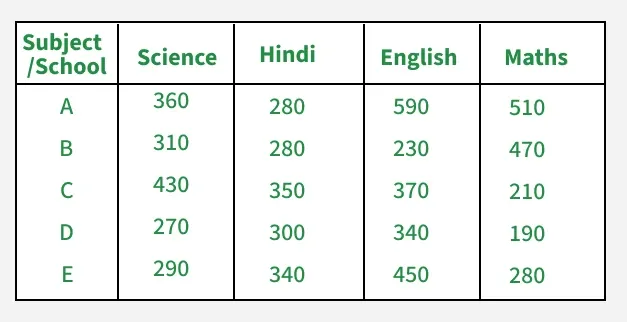
The data below shows A, B, C, D, and E school and their marks in subjects.
Solved Questions on Table Charts
**Example 1: The table below shows the number of students enrolled in different branches of an institute.
| Branch | Students |
|---|---|
| CSE | 120 |
| ECE | 100 |
| ME | 80 |
| CE | 60 |
**Question 1: What is the total number of students in the institute?
Solution:
Total = 120 + 100 + 80 + 60 = 360
**Question 2: If 20% of CSE students, 25% of ECE students, 50% of ME students, and 40% of CE students participate in a technical fest, what is the total number of participants? Also, what fraction of total students participates?
**Solution:
Participants from each branch:
- CSE: 120×0.20 = 24
- ECE: 100×0.25 = 25
- ME: 80×0.50 = 40
- CE: 60×0.40 = 24
**Question 3: What is the ratio of students in CSE and ECE together to the students in ME and CE together?
**Solution:
Students in CSE + ECE = 120 + 100 = 220
Students in ME + CE = 80 + 60 = 140Required Ratio=220 : 140 = 11 : 7
**Question 4: The total number of students in the institute during the given period is?
**Solution :
120 (CSE) + 100 (ECE) + 80 (ME) + 60 (CE) = 360
**Example 2: Number of Candidates Appeared and Qualified in a Competitive Examination from Different States Over the Years.
| Student | Maths (150) | Chemistry (130) | Physics (120) | Geography (100) | History (60) | Computer Science (40) |
|---|---|---|---|---|---|---|
| Arjun | 110 | 72 | 95 | 68 | 45 | 32 |
| Neha | 98 | 88 | 82 | 74 | 52 | 35 |
| Karan | 105 | 64 | 90 | 81 | 48 | 30 |
| Riya | 92 | 70 | 78 | 88 | 55 | 36 |
| Pooja | 85 | 60 | 84 | 92 | 40 | 34 |
| Aman | 100 | 76 | 88 | 79 | 50 | 38 |
| Simran | 90 | 68 | 80 | 85 | 46 | 33 |
**Question 1: What are the average marks obtained by all the seven students in Chemistry ?
**Solution:
Chemistry marks of the seven students:
72, 88, 64, 70, 60, 76, 68Total marks in Chemistry
72 + 88 + 64 + 70 + 60 + 76 + 68 = 498
Average marks
498/7 ≈ 71.14
**Question 2: The number of students who obtained 50% and above marks in all subjects is?
**Solution:
From the table, it is clear that Arjun, Neha, Riya, Aman, and Simran have obtained 50% or more marks in each of the six subjects.
**Question 3: What is the overall percentage of marks obtained by Arjun?
**Solution:
Total maximum marks
150 + 130 + 120 + 100 + 60 + 40 = 600
Total marks obtained by Arjun
110 + 72 + 95 + 68 + 45 + 32 = 442
Overall percentage
422/600 ×100 = 70.33%
Related Articles:
Unsolved Questions on Table Charts
**Question 1: Marks Obtained by Students
| Student | English (100) | Maths (150) | Science (120) | SST (100) | Computer (50) |
|---|---|---|---|---|---|
| Rahul | 78 | 112 | 90 | 70 | 42 |
| Priya | 85 | 120 | 95 | 82 | 45 |
| Mohit | 72 | 105 | 88 | 75 | 40 |
| Anjali | 90 | 130 | 100 | 85 | 48 |
| Rohan | 68 | 98 | 80 | 72 | 38 |
| Sneha | 88 | 125 | 92 | 80 | 46 |
**Answer the following:
- What are the average marks obtained by all six students in Science?
- How many students have scored 60% or more marks in Maths?
- What is the overall percentage of marks obtained by Anjali?
**Question 2: Marks in Semester Exam
| Student | English (100) | Maths (100) | Science (100) | Social (100) | Computer (100) |
|---|---|---|---|---|---|
| Aakash | 76 | 82 | 88 | 70 | 90 |
| Bhavya | 85 | 78 | 92 | 80 | 88 |
| Chirag | 68 | 74 | 80 | 65 | 75 |
| Divya | 90 | 88 | 95 | 85 | 92 |
| Eshan | 72 | 80 | 85 | 78 | 84 |
Answer the following:
- What are the average marks in Science obtained by all students?
- How many students scored 75 or more marks in English?
- What is the overall percentage of marks obtained by Divya?