Dataset Inspection and Visualization (original) (raw)
Last Updated : 6 May, 2026
Dataset inspection and visualisation are the first steps in data science. They help you understand your data, spot patterns and identify issues before building models. Tools like Hugging Face Dataset Viewer make this process faster and more interactive.
Hugging Face Dataset Viewer
Hugging Face Dataset Viewer is a built-in tool that allows you to explore datasets directly from the browser without writing code. It simplifies data inspection into a clean and interactive experience.
- Displays data in a table format
- Shows 100 rows at a time for easy navigation
- Supports search and filtering to quickly explore data
- Provides quick statistics for better understanding
- Works across text, image, audio and tabular datasets
**Step 1: Open the Hugging Face Dataset Hub
- Go to Hugging Face Dataset Hub
- This is the central repository of all available datasets
**Step 2: Search for a Dataset
- Use the search bar (e.g., type imdb, mnist, squad)
- Click on any dataset that fits your use case
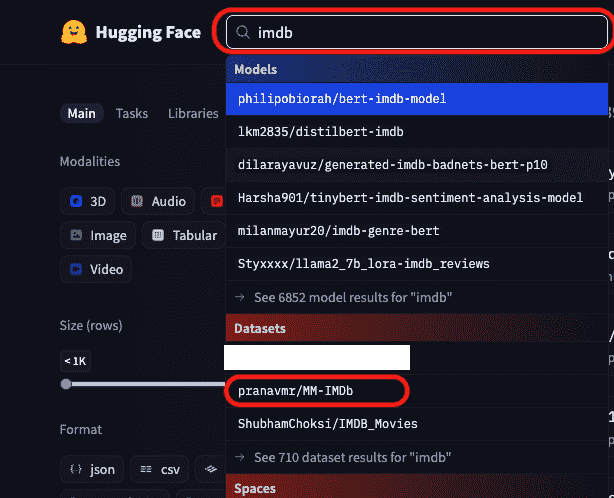
searching for a dataset
**Step 3: Access the Dataset Viewer
- Once inside the dataset page, locate the Dataset Viewer tab
- This is where the interactive table is available
**Step 4: Explore Data in Table Format
- You’ll see rows and columns like a spreadsheet
- Each row is one data sample
- Each column is a feature (text, label, image, etc.)
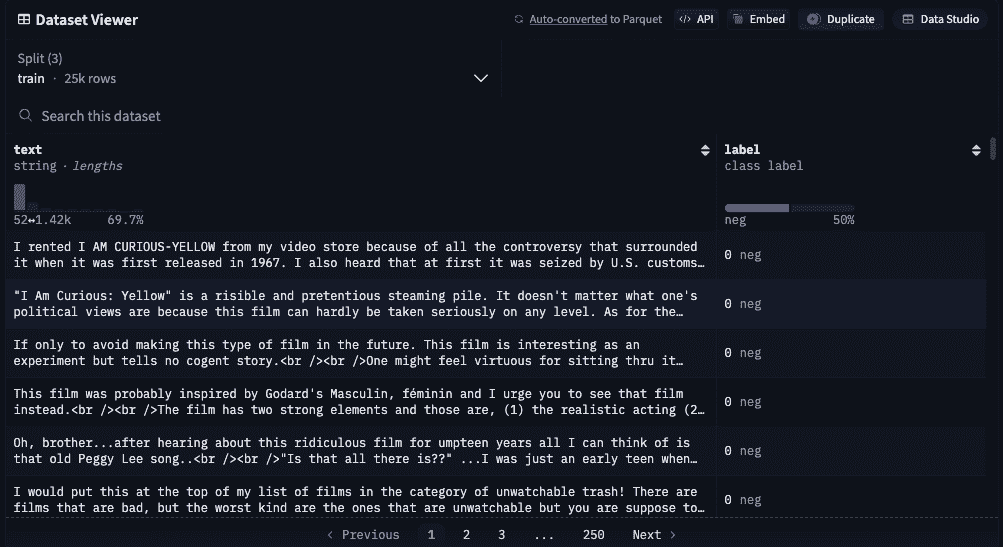
Dataset
**Step 5: Navigate Through Data
- Scroll down to the bottom of the table
- Use next/previous buttons to move across pages
- Each page typically shows 100 rows
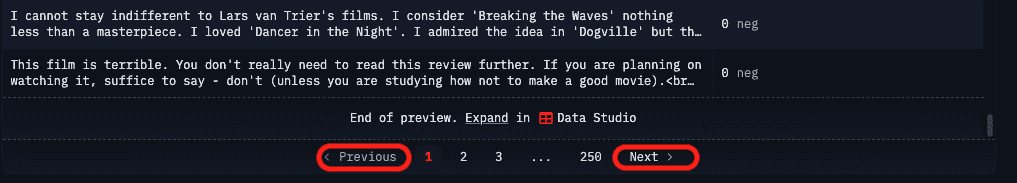
Pagination
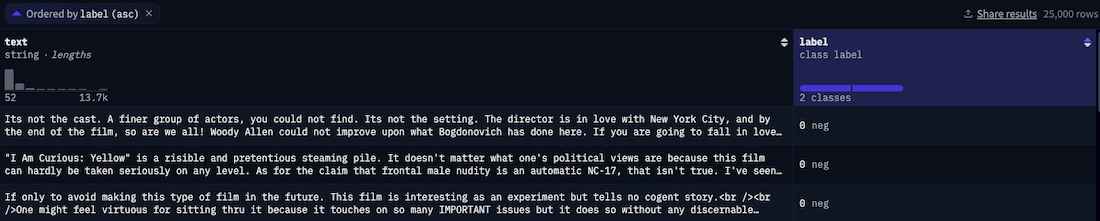
**Step 6: Use Search Functionality
- Use the search bar in the viewer
- Enter keywords (e.g., “good”, “error”)
- Instantly find matching rows in the dataset
**Step 7: Inspect Different Data Types
- **Text: shown directly
- **Images: displayed visually
- **Audio: playable in the viewer
- **Tabular: structured in columns
Text data shown directly
**Step 9: Check Dataset Splits
- Switch between splits like train, test and validation
- Helps understand how data is divided
Visualization in Hugging Face Dataset
The default Dataset Viewer focuses on structured inspection, but true visualization (patterns, clusters, trends) is achieved by integrating tools like Spotlight on top of Hugging Face datasets.
- Viewer is for quick inspection (tables, filters, search)
- Visualization tools are for deeper insights (patterns, clusters, errors)
- Works seamlessly with Hugging Face datasets
- No need to duplicate or preprocess data
- Enables interactive, visual data understanding
**Step 1: Install Required Libraries
Run the following command in your terminal
pip install datasets renumics-spotlight transformers torch
**Step 2: Import Required Libraries
Importing necessary libraries for loading datasets, processing images and launching visualization.
Python `
from datasets import load_dataset from transformers import ViTForImageClassification, ViTImageProcessor import torch from transformers import ViTModel from renumics import spotlight
`
**Step 3: Load a Dataset from Hugging Face
Loading a sample dataset for visualization.
Python `
ds = load_dataset("cifar100", split="test[:500]")
`
**Step 4: Add Model Predictions
Generating predictions for each data sample using a pre-trained model.
Python `
model_name = "Ahmed9275/Vit-Cifar100"
processor = ViTImageProcessor.from_pretrained(model_name) model = ViTForImageClassification.from_pretrained(model_name)
def add_predictions(example): image = example["img"].convert("RGB") inputs = processor(images=image, return_tensors="pt")
with torch.no_grad():
    outputs = model(**inputs)

pred = outputs.logits.argmax(dim=-1).item()
example["prediction"] = pred
return example
ds = ds.map(add_predictions)
`
**Step 5: Add Embeddings
Extracting feature vectors (embeddings) from the model.
Python `
feature_model = ViTModel.from_pretrained(model_name)
def add_embedding(example): image = example["img"].convert("RGB") inputs = processor(images=image, return_tensors="pt")
with torch.no_grad():
    outputs = feature_model(**inputs)

embedding = outputs.last_hidden_state[:, 0].squeeze().numpy()
example["embedding"] = embedding
return example
ds = ds.map(add_embedding)
`
**Step 6: Launch Spotlight
Visualizing the dataset with embeddings.
Python `
spotlight.show( ds, dtype={"embedding": spotlight.Embedding} )
`
**Output:
If your dataset contains numerical or structured data, you can perform simple but powerful visualizations to understand patterns, relationships, and overall data behavior.
- **Distribution of values: see how data is spread (e.g., histograms, boxplots)
- **Relationships between features: understand how two variables are connected (e.g., scatter plots)
- **Correlation between columns: identify strong or weak relationships (e.g., heatmaps)
- **Trends over data: observe changes if data has an order (e.g., line charts)
- **Outliers detection: find unusual or extreme values (e.g., boxplots)
Advantages
- You can quickly find missing values, incorrect entries or inconsistent data
- It helps you clearly understand what your dataset contains and how it is structured
- Clean and well understood data improves model accuracy and performance
- Visual insights make it easier to interpret information compared to raw tables
- It saves time by reducing issues that usually appear later during model training
Limitations
- Large datasets can be slow to load and difficult to visualize fully
- Basic viewers (like Hugging Face Dataset Viewer) provide limited visualization features
- Some insights may require advanced tools or additional processing
- Visualizations can sometimes be misleading if not interpreted correctly
- Not all datasets support filtering, statistics, or advanced interactions in the UI