How to Use SPSS for Data Analysis (original) (raw)
Last Updated : 23 Jul, 2025
Data Analysis involves the use of statistics and other techniques to interpret the data. It involves cleaning, analyzing, finding statistics and finally visualizing them in graphs or charts. Data Analytics tools are mainly used to deal with structured data. The steps involved in Data Analysis are as follows:
- Importing Data
- Data Cleaning
- Exploratory Analysis
- Normalization of Data
- Statistical Analysis
Table of Content
- Overview of SPSS for Data Analysis
- Step-by-Step Data Analysis Techniques in SPSS
- Practical Example with SPSS - Data Analysis Tasks
Overview of SPSS for Data Analysis
The full form of SPSS is Statistical Package for the Social Sciences. It is a popular data analysis tool that is mainly used for statistical analysis and data management of structured datasets. It was developed by IBM in the year 1968. It is to be noted that SPSS has two versions: paid and trial version for 30 days. Some key features of SPSS are as follows:
- SPSS provides much more advanced statistical analysis features.
- This tool has user friendly user interface as it provides menu driven options which are easily accessible.
- SPSS provides techniques to clean and manage data.
- SPSS is supported on Windows as well as Mac OS.
Step-by-Step Data Analysis Techniques in SPSS
To perform the data analysis we have used Housing dataset. It has 14 columns. Now we will import the data and implement the data analysis techniques.
1. Importing Data in SPSS
After installing the trial version of SPSS from official website of IBM, open the software and follow the steps.
**1. Click on New Dataset:
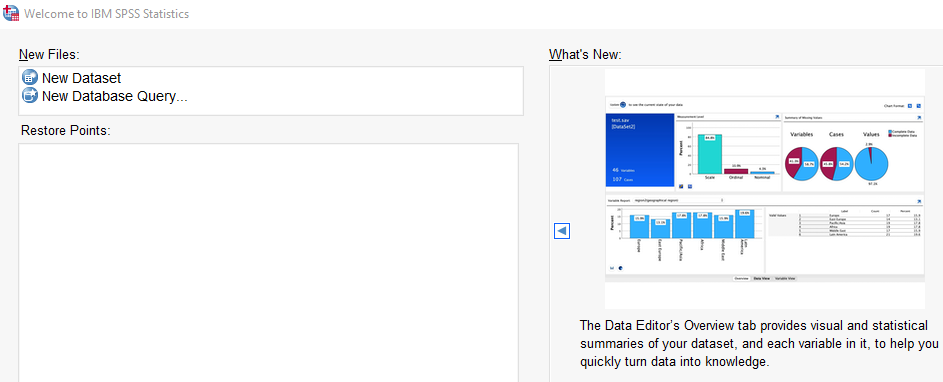
Importing Data in SPSS
**2. A new window opens. Now click on File.
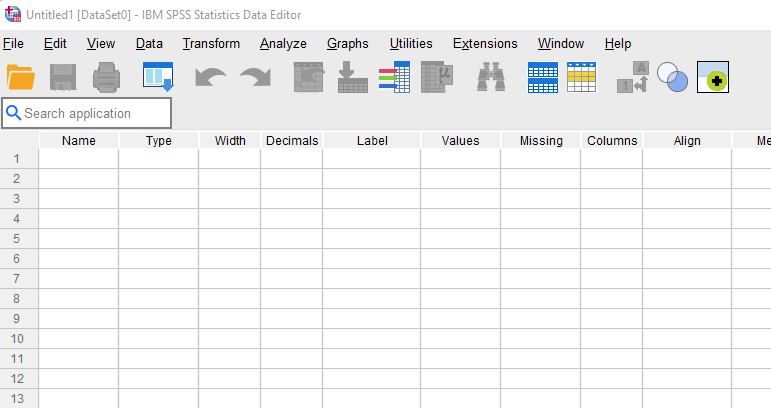
Importing Data in SPSS
And to proceed,
- **Click on Import Data and specify the file type.
- **Here our data has been stored in CSV format.
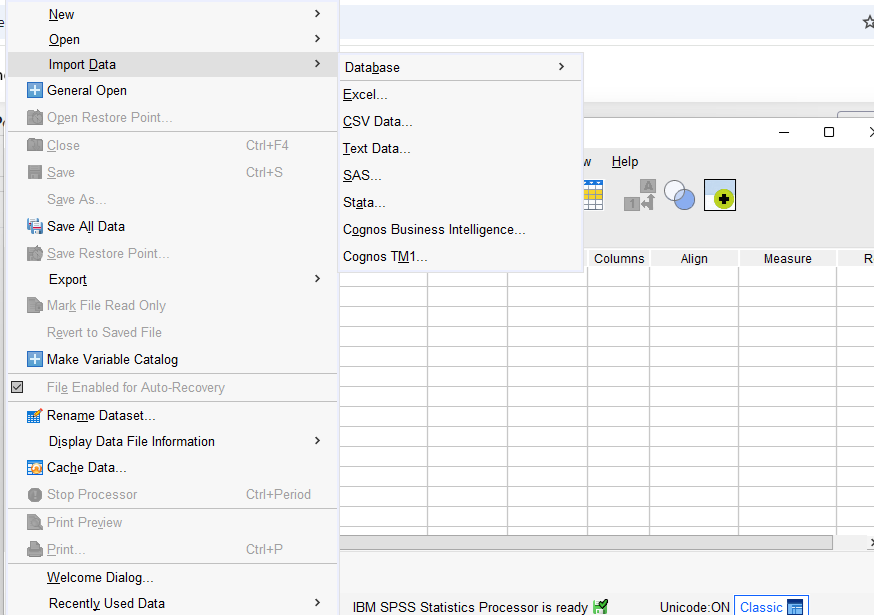
Importing Data in SPSS
Now,
- Browse the path where the file has been saved.
- **Click on Open.
- **The dialog box will pop up showing the preview of the data.
- **Specify the delimiters and other parameters.
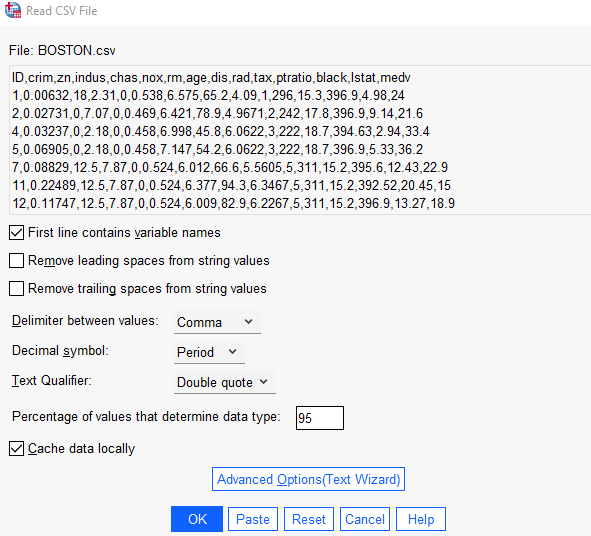
Importing Data in SPSS
2. Getting Datatypes of the Data
To get the column type of the data, we need to use the Variable View. The variable View option is present at the bottom where our dataset is opened.
- If any data is not in correct format then click on the datatype of that particular column.
- Triple dots will appear.
- Upon clicking the list of datatypes will appear.
- Select the desired datatype.
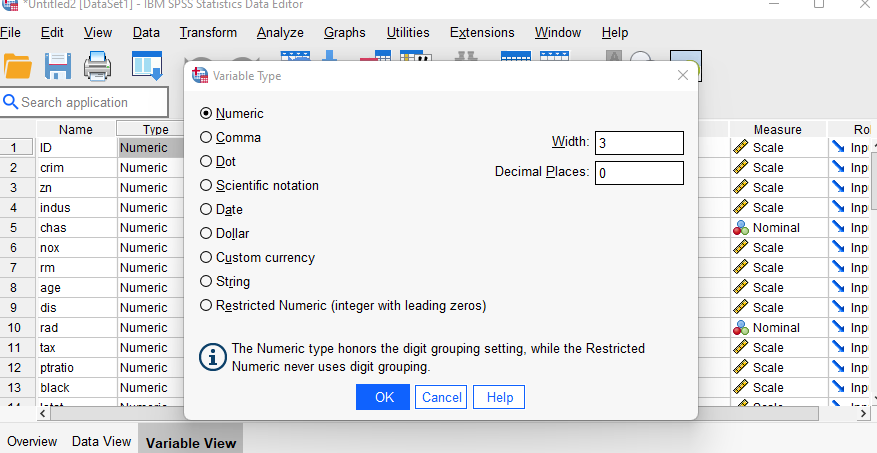
Getting Datatypes of the Data
3. Descriptive Statistics and Handling Missing Values
We need to use descriptive statistics to find mean, standard deviation, minimum, maximum value and also to handle the missing values. As Descriptive Statistics provides counts of values, it is important to handle the missing values.
**1. Click on Analyze and the click on Descriptive Statistics
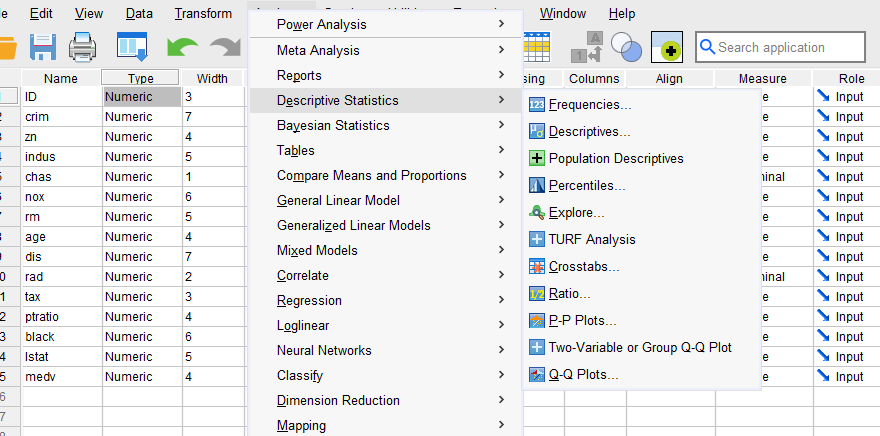
Descriptive Statistics and Handling Missing Values
**2. A dialog box will appear.
- Select the columns whose descriptive statistics are to be calculated.
- Click on OK.
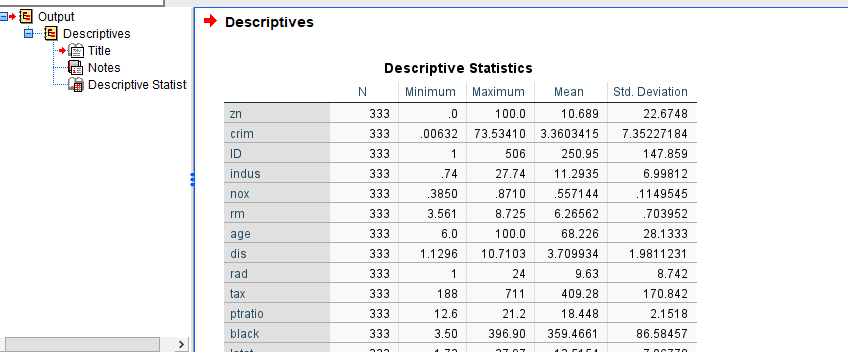
Descriptive Statistics and Handling Missing Values
Now to handle the missing values, click on Transform and then click on Replace Missing values. Select the columns in which values are missing and choose with what the values are to be replaced. Click on OK. A new column will be created by default.
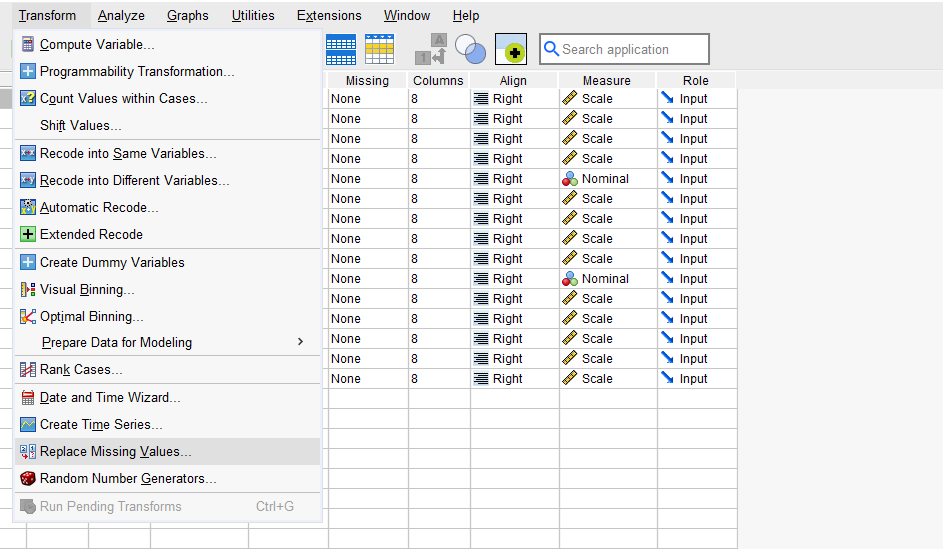
Descriptive Statistics and Handling Missing Values
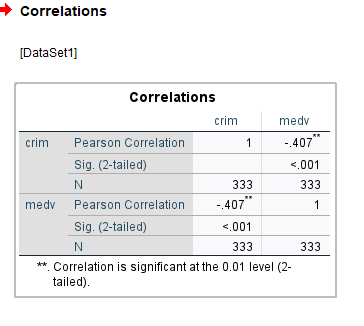
4. Correlation Analysis
To determine the strength of relationship between two variables we use correlation. In SPSS we can analyze the relationship between the variables.
**1. Click on Analyze, From the drop down menu click on Correlate.
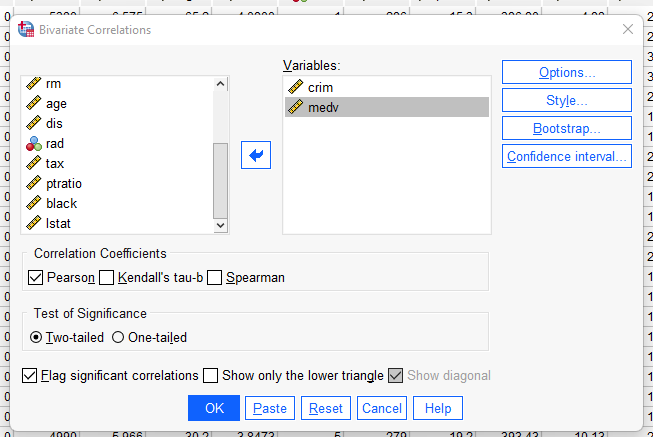
Correlation Analysis
**2. Then click on Bivariate and select the columns in which the correlation is to be found.
Correlation Analysis
5. Graphs
We can create interactive graphs on SPSS. Some common charts we can create are as follows:
- Bar Graph: between categorical and numerical value.
- Scatter plot: find relationship between two continuous variables.
- Histograms: To calculate the frequency.
- Box plots: To detect outliers if present in the data.
The steps to create a graph is as follows:
**1. Click on Graphs from the menu
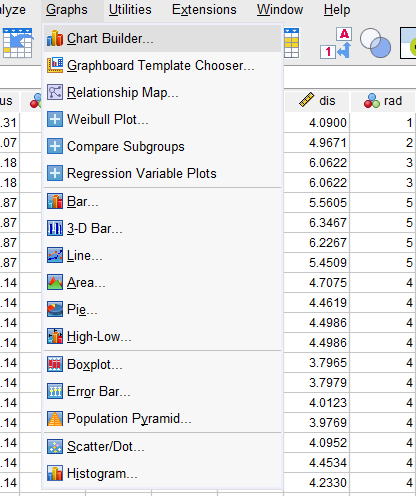
Graphs
**2. From the drop down list of charts are available
- **Select any one chart and provide the X and Y values.
- **Click on OK.
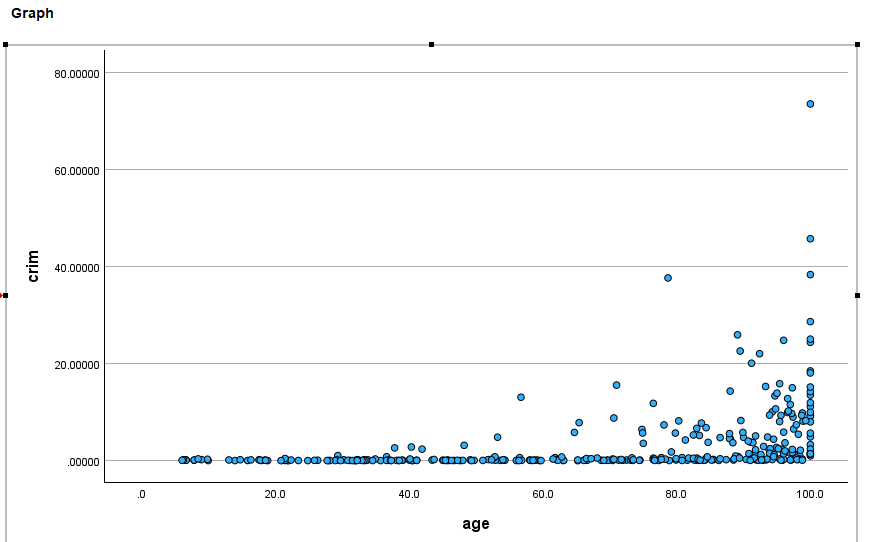
Correlation Analysis
6. Linear Regression model
Linear regression is a model that is used to establish relationship between dependent and independent variables. In SPSS we can create Linear Regression to predict how the dependent variables changes over time when independent variables change.
**1. Click on Analyze and then Click on Regression

Linear Regression model
- 2. From the drop down click on Linear
- 3. Select the dependent and independent variables respectively.
- 4. If the confidence score, R squared etc are to be displayed click on Statistics part and select the parameters. For plots click on Plot option.
- 5. Click on OK
Practical Example with SPSS - Data Analysis Tasks
Here we will be using Iris dataset. There are 5 columns in this dataset: Petal length, Petal width, Sepal length, Sepal width and Species.
**1. Load the Iris dataset
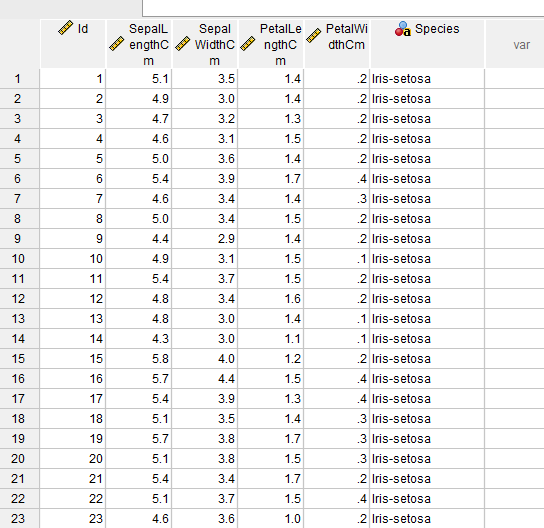
Practical Example with SPSS
**2. Find the descriptive statistics of the dataset like Mean, Median, Count, Maximum and Minimum value.
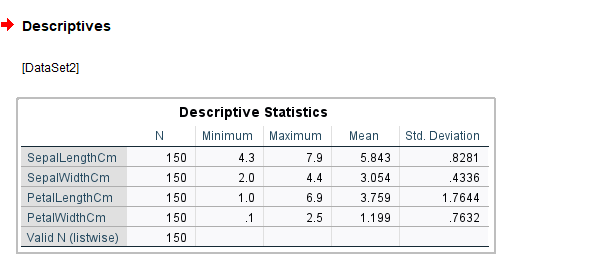
Practical Example with SPSS
Here we have counted the quantity, minimum, maximum, mean and standard deviation.
**3. Use bar charts, scatter plots to visualize the data in graphical format.
Using bar chart we have calculated the count of each species and using scatter plot we have tried to establish relationship between sepal length and sepal width.
**4. For finding the strength of relationships between the variables like Sepal length versus Petal width etc use Correlation analysis.
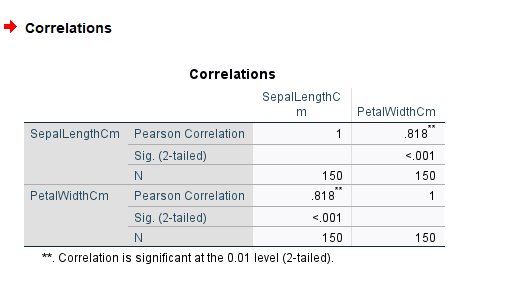
Practical Example with SPSS
From the below we can see that Pearson Correlation is 0.818 which states that there is strong relationship between Sepal Length and Petal Width
Conclusion
SPSS is a widely used data analytics tool as it is easy to use and quite user interactive. It has the capability to handle large amount of structured data and provides advanced statistical techniques.