Hypothesis Testing (original) (raw)
Last Updated : 18 Mar, 2026
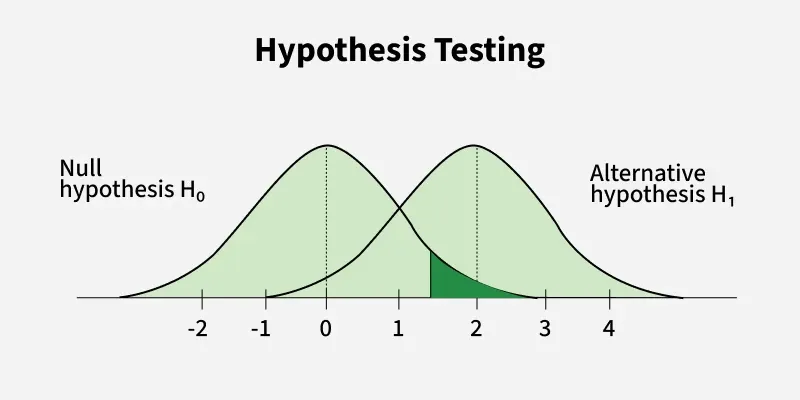
Hypothesis testing compares two opposite ideas about a group of people or things and uses data from a small part of that group (a sample) to decide which idea is more likely true. We collect and study the sample data to check if the claim is correct.
Hypothesis Testing
For example, if a company says its website gets 50 visitors each day on average, we use hypothesis testing to look at past visitor data and see if this claim is true or if the actual number is different.
**Defining Hypotheses
- **Null Hypothesis (H₀): The starting assumption. For example, "The average visits are 50."
- **Alternative Hypothesis (H₁): The opposite, saying there is a difference. For example, "The average visits are not 50."
Key Terms of Hypothesis Testing
To understand the Hypothesis testing firstly we need to understand the key terms which are given below:
- **Significance Level (α): How sure we want to be before saying the claim is false. Usually, we choose 0.05 (5%).
- **p-value****:** The chance of seeing the data if the null hypothesis is true. If this is less than α, we say the claim is probably false.
- **Test Statistic: A number that helps us decide if the data supports or rejects the claim.
- **Critical Value: The cutoff point to compare with the test statistic.
- **Degrees of freedom****:** A number that depends on the data size and helps find the critical value.
Types of Hypothesis Testing
It involves basically two types of testing:
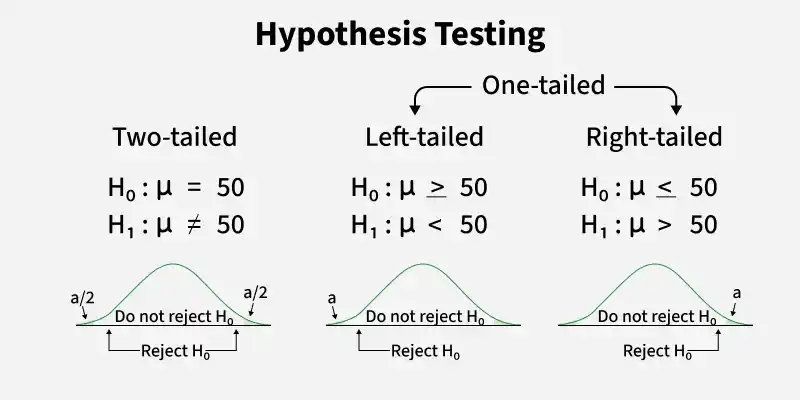
1. One-Tailed Test
Used when we expect a change in only one direction either up or down, but not both. For example, if testing whether a new algorithm improves accuracy, we only check if accuracy increases.
There are two types of one-tailed test:
- **Left-Tailed (Left-Sided) Test: Checks if the value is less than expected. Example: H0:\mu \geq 50 and H1: \mu < 50
- **Right-Tailed (Right-Sided) Test: Checks if the value is greater than expected. Example: H0 : \mu \leq50 and H1:\mu > 50
2. Two-Tailed Test
Used when we want to see if there is a difference in either direction higher or lower. For example, testing if a marketing strategy affects sales, whether it goes up or down
**Example: H0: \mu = 50 and H1: \mu \neq 50
To go deeper into differences into both types of test: Refer to link
What are Type 1 and Type 2 errors in Hypothesis Testing?
In hypothesis testing Type I and Type II errors are two possible errors that can happen when we are finding conclusions about a population based on a sample of data. These errors are associated with the decisions we made regarding the null hypothesis and the alternative hypothesis.
- **Type I error: When we reject the null hypothesis although that hypothesis was true. Type I error is denoted by alpha(\alpha).
- **Type II errors****:** When we fail to reject the null hypothesis even though it is false, Type II errors are denoted by beta(\beta).
| Null Hypothesis is True | Null Hypothesis is False | |
|---|---|---|
| Fail to Reject Null Hypothesis | Correct Decision | Type II Error (False Negative) |
| Alternative Hypothesis is True (Reject) | Type I Error (False Positive) | Correct Decision |
How does Hypothesis Testing work?
Working of Hypothesis testing involves various steps:
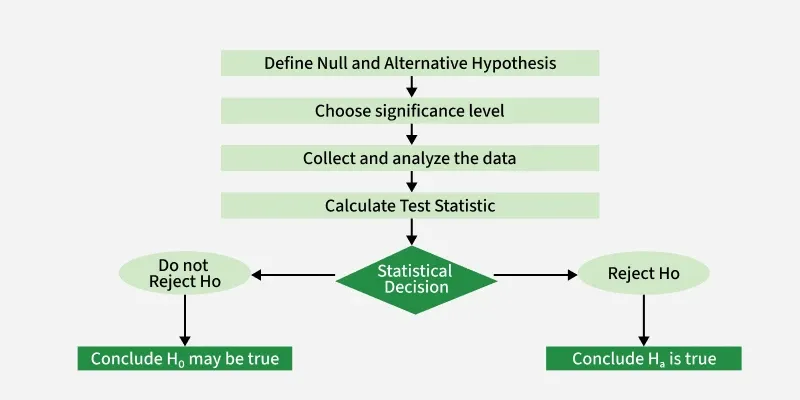
Steps of Hypothesis Testing
**Step 1: Define Hypotheses:
- **Null hypothesis (H₀): Assumes no effect or difference.
- **Alternative hypothesis (H₁): Assumes there is an effect or difference.
**Example: Test if a new algorithm improves user engagement.
**Note: In this we assume that our data is **normally distributed.
**Step 2: Choose significance level
We select a significance level (usually 0.05). This is the maximum chance we accept of wrongly rejecting the null hypothesis (Type I error). It also sets the confidence needed to accept results.
**Step 3: **Collect and Analyze data.
- Now we gather data this could come from user observations or an experiment. Once collected we analyze the data using appropriate statistical methods to calculate the test statistic.
- **Example: We collect data on user engagement before and after implementing the algorithm. We can also find the mean engagement scores for each group.
**Step 4: Calculate Test Statistic
The test statistic measures how much the sample data deviates from what we did expect if the null hypothesis were true. Different tests use different statistics:
- **Z-test****:** Used when population variance is known and sample size is large.
- **T-test****:** Used when sample size is small or population variance unknown.
- **Chi-square test****:** Used for categorical data to compare observed vs. expected counts.
**Step 5: Make a Decision
We compare the test statistic to a critical value from a statistical table or use the p-value:
**1. Using Critical Value:
- If test statistic > critical value → reject H0.
- If test statistic ≤ critical value → fail to reject H0.
**2. Using P-value:
- If p-value ≤ α → reject H0.
- If p-value > α → insufficient evidence to reject H0, not proof that H0 is true.
Example: If p-value is 0.03 and α is 0.05, we reject the null hypothesis because 0.03 < 0.05.
**Step 6: Interpret the Results
Based on the decision, we conclude whether there is enough evidence to support the alternative hypothesis or if we fail to reject the null hypothesis.
Real life Examples of Hypothesis Testing
A pharmaceutical company tests a new drug to see if it lowers blood pressure in patients.
**Data:
- Before Treatment: 120, 122, 118, 130, 125, 128, 115, 121, 123, 119
- After Treatment: 115, 120, 112, 128, 122, 125, 110, 117, 119, 114
**Step 1: Define the Hypothesis
- **Null Hypothesis: (H0)The new drug has no effect on blood pressure.
- **Alternate Hypothesis: (H1)The new drug has an effect on blood pressure.
**Step 2: Define the Significance level
Usually 0.05, meaning less than 5% chance results are by random chance.
**Step 3: Compute the test statistic
Using paired T-test analyze the data to obtain a test statistic and a p-value. The test statistic is calculated based on the differences between blood pressure measurements before and after treatment.
**t = m/(s/√n)
**Where:
- **m = mean of the difference i.e _X after, _X before
- **s = standard deviation of the difference (d) d_i = X_{\text{after},i} - X_{\text{before},i}
- **n = sample size
then m= -3.9, s= 1.37 and n= 10. we calculate the T-statistic = -9 based on the formula for paired t test
**Step 4: Find the p-value
With degrees of freedom = 9, p-value ≈ 0.0000085 (very small).
**Step 5: Result
Since the p-value (8.538051223166285e-06) is less than the significance level (0.05) the researchers reject the null hypothesis. There is statistically significant evidence that the average blood pressure before and after treatment with the new drug is different.
Python Implementation of Case A
Now we will implement this using paired T-test with the help of scipy.stats. Scipy is a mathematical library in Python that is mostly used for mathematical equations and computations . Here we use the Numpy Library for storing the data in arrays.
Python `
import numpy as np from scipy import stats
b = np.array([120, 122, 118, 130, 125, 128, 115, 121, 123, 119]) a = np.array([115, 120, 112, 128, 122, 125, 110, 117, 119, 114])
alpha = 0.05
t_stat, p_val = stats.ttest_rel(a, b)
m = np.mean(a - b) s = np.std(a - b, ddof=1) n = len(b) t_manual = m / (s / np.sqrt(n))
decision = "Reject" if p_val <= alpha else "Fail to reject" concl = "Significant difference." if decision == "Reject" else "No significant difference."
print("T:", t_stat) print("P:", p_val) print("T manual:", t_manual) print(f"Decision: {decision} H0 at α={alpha}") print("Conclusion:", concl)
`
**Output:
T: -9.0
P: 8.538051223166285e-06
T manual: -9.0
Decision: Reject H0 at α=0.05
Conclusion: Significant difference.
The T-statistic of about -9 and a very small p-value provide strong evidence to reject the null hypothesis at the 0.05 level. This means the new drug significantly lowers blood pressure. The negative T-statistic shows the average blood pressure after treatment is lower than before.
Limitations of Hypothesis Testing
Although hypothesis testing is a useful technique but it have some limitations as well:
- **Limited Scope: Hypothesis testing focuses on specific questions or assumptions and not capture the complexity of the problem being studied.
- **Data Quality Dependence: The accuracy of the results depends on the quality of the data. Poor-quality or inaccurate data can led to incorrect conclusions.
- **Missed Patterns: By focusing only on testing specific hypotheses important patterns or relationships in the data might be missed.
- **Context Limitations: It doesn’t always consider the bigger picture which can oversimplify results and led to incomplete insights.