Data Analysis with SciPy (original) (raw)
Last Updated : 15 Jun, 2026
SciPy (Scientific Python) is an open-source Python library for scientific computing and data analysis. Built on top of NumPy, it provides tools for statistics, optimization, signal processing and other mathematical operations.
- Provides statistical and mathematical functions.
- Supports optimization and signal processing.
- Widely used in data analysis, machine learning and research.
1. Importing Required Libraries
- Import SciPy and NumPy libraries.
- NumPy arrays are commonly used with SciPy functions. Python `
import numpy as np import pandas as pd
`
2. Measures of Central Tendency Using SciPy
- Mean represents the average value.
- Median represents the middle value.
- Mode represents the most frequent value. Python `
from scipy import stats import numpy as np
data = [10, 20, 30, 40, 50]
print("Mean:", np.mean(data)) print("Median:", np.median(data)) print("Mode:", stats.mode(data))
`
**Output:
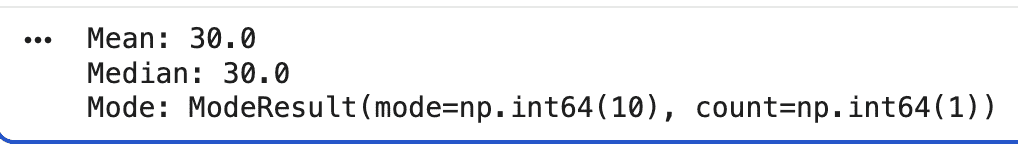
Output
3. Probability Distribution Analysis Using SciPy
Probability distributions describe how data values are distributed.
- loc=70 specifies the mean of the distribution.
- scale=10 specifies the standard deviation.
- norm.cdf() calculates the cumulative probability for a given value.
- The result represents the probability of obtaining a value less than or equal to the specified value (85 in this example). Python `
from scipy.stats import norm
probability = norm.cdf(85, loc=70, scale=10)
print("Probability:", probability)
`
**Output:
Probability: 0.9331
4. Hypothesis Testing
Hypothesis testing helps determine whether a statistical claim is supported by data. SciPy provides functions for t-tests, chi-square tests and other statistical tests.
- Tests whether the sample mean differs from a given value.
- A small p-value indicates a statistically significant difference. Python `
from scipy import stats
data = [22, 25, 19, 24, 28, 30]
t_stat, p_value = stats.ttest_1samp(data, 25)
print("T-Statistic:", t_stat) print("P-Value:", p_value)
`
**Output:
T-Statistic: -0.204
P-Value: 0.845
5. Correlation Analysis
Correlation measures the strength and direction of the relationship between two variables.
- Pearson correlation ranges from -1 to 1.
- Values close to 1 indicate a strong positive relationship. Python `
from scipy.stats import pearsonr
x = [1, 2, 3, 4, 5] y = [2, 4, 6, 8, 10]
corr, p_value = pearsonr(x, y)
print("Correlation:", corr)
`
**Output:
Correlation: 1.0
6. Linear Algebra Operations
SciPy provides efficient functions for matrix operations and solving linear equations.
- A represents the coefficients of the linear equations.
- B represents the constant values on the right hand side of the equations.
- linalg.solve() computes the values of the unknown variables that satisfy the equations. Python `
from scipy import linalg
A = [[3, 2], [1, 2]] B = [5, 5]
solution = linalg.solve(A, B)
print(solution)
`
**Output:
[0. 2.5]
7. Optimization Using SciPy
Optimization is used to find the best solution to a problem by minimizing or maximizing a function.
- objective() defines the function to optimize.
- minimize() finds the value of x that minimizes the function.
- x0=5 specifies the starting point for the search.
- The result returns the optimal value of x. Python `
from scipy.optimize import minimize
def objective(x): return x**2 + 4
result = minimize(objective, x0=5)
print(result.x)
`
**Output:
[-2.62955131e-08]
Download full code from here
Advantages
- Easy to use and well documented.
- Provides a large collection of scientific functions.
- Integrates seamlessly with NumPy and Pandas.
- Efficient for numerical and statistical computations.
Limitations
- Requires basic knowledge of statistics and mathematics.
- Some operations can be complex for beginners.
- Not primarily designed for data visualization.