Analyzing the Graphs of Functions (original) (raw)
Last Updated : 23 Jul, 2025
Graphs of functions are visual representations of how one quantity depends on another. In simple terms, a graph shows the relationship between two variables: one variable is usually on the horizontal axis (called the **x-axis), and the other is on the vertical axis (called the **y-axis).
For example, if you have a function like y = 2x + 1, the graph of this function will show how the value of y changes as x changes. By plotting different points (where you input different values for x, calculate y, and mark them on the graph), you'll see a line or curve that represents the function.
Table of Content
Key Elements of Graph Analysis
When analysing graphs, we need to check many aspects of the graph, such as domain, range, intercepts, symmetry, etc. Let's discuss these aspects in detail.
Domain and Range
- **Domain: The set of all possible input values (x values).
- **Range: The set of all possible output values (y values).
**For Example: f(x) = √x.
- **Domain: x ≥ 0 (since the square root is not defined for negative numbers).
- **Range: y ≥ 0(the output of a square root is always non-negative).
Intercepts
- **X-Intercepts: Points where the graph crosses the x axis f(x) = 0.
- **Y-Intercept: The point where the graph crosses the y axis x = 0.
**For Example: f(x) = x 2 −4
- **x-intercepts: Solve x2 − 4 = 0, so x = −2 and x = 2. The graph crosses the x-axis at (-2, 0) and (2, 0).
- **y-intercept: f(0) = −4, so the graph crosses the y-axis at (0, -4).
**Continuity
A function is continuous if its graph can be drawn without lifting the pencil. Discontinuities may occur at points where the function is undefined or has abrupt jumps.
**For Example: f(x) = 1/x
- The function is continuous everywhere **except at x = 0, where there is a vertical asymptote (discontinuity).
Symmetry
Some functions exhibit symmetry:
- **Even Functions: Symmetric about the y axis f(-x) = f(x).
- **Odd Functions: Symmetric about the origin f(- x) = -f(x).
**For Example:
- **Even function: f(x) = x2 is symmetric about the y-axis because f(x) = f(−x).
- **Odd function: f(x) = x3 is symmetric about the origin because f(x) = −f(−x).
Asymptotes
- **Vertical Asymptotes****:** Lines that the graph approaches but never touches, usually found in rational functions.
- **Horizontal Asymptotes****:** Lines that the graph approaches as x approaches infinity or negative infinity.
- **Example of vertical asymptote: f(x) = 1/(x − 2)
- The graph has a vertical asymptote at x = 2 (the function is undefined at x = 2).
- **Example of horizontal asymptote: f(x) = 3x + 1
- As x → ∞ or x → −∞ f(x) → 0, so the horizontal asymptote is y = 0.
Increasing and Decreasing Intervals
The interval in which y value is increasing is called increasing interval whereas the interval in which y value is decreasing is called decreasing interval.
**Example: f(x) = x3 − 3x2 + 2.
- The derivative f′(x) = 3x2 − 6xf.
- Solving f′(x) = 0 gives x = 0 and x = 2, which are critical points.
- From analyzing the sign of f′(x), the function is increasing on (−∞, 0) ∪ (2, ∞) and decreasing on (0, 2).
Maximum and Minimum Points
- **Maximum Points: The point where the function has it maximum value is called as maximum Point.
- **Minimum Points: The point where the functions has its minimum value is called as minimum point.
Various Graphs of Functions
Functions can be categorized into several types, each exhibiting unique characteristics:
Linear Functions
Linear functions are represented by the equation y = mx + b, where m is the slope and b is the y-intercept. The graph of a linear function is a straight line.
**Analysis: The slope indicates the rate of change. A positive slope indicates an increase, while a negative slope indicates a decrease. The y-intercept shows where the line crosses the axis.
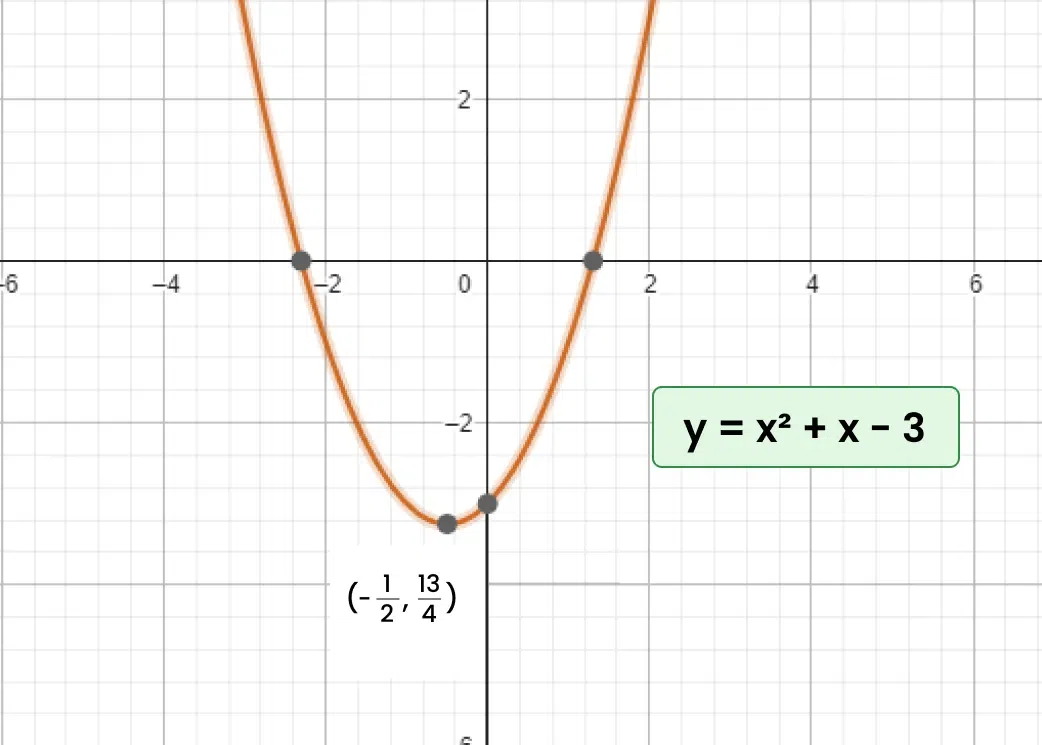
Quadratic Functions
Quadratic functions take the form y = ax2 + bx + c. The graph of a quadratic function is a parabola.
Analysis : The direction of the parabola (opening upwards or downwards) depends on the sign of a. The vertex represents the maximum or minimum point, and the axis of symmetry can be found using x = \frac{b}{2a}.
Polynomial Functions
Polynomial functions can be expressed as f(x) = anxn + an-1xn -1 + . . . + a0. The degree of the polynomial determines the graph's general shape.
Analysis : Higher degree polynomials may exhibit multiple turning points. The end behavior of the graph is influenced by the leading term, with odd degree functions exhibiting opposite end behaviors and even degree functions sharing the same behavior.
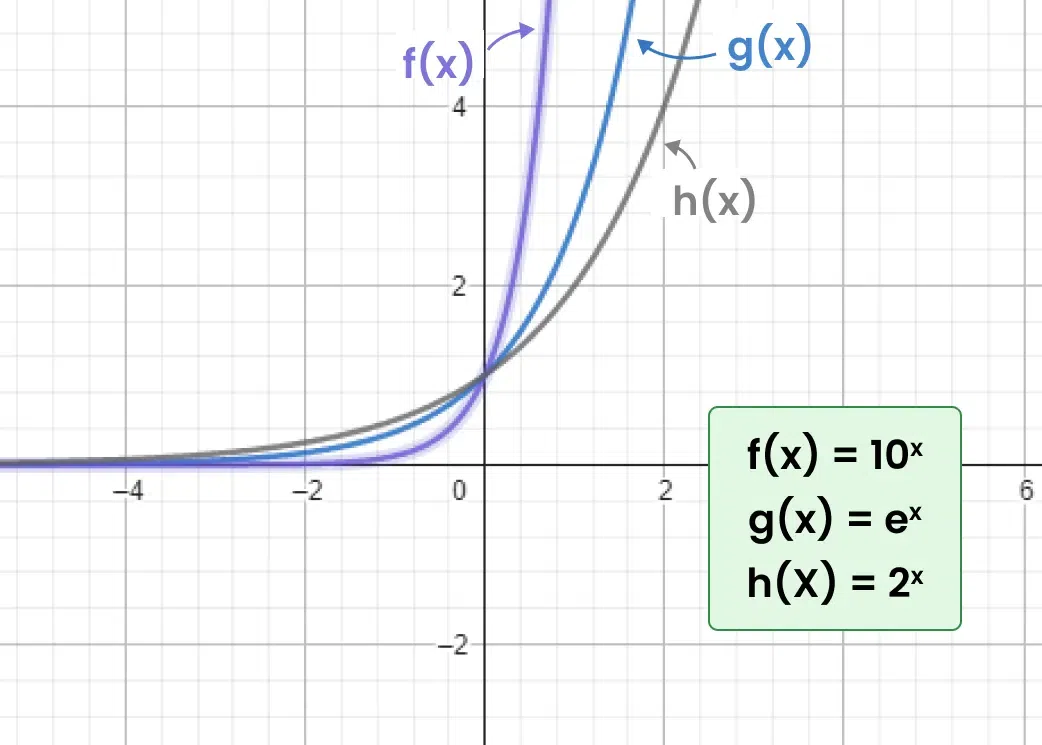
Exponential Functions
Exponential functions have the form y = abx, where b > 0.
**Analysis: The graph grows rapidly for b > 1 and approaches zero as x decreases for 0 < b < 1. The y intercept occurs at y = a.
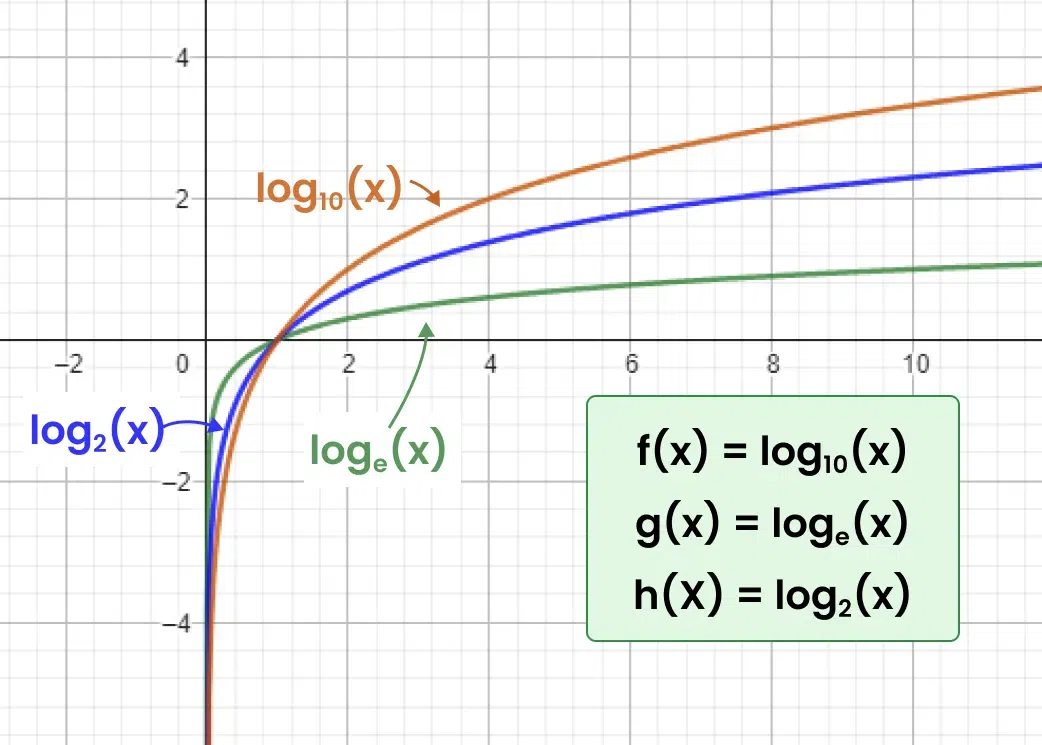
Logarithmic Functions
Logarithmic functions are the inverse of exponential functions, expressed as y = logb(x).
**Analysis: The graph approaches the y axis but never touches it (asymptote). It increases gradually and passes through the point (1, 0).
Solved Examples on Analyzing Graph of Functions
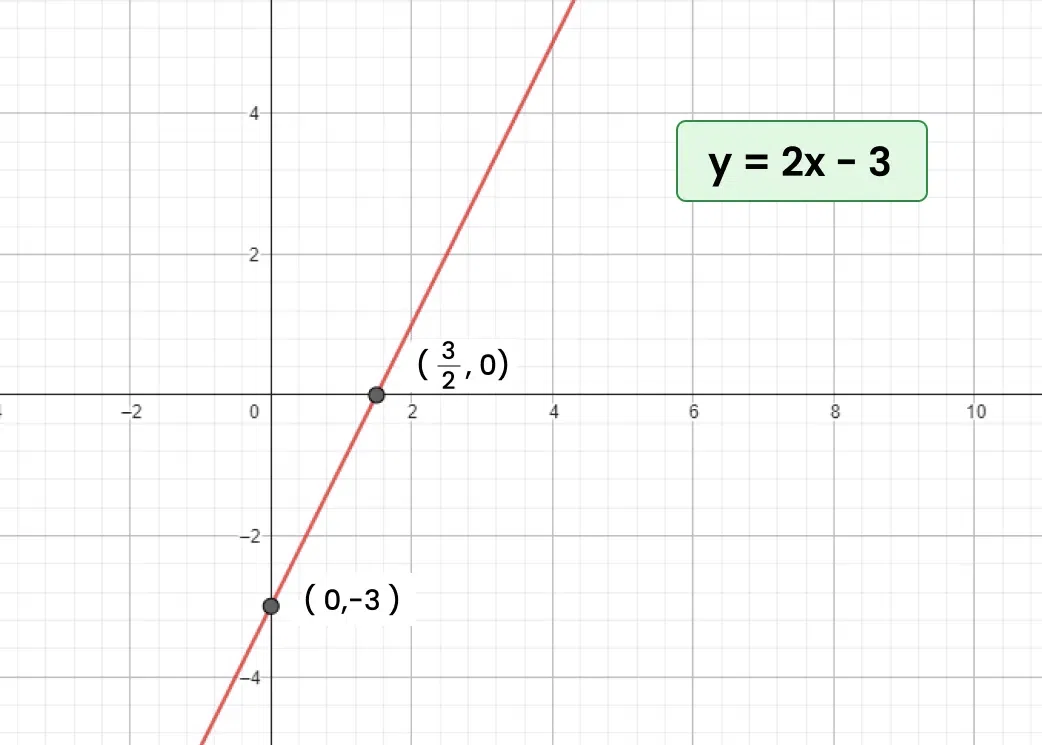
**Example 1 : Analyze the function f(x) = 2x - 3
**Solution:
**Type of Function: This is a linear function of the form y = mx + b, where m = 2 and b = −3.
**Slope (m): The slope m = 2 means the line rises by 2 units for every 1 unit increase in x.
**Y-Intercept (b): The y-intercept is at b = −3, which means the line crosses the y-axis at the point (0,−3).
**X-Intercept: Set f(x) = 0 to find where the line crosses the x-axis:
⇒ 2x − 3 = 0
⇒ x = 3/2 = 1.5So, the x-intercept is (1.5,0).
**Example 2: Analyze the function f(x) = 4x² + 5x - 1.
**Solution:
**Type of function: This function is a quadratic function of the form ax² + bx + c.
**Graph: Graph of a quadratic function is parabola.
**Upward or Downward: Since, in above function the value a = 4 that is positive so, the parabola is in upward direction.
**Axis of symmetry: The axis of symmetry is given by b / 2a = 5 / 8
**Example 3: Analyze the function y = 2 (6)⁴.
**Solution:
**Type of function: This is exponential type of function of the for y = abx.
**Graph: Since, b > 1 i.e., 6 so graph rapidly grows.
**Y- intercept: Y intercept occurs at y= 2
Worksheet on Analyzing the Graphs of Functions
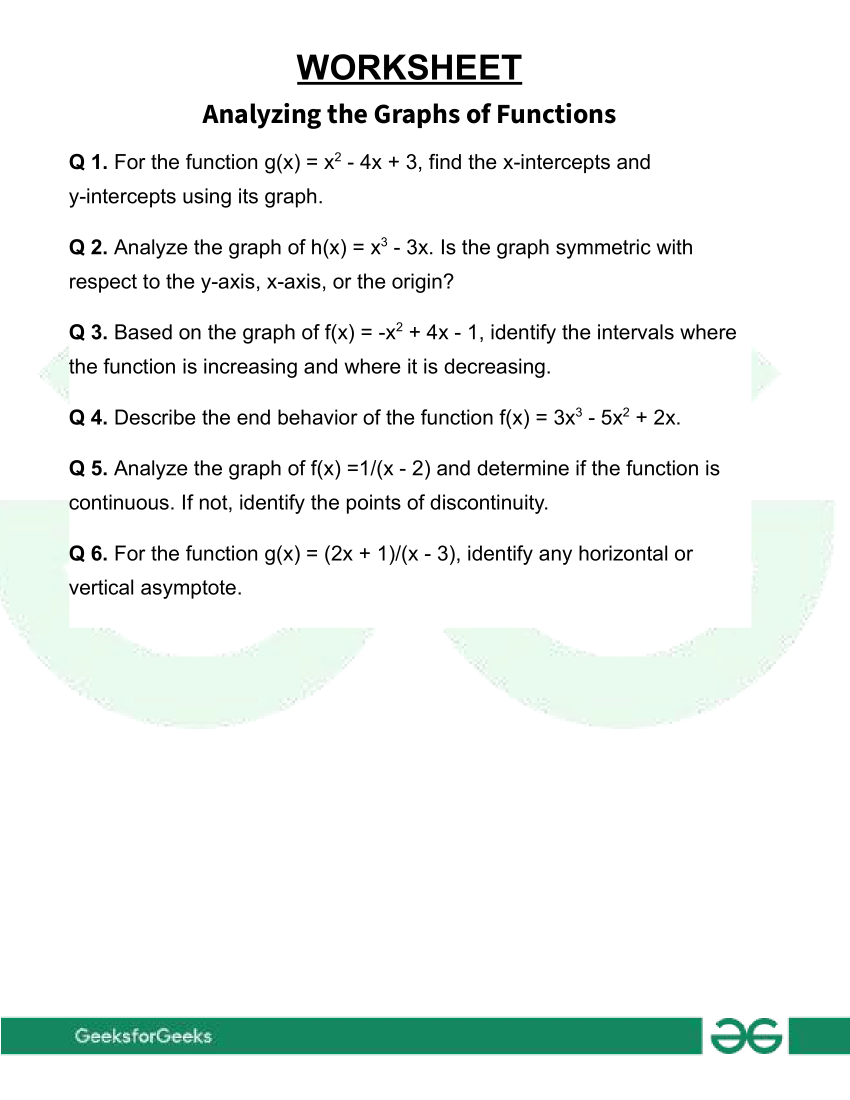
You can download this free worksheet on Analyzing the Graphs of Functions from below:
| Download Free Worksheet on Analyzing the Graphs of Functions |
|---|
Conclusion
From the above discussion we can conclude that for analyzing a graph of a function we require domain and Range of the function, zeros of function, maximum and minimum Points of the function, increasing, decreasing interval etc.