colormap - View and set current colormap - MATLAB (original) (raw)
View and set current colormap
Syntax
Description
Set Colormap
colormap [map](#buc3wsn-1-map) sets the colormap for the current figure to the specified predefined colormap. For example,colormap hot sets the colormap tohot.
If you set the colormap for the figure, then axes and charts in the figure use the same colormap. The new colormap is the same length (number of colors) as the current colormap. When you use this syntax, you cannot specify a custom length for the colormap. See the More About section for more information about colormaps.
colormap([map](#buc3wsn-1-map)) sets the colormap for the current figure to the colormap specified by map.
colormap([target](#buc3wsn-1-target),[map](#buc3wsn-1-map)) sets the colormap for the figure, axes, or standalone visualization specified bytarget, instead of for the current figure.
[cmap](#buc3wsn-1-cmap) = colormap(___) sets the colormap and returns it as a three-column matrix of RGB triplets. Specify cmap as an output argument with any of the previous syntaxes that use parentheses.
Get Current Colormap
[cmap](#buc3wsn-1-cmap) = colormap returns the colormap for the current figure as a three-column matrix of RGB triplets.
[cmap](#buc3wsn-1-cmap) = colormap([target](#buc3wsn-1-target)) returns the colormap for the figure, axes, or standalone visualization specified bytarget.
Examples
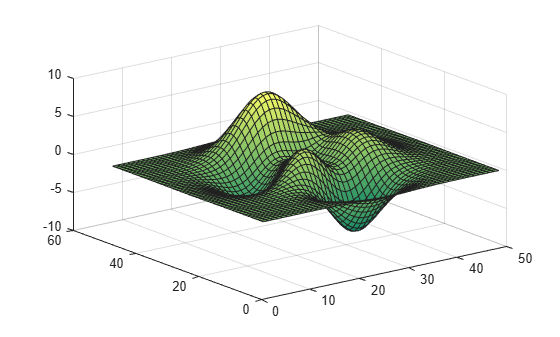
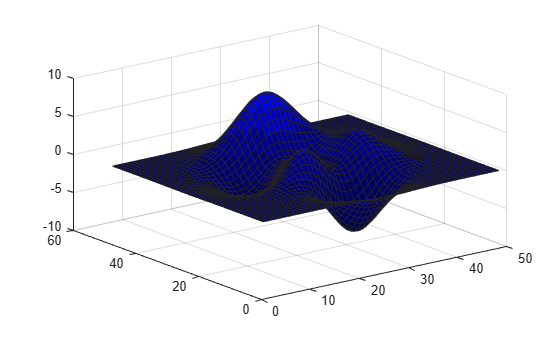
Create a surface plot and set the colormap to winter.
surf(peaks) colormap winter
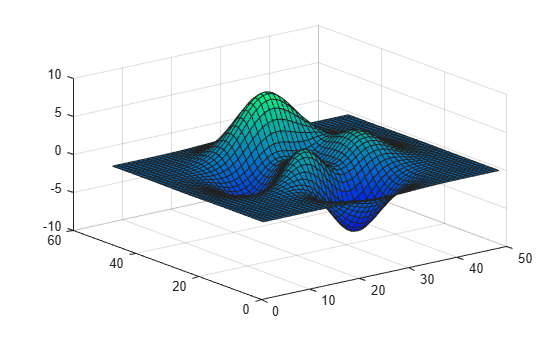
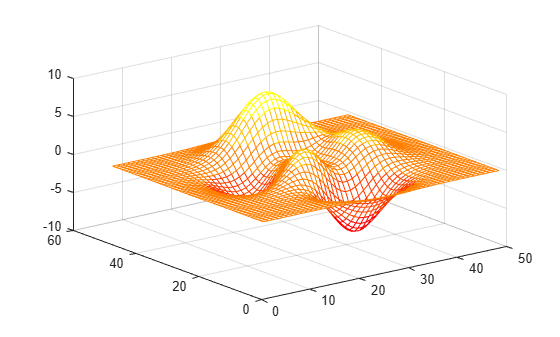
First, change the colormap for the current figure to summer.
surf(peaks) colormap summer
Now set the colormap back to your system's default value. If you have not specified a different default value, then the default colormap is parula.
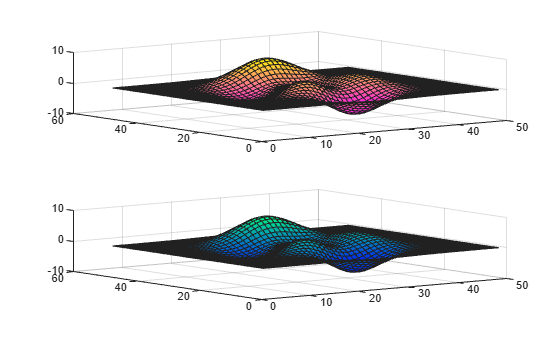
You can display a tiling of plots using the tiledlayout and nexttile functions. Call the tiledlayout function to create a 2-by-1 tiled chart layout. Call the nexttile function to create the axes objects ax1 and ax2. Specify a different colormap for each axes by passing the axes object to the colormap function. In the upper axes, create a surface plot using the spring colormap. In the lower axes, create a surface plot using the winter colormap.
tiledlayout(2,1) ax1 = nexttile; surf(peaks) colormap(ax1,spring)
ax2 = nexttile; surf(peaks) colormap(ax2,winter)
Specify the number of colors used in a colormap by passing an integer as an input argument to the built-in colormap. Use five colors from the parula colormap.
mesh(peaks) colormap(parula(5))
Create a custom colormap by defining a three-column matrix of values between 0.0 and 1.0. Each row defines a three-element RGB triplet. The first column specifies the red intensities. The second column specifies the green intensities. The third column specifies the blue intensities.
Use a colormap of blue values by setting the first two columns to zeros.
map = [0 0 0.3 0 0 0.4 0 0 0.5 0 0 0.6 0 0 0.8 0 0 1.0];
surf(peaks) colormap(map)
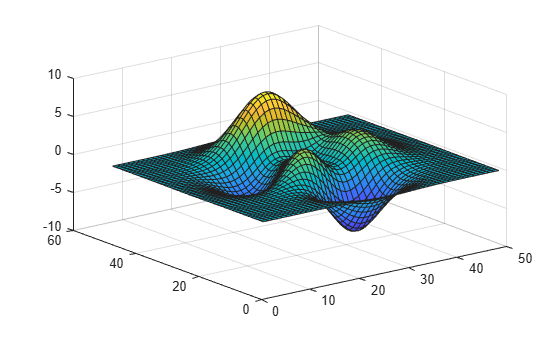
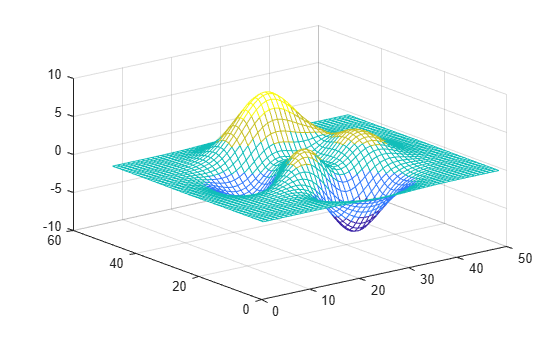
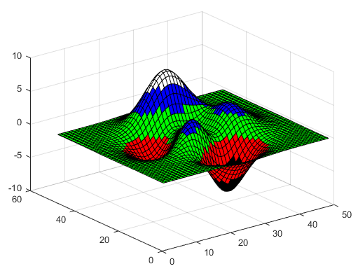
Create a surface plot of the peaks function and specify a colormap.
mesh(peaks) colormap(autumn(5))
Return the three-column matrix of values that define the colors used in the plot. Each row is an RGB triplet color value that specifies one color of the colormap.
cmap = 5×3
1.0000         0         0
1.0000    0.2500         0
1.0000    0.5000         0
1.0000    0.7500         0
1.0000    1.0000         0
Return the colormap values for a specific axes by passing the axes object to the colormap function.
Create a tiling of two plots using the tiledlayout and nexttile functions. Call the tiledlayout function to create a 2-by-1 tiled chart layout. Call the nexttile function to create the axes objects ax1 and ax2. Then display two filled contour plots with different colormaps.
tiledlayout(2,1) ax1 = nexttile; contourf(peaks) colormap(ax1,hot(8))
ax2 = nexttile; contourf(peaks) colormap(ax2,pink)
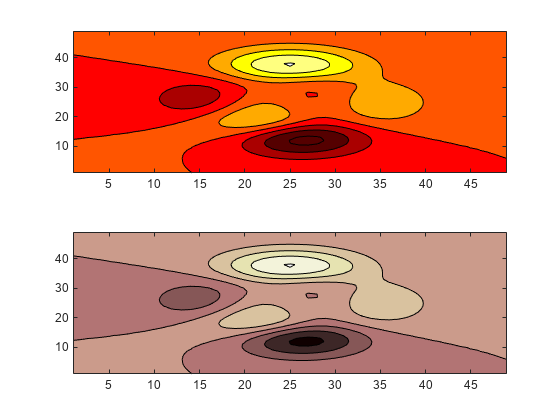
Return the colormap values used in the upper plot by passing ax1 to the colormap function. Each row is an RGB triplet color value that specifies one color of the colormap.
cmap = 8×3
0.3333 0 0
0.6667 0 0
1.0000 0 0
1.0000 0.3333 0
1.0000 0.6667 0
1.0000 1.0000 0
1.0000 1.0000 0.5000
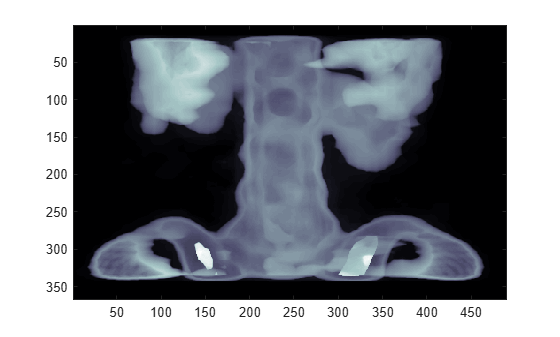
1.0000 1.0000 1.0000Load the spine data set that returns the image X and its associated colormap map. Display X using the image function and set the colormap to map.
load spine image(X) colormap(map)
Input Arguments
Colormap for the new color scheme, specified as a colormap name, a three-column matrix of RGB triplets, or 'default'. A colormap name specifies a predefined colormap with the same number of colors as the current colormap. A three-column matrix of RGB triplets specifies a custom colormap. You can create the matrix yourself, or you can call one of the predefined colormap functions to create the matrix. For example,colormap(parula(10)) sets the colormap of the current figure to a selection of 10 colors from the parula colormap.
A value of 'default' sets the colormap to the default colormap for the target object.
Colormap Name
The following table lists the predefined colormaps.
| Colormap Name | Color Scale |
|---|---|
| parula |  |
| turbo |  |
| hsv |  |
| hot |  |
| cool |  |
| spring |  |
| summer |  |
| autumn |  |
| winter |  |
| gray |  |
| bone |  |
| copper |  |
| pink |  |
| sky (since R2023a) |  |
| abyss (since R2023b) |  |
| nebula (since R2025a) |  |
| jet |  |
| lines |  |
| colorcube |  |
| prism |  |
| flag |  |
| white |  |
Three-Column Matrix
To create a custom colormap, specify map as a three-column matrix of RGB triplets where each row defines one color. An RGB triplet is a three-element row vector whose elements specify the intensities of the red, green, and blue components of the color. The intensities can be double orsingle values in the range [0, 1], or they can beuint8 values in the range [0, 255]. For example, this matrix defines a colormap containing five colors.
map = [0.2 0.1 0.5 0.1 0.5 0.8 0.2 0.7 0.6 0.8 0.7 0.3 0.9 1 0];
This table lists the RGB triplet values for common colors.
| Color | double orsingle RGB Triplet | uint8 RGB Triplet |
|---|---|---|
| yellow | [1 1 0] | [255 255 0] |
| magenta | [1 0 1] | [255 0 255] |
| cyan | [0 1 1] | [0 255 255] |
| red | [1 0 0] | [255 0 0] |
| green | [0 1 0] | [0 255 0] |
| blue | [0 0 1] | [0 0 255] |
| white | [1 1 1] | [255 255 255] |
| black | [0 0 0] | [0 0 0] |
Data Types: char | double | single | uint8
Target, specified as one of these values:
Figureobject. The figure colormap affects plots for all axes within the figure.Axesobject,PolarAxesobject, orGeographicAxesobject. You can define a unique colormap for the different axes within a figure.- Standalone visualization that has a
Colormapproperty. For example, you can change or query the colormap for aHeatmapChartobject.
Output Arguments
Colormap values, returned as a three-column matrix of RGB triplets. Each row of the matrix defines one RGB triplet that specifies one color of the colormap. The values are in the range [0, 1].
More About
A colormap is a matrix of values that define the colors for graphics objects such as surface, image, and patch objects. MATLAB® draws the objects by mapping data values to colors in the colormap.
Colormaps can be any length, but must be three columns wide. Each row in the matrix defines one color using an RGB triplet. An RGB triplet is a three-element row vector whose elements specify the intensities of the red, green, and blue components of the color. Typically, the intensities are double or single values in the range [0, 1]. A value of 0 indicates no color and a value of1 indicates full intensity. For example, this command creates a colormap that has five colors: black, red, green, blue, and white.
mymap = [0 0 0 1 0 0 0 1 0 0 0 1 1 1 1];
To change the color scheme of a visualization, call the colormap function to change the colormap of the containing axes or figure. For example, these commands create a surface plot and set the colormap of the figure tomymap.
surf(peaks) colormap(mymap)
Tips
- To control the limits of the colormap, and how those limits relate to the range of your data, use the clim function.
Before R2022a: Usecaxis, which has the same syntaxes and arguments asclim.
Version History
Introduced before R2006a
You can optionally specify an output argument to store the colormap array when you set the current figure's colormap to the default value. For example:
cmap = colormap("default")
Setting the colormap on a heatmap chart to 'default' sets the chart's colormap to the default blue colormap for heatmap charts. In R2020a and previous releases, the 'default' option changes the colormap toparula.
To specify the default colormap for a heatmap chart, pass the chart to thecolormap function.
h = heatmap(rand(10)); colormap(h,'default')
Only heatmap charts are affected by this change.
Starting in R2018a, if you set the colormap for a figure, then axes and charts in the figure use the same colormap. Previously, any axes or chart that you set the colormap for explicitly were unaffected when you set the figure colormap. If you want an Axes object to use a different colormap than the figure, then set the axes colormap after setting the figure colormap.