imshow - Display image - MATLAB (original) (raw)
Syntax
Description
imshow([I](#bvmnrxi-1-I)) displays the grayscale image I in a figure. imshow uses the default display range for the image data type and optimizes figure, axes, and image object properties for image display.
imshow([I](#bvmnrxi-1-I),[[low high]](#bvmnrxi-1-lowhigh)) displays the grayscale image I, specifying the display range as a two-element vector, [low high]. For more information, see the DisplayRange argument.
imshow([I](#bvmnrxi-1-I),[]) displays the grayscale image I, scaling the display based on the range of pixel values in I. imshow uses[min(I(:)) max(I(:))] as the display range.imshow displays the minimum value inI as black and the maximum value as white. For more information, see the DisplayRange argument.
imshow([RGB](#d126e882020)) displays the truecolor image RGB in a figure.
imshow([BW](#d126e882069)) displays the binary imageBW in a figure. For binary images,imshow displays pixels with the value0 (zero) as black and 1 as white.
imshow([X](#bvmnrxi-1-X),[map](#bvmnrxi-1-map)) displays the indexed image X with the colormapmap.
imshow([filename](#bvmnrxi-1-filename)) displays the image stored in the graphics file specified by filename.
imshow(___,[Name=Value](#namevaluepairarguments)) displays an image, using name-value arguments to control aspects of the operation.
[himage](#bvmnrxi-1-himage) = imshow(___) returns the image object created by imshow.
Examples
Display an RGB (truecolor), grayscale, binary, or indexed image using the imshow function.
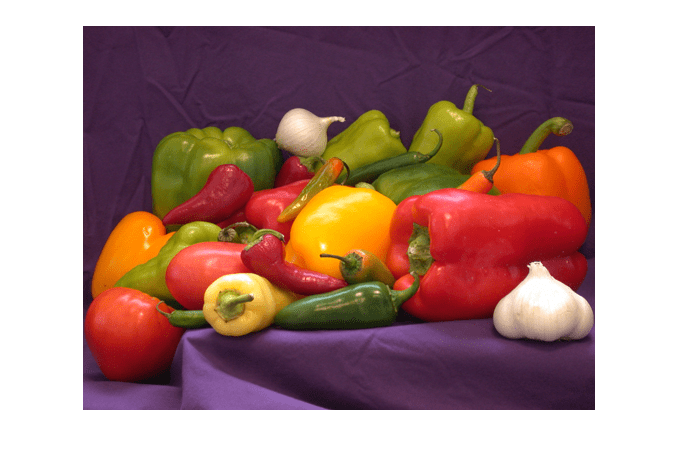
Display an RGB Image
Read a sample RGB image, peppers.png, into the MATLAB® workspace.
rgbImage = imread("peppers.png");
Display the RGB image using imshow.

Display a Grayscale Image
Convert the RGB image to a grayscale image by using the im2gray function.
grayImage = im2gray(rgbImage);
Display the grayscale image using imshow.

Display a Binary Image
Convert the grayscale image to a binary image by using thresholding.
meanVal = mean(grayImage,"all"); binaryImage = grayImage >= meanVal;
Display the binary image using imshow.

Display an Indexed Image
Read a sample indexed image, corn.tif, into the MATLAB workspace.
[corn_indexed,map] = imread("corn.tif");
Display the indexed image using imshow.

Display an image stored in a file.
filename = "peppers.png"; imshow(filename)
Load a sample grayscale volumetric image, mri.mat, into the variable D in the workspace. Remove the singleton dimension of the volume using the squeeze function.
load("mri.mat"); vol = squeeze(D);
Select a slice from the middle of the volume. Display the slice using the copper colormap and scaling the display range to the range of pixel values.
sliceZ = vol(:,:,13); imshow(sliceZ,[],Colormap=copper)

Change the colormap for the image using the colormap function.

Read a truecolor (RGB) image into the workspace. The data type of the image is uint8.
RGB = imread("peppers.png");
Extract the green channel of the image. The green channel is the second color plane.
G = RGB(:,:,2); imshow(G)

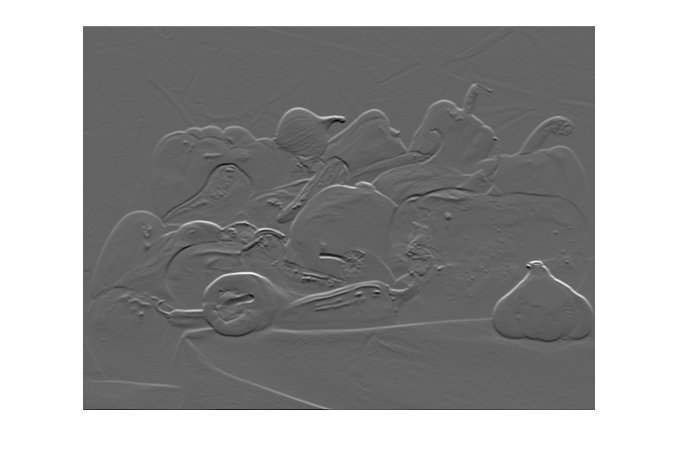
Create a filter that detects horizontal edges in the image.
filt = [-1 -1 -1; 0 0 0; 1 1 1];
Filter the green channel of the image using the filter2 function. The result is an image of data type double, with a minimum value of -422 and a maximum value of 656. Pixels with a large magnitude in the filtered image indicate strong edges.
Display the filtered image using imshow with the default display range. For images of data type double, the default display range is [0, 1]. The image appears black and white because the filtered pixel values exceed the range [0, 1].

Display the filtered image and scale the display range to the pixel values in the image. The image displays with the full range of grayscale values.
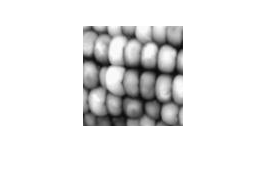
Read the grayscale image from the corn.tif file into the workspace. The grayscale version of the image is the second image in the file.
corn_gray = imread("corn.tif",2);
Select a small portion of the image. Display the detail image at 100% magnification using imshow.
corn_detail = corn_gray(1:100,1:100); imshow(corn_detail)
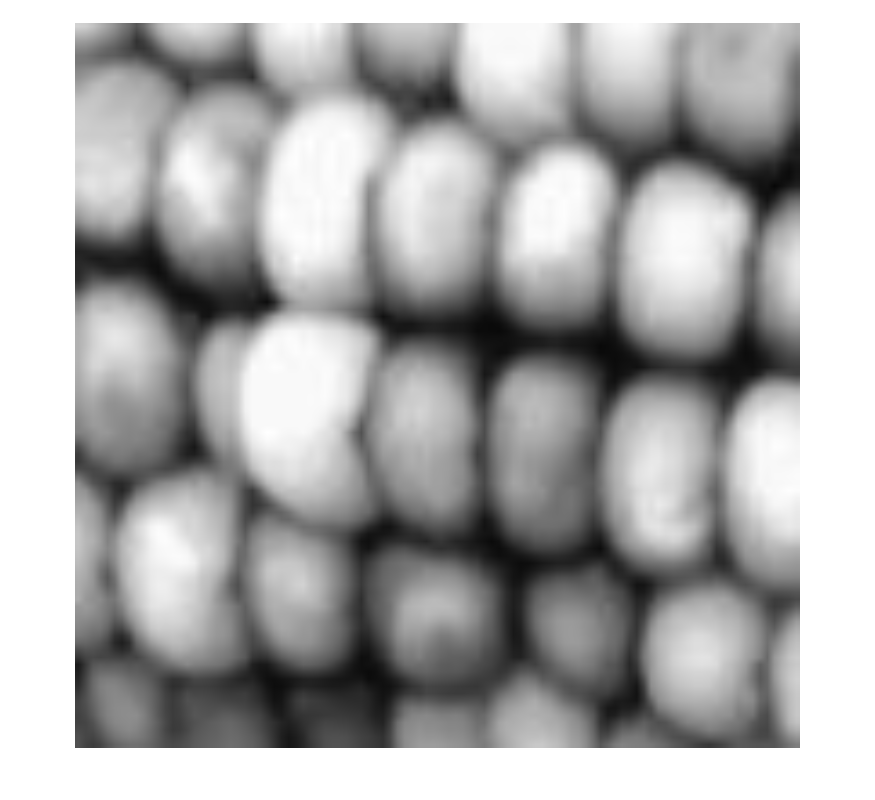
Display the image at 1000% magnification by using the InitialMagnification name-value argument. By default, imshow performs nearest neighbor interpolation of pixel values. The image has blocking artifacts.
imshow(corn_detail,InitialMagnification=1000)

Display the image at 1000% magnification, specifying the bilinear interpolation technique. The image appears smoother.
imshow(corn_detail,InitialMagnification=1000,Interpolation="bilinear")
Input Arguments
Grayscale image, specified as a matrix. A grayscale image can be of any numeric data type.
Data Types: single | double | int8 | int16 | int32 | int64 | uint8 | uint16 | uint32 | uint64 | logical
Truecolor image, specified as an_m_-by-_n_-by-3 array.
If you specify a truecolor image of data type single ordouble, then values should be in the range [0, 1]. If pixel values are outside this range, then you can use the rescale function to scale pixel values to the range [0, 1]. The DisplayRange argument has no effect when the input image is truecolor.
Data Types: single | double | uint8 | uint16
Binary image, specified as a matrix.
Data Types: logical
Indexed image, specified as a 2-D matrix of positive integers. The values in X are indices into the colormap specified bymap.
Data Types: single | double | uint8 | logical
Colormap associated with indexed image X, specified as a _c_-by-3 matrix. Each row of map is a three-element RGB triplet that specifies the red, green, and blue components of a single color of the colormap. You can optionally create a colormap matrix using a predefined colormap function, such as parula or jet.
When map is of data type single ordouble, the values of the matrix must be in the range [0, 1].
Data Types: single | double | uint8
Filename, specified as a string scalar or character vector. The image must be readable by the imread function. Theimshow function displays the image, but does not store the image data in the MATLAB® workspace. If the file contains multiple images, thenimshow displays the first image in the file.
Example: "peppers.png"
Data Types: string | char
Grayscale image display range, specified as a two-element vector. For more information, see the DisplayRange name-value argument.
Example: [50 250]
Data Types: single | double | int8 | int16 | int32 | int64 | uint8 | uint16 | uint32 | uint64
Name-Value Arguments
Specify optional pairs of arguments asName1=Value1,...,NameN=ValueN, where Name is the argument name and Value is the corresponding value. Name-value arguments must appear after other arguments, but the order of the pairs does not matter.
Example: imshow("street1.jpg",Border="tight") displays the image with filename "street1.jpg" without space around the image in the figure.
Before R2021a, use commas to separate each name and value, and enclose Name in quotes.
Example: imshow("street1.jpg","Border","tight") displays the image with filename "street1.jpg" without space around the image in the figure.
Figure window border space, specified as "tight" or"loose". When set to "loose", the figure window includes space around the image in the figure. When set to "tight", the figure window does not include any space around the image in the figure.
If the image is very small or if the figure contains other objects besides an image and its axes, imshow might use a border regardless of how this argument is set.
Data Types: char
Colormap of the axes, specified as a _c_-by-3 matrix. Each row of the matrix is a three-element RGB triplet that specifies the red, green, and blue components of a single color of the colormap. You can optionally create a colormap matrix using a predefined colormap function, such as parula or jet.
When Colormap is of data typesingle or double, the values of the matrix must be in the range [0, 1].
Use this argument to view a grayscale, indexed, or binary image in false color. If you specify a truecolor image RGB, then the imshow function ignores theColormap argument.
Example: Colormap=parula
Data Types: single | double | uint8
Display range of a grayscale image, specified as a two-element vector of the form [low high]. Theimshow function displays the valuelow (and any value less thanlow) as black, and it displays the valuehigh (and any value greater thanhigh) as white. Values betweenlow and high are displayed as intermediate shades of gray, using the default number of gray levels.
If you specify an empty matrix ([]), thenimshow uses a display range of[min(I(:)) max(I(:))]. In other words, the minimum value in I is black, and the maximum value is white.
If you do not specify a display range, thenimshow selects a default display range based on the image data type.
- If I is an integer type, then
`DisplayRange`defaults to the minimum and maximum representable values for that integer class. For example, the default display range foruint16arrays is [0, 65535]. - If
Iis of data typesingleordouble, then the default display range is [0, 1].
Note
Including the argument name is optional, except when the image is specified by a filename. The syntax imshow(I,[low high]) is equivalent toimshow(I,DisplayRange=[low high]). If you call imshow with a filename, then you must specify the DisplayRange name-value argument.
Example: DisplayRange=[10 250]
Data Types: single | double | int8 | int16 | int32 | int64 | uint8 | uint16 | uint32 | uint64
Initial magnification of the image display, specified as a numeric scalar or "fit". If set to 100, then imshow displays the image at 100% magnification (one screen pixel for each image pixel). If set to"fit", then imshow scales the entire image to fit in the window.
Initially, imshow attempts to display the entire image at the specified magnification. If the magnification value is so large that the image is too big to display on the screen,imshow displays the image at the largest magnification that fits on the screen.
If the image is displayed in a figure with itsWindowStyle property set to"docked", then imshow displays the image at the largest magnification that fits in the figure.
Note: If you specify the axes position, thenimshow ignores any initial magnification you might have specified and defaults to the "fit" behavior.
When you use imshow with theReduce name-value argument, the initial magnification must be "fit".
In MATLAB Online™, InitialMagnification is set to"fit" and cannot be changed.
Example: InitialMagnification=80
Data Types: single | double | int8 | int16 | int32 | int64 | uint8 | uint16 | uint32 | uint64 | char
Interpolation method, specified as "nearest" or"bilinear". MATLAB uses interpolation to display a scaled version of the image on your screen. The value you choose does not affect the image data. Choose an interpolation method based on your image content and the effect you want to achieve:
"nearest"— Nearest neighbor interpolation. The value of a pixel located at (x, y) is the value of the pixel that is closest to (x,y) in the original image. This method is best when there are a small number of pixel values that represent distinct categories, or when you want to see individual pixels in a highly zoomed-in view."bilinear"— Bilinear interpolation. The value of a pixel located at (x,y) is a weighted average of the surrounding pixels in the original image. To minimize display artifacts, theimshowfunction performs antialiasing when you shrink the image. This method is best in almost all other situations.
Parent axes of image object, specified as an Axes object or a UIAxes object. Use theParent name-value argument to build a UI that gives you control of the Figure andAxes properties.
Indicator for subsampling image, specified as a numeric or logicaltrue (1) orfalse (0). This argument is valid only when you use it with the name of a TIFF file. Use theReduce argument to display overviews of very large images.
Data Types: logical
X-axis limits of nondefault coordinate system, specified as a two-element vector. This argument establishes a nondefault spatial coordinate system by specifying the image XData. The value can have more than two elements, but imshow uses only the first and last elements.
Example: XData=[100 200]
Data Types: single | double | int8 | int16 | int32 | int64 | uint8 | uint16 | uint32 | uint64
Y-axis limits of nondefault coordinate system, specified as a two-element vector. The value can have more than two elements, butimshow uses only the first and last elements.
Example: YData=[100 200]
Data Types: single | double | int8 | int16 | int32 | int64 | uint8 | uint16 | uint32 | uint64
Output Arguments
Image created by the imshow function, specified as an image object.
Tips
- To change the colormap after you create the image, use the colormap command.
- You can display multiple images with different colormaps in the same figure using
imshowwith the tiledlayout and nexttile functions. - The
imshowfunction is not supported when you start MATLAB with the-nojvmoption. - Figure titles can appear cut off in the Live Editor. To ensure the whole title is visible, set the
PositionContraintproperty of the parent axes object to"outerposition". Update the property value after theimshowfunction and before thetitlefunction.
I = imread("peppers.png");
imshow(I)
ax = gca;
ax.PositionConstraint = "outerposition";
title("Peppers");
If you specify the parent axes using theParent name-value argument, set thePositionConstraintproperty of the specified parent axes object. For more details about axes position properties, see Control Axes Layout. - In some cases,
imshowdeletes the current axes and creates new axes. If a figure contains only one axes of default size,imshowretains the axes the first time you call it, but deletes the axes and creates a new axes if you callimshowagain. To retain a persistent axes, such as when updating the image displayed in a graphical user interface, callhold onafter the first call toimshow. Alternatively, you can update the image without callingimshowmultiple times by updating theCDataproperty of theImageobject returned byimshow, instead.
Extended Capabilities
The imshow function supports GPU array input with these usage notes and limitations:
- This function accepts GPU arrays, but does not run on a GPU.
For more information, see Run MATLAB Functions on a GPU (Parallel Computing Toolbox).
Version History
Introduced before R2006a
You can now use imshow to get information about HEIF and HEIC image files.
This functionality requires MATLAB Support for HEIF/HEIC Image Format, which is available only on MATLAB desktop environment. However, you cannot use HEIF and HEIC image files in a standalone application workflow.
To install the support package:
- On the MATLAB Home tab, in theEnvironment section, selectAdd-Ons > Explore Add-Ons.
- In the Add-On Explorer search bar, search for MATLAB Support for HEIF/HEIC Image Format and then click the MATLAB Support for HEIF/HEIC Image Format add-on.
MATLAB Online and MATLAB Web App Server™ limit the maximum imshow display resolution to improve rendering speeds for large images. This behavior affects the on-screen display, but it does not affect the image data. Before displaying an image,imshow resizes the largest dimension to a maximum size of 512 pixels. The smaller dimension adjusts to preserve the aspect ratio of the image. To view images at their full resolution, use MATLAB desktop or set the MaxRenderedResolution property of the output Image object to "none". For details about the MaxRenderedResolution property, see Image Properties.
Previously, imshow required Image Processing Toolbox™.