GeographicBubbleChart - Standalone geographic bubble chart appearance and behavior - MATLAB (original) (raw)
GeographicBubbleChart Properties
Standalone geographic bubble chart appearance and behavior
GeographicBubbleChart properties control the appearance and behavior of a GeographicBubbleChart object. By changing property values, you can modify certain aspects of the chart. Use dot notation to query and set properties.
gb = geobubble(1:10,1:10); v = gb.GridVisible; gb.GridVisible = "off";
Bubble Location
Latitude coordinates in degrees, specified as a vector with elements in the range [–90, 90] or as an empty array ([]). The vector can contain NaN values. The sizes ofLatitudeData and LongitudeData must match.
In most cases, the latitude limits of the chart do not extend outside of the range [–85, 85] degrees. The latitude limits can extend outside of this range when you set the MapCenter andZoomLevel properties the chart. For more information, see Interact with Geographic Axes.
Data Types: single | double
Table variable containing the latitude coordinates, specified using one of these indexing schemes.
| Indexing Scheme | Examples |
|---|---|
| Variable name:A string scalar or character vector.A pattern object. The pattern object must refer to only one variable. | "A" or 'A' — A variable named A"Var"+digitsPattern(1) — The variable with the name "Var" followed by a single digit |
| Variable index:An index number that refers to the location of a variable in the table.A logical vector. Typically, this vector is the same length as the number of variables, but you can omit trailing 0 or false values. | 3 — The third variable from the table[false false true] — The third variable |
| Variable type:A vartype subscript that selects a table variable of a specified type. The subscript must refer to only one variable. | vartype("double") — The variable containing double values |
Regardless of the variable name, the axis label on the plot is alwaysLatitude.
The variable you specify must contain numeric data of typesingle or double. The data must be in the range [–90, 90].
When you set this property MATLAB® updates the LatitudeData property and sets the LatitudeData property to read-only.
Longitude coordinates in degrees, specified as a vector or as an empty array ([]). The vector can contain NaN values. The sizes of LatitudeData andLongitudeData must match.
Data Types: single | double
Table variable containing the longitude coordinates, specified using one of these indexing schemes.
| Indexing Scheme | Examples |
|---|---|
| Variable name:A string scalar or character vector.A pattern object. The pattern object must refer to only one variable. | "A" or 'A' — A variable named A"Var"+digitsPattern(1) — The variable with the name "Var" followed by a single digit |
| Variable index:An index number that refers to the location of a variable in the table.A logical vector. Typically, this vector is the same length as the number of variables, but you can omit trailing 0 or false values. | 3 — The third variable from the table[false false true] — The third variable |
| Variable type:A vartype subscript that selects a table variable of a specified type. The subscript must refer to only one variable. | vartype("double") — The variable containing double values |
Regardless of the variable name, the axis label on the plot is alwaysLongitude.
The variables you specify must contain numeric data of typesingle or double.
When you set this property MATLAB updates the LongitudeData property and sets the LongitudeData property to read-only.
Bubble Size
Minimum and maximum bubble diameters, specified as a positive scalar or as a 1-by-2 vector of positive numbers, where the second number is greater than the first. Specify a scalar when you want all the bubbles to have the same size. Specify the bubble diameters in points, where one point equals 1/72 of an inch. Values must be in the range [1, 100].
Relative bubble sizes, specified in one of these forms:
- Scalar — Use the same size for all the bubbles.
- Vector — Use a different size for each bubble. Specify
SizeDataas a vector the same length asLatitudeData.
SizeData can contain NaN values.
Size limits, specified as a 1-by-2 vector of non-descending values or as an empty array ([]). This property determines how size data values map to the bubble widths, where:
- The first element specifies the size data value that maps to the smallest bubble.
- The second element specifies the size data value that maps to the largest bubble.
To create bubbles that are all the same size, specify the same value for each element.
For more information about controlling the sizes of bubbles, see Control Bubbles in Standalone Geographic Bubble Charts.
Table variable containing the bubble size data, specified using one of these indexing schemes.
| Indexing Scheme | Examples |
|---|---|
| Variable name:A string scalar or character vector.A pattern object. The pattern object must refer to only one variable. | "A" or 'A' — A variable named A"Var"+digitsPattern(1) — The variable with the name "Var" followed by a single digit |
| Variable index:An index number that refers to the location of a variable in the table.A logical vector. Typically, this vector is the same length as the number of variables, but you can omit trailing 0 or false values. | 3 — The third variable from the table[false false true] — The third variable |
| Variable type:A vartype subscript that selects a table variable of a specified type. The subscript must refer to only one variable. | vartype("double") — The variable containing double values |
The variable you specify can contain any numeric type. When you set the SizeVariable property, MATLAB updates the SizeData property.
Bubble Color
List of bubble colors, specified using one of these forms:
- A three-column matrix of RGB triplets whose elements specify the intensities of the red, green, and blue components of the color. A convenient way to generate a three-column matrix of RGB triplets is to use a predefined colormap such as turbo or to return the colors of a predefined color palette by using the orderedcolors function.
- A color name such as
"red","green", or"blue". - A short name such as
"r","g", or"b". - A vector of string scalars that indicate color names or short names, such as
["red","green","blue"]or["r","g","b"]. - A cell array of character vectors that indicate color names or short names, such as
{'red','green','blue'}or{'r','g','b'}.
By default, the bubble chart selects colors from an ordered list of 7 standard colors. If the number of categories specified byColorData is greater than 7, the bubble chart cyclically repeats the colors.
Data Types: cell | string | double
Data that controls the bubble colors, specified as a categorical vector or as an empty array ([]). The geographic bubble chart assigns a color to each category using the colors stored in theBubbleColorList property. Bubbles associated with the same category have the same color on the map.
The size of ColorData must match the size ofLatitudeData, except when you specify an empty array.
Geographic bubble charts display the category values in the color legend. The color legend can display unexpected formatting when the values contain TeX markup characters, for example underscores.
- To use a TeX markup character in regular text, edit the name of the category by using the renamecats function, and then insert the TeX escape character (
\) before the character you want to include. - MATLAB supports a subset of TeX markup for the text displayed in legends. For more information about using TeX markup, see Greek Letters and Special Characters in Chart Text.
Data Types: categorical
Table variable containing the bubble color data, specified using one of these indexing schemes.
| Indexing Scheme | Examples |
|---|---|
| Variable name:A string scalar or character vector.A pattern object. The pattern object must refer to only one variable. | "A" or 'A' — A variable named A"Var"+digitsPattern(1) — The variable with the name "Var" followed by a single digit |
| Variable index:An index number that refers to the location of a variable in the table.A logical vector. Typically, this vector is the same length as the number of variables, but you can omit trailing 0 or false values. | 3 — The third variable from the table[false false true] — The third variable |
| Variable type:A vartype subscript that selects a table variable of a specified type. The subscript must refer to only one variable. | vartype("double") — The variable containing double values |
The variable you specify must contain categorical values. When you set the ColorVariable property, MATLAB updates the ColorData property.
Labels
Title of the geographic bubble chart, specified as a character vector, a cell array of character vectors, a string scalar, a string array, a numeric value, or a categorical value. When you specify this property using a categorical array, MATLAB uses the values in the array, not the categories.
Alternatively, you can add a title by using the title function.
Title of the color legend, specified as a character vector, a cell array of character vectors, a string scalar, a string array, a numeric value, or acategorical value. When you specify this property using a categorical array, MATLAB uses the values in the array, not the categories.
Title of the size legend, specified as a character vector, a cell array of character vectors, a string scalar, a string array, a numeric value, or acategorical value. When you specify this property using a categorical array, MATLAB uses the values in the array, not the categories.
Visibility of the size and color legends, specified as'on' or 'off' or the logical values 1 (true) or0 (false).
Alternatively, you can toggle the visibility of the legends by using thelegend function.
Data Types: char | string | logical
Font
Font size used in the geographic bubble chart, specified as positive scalar. The default font size depends on the specific operating system and locale. The geographic bubble chart measures the font size in points, where one point equals 1/72 of an inch.
Map
Map on which to plot data, specified as one of the values listed in the table. Six of the basemaps are tiled data sets created using Natural Earth. Five of the basemaps are high-zoom-level maps hosted by Esri®.
 |
'streets-light' (default)Map designed to provide geographic context while highlighting user data on a light background.Hosted by Esri. |  |
'streets-dark'Map designed to provide geographic context while highlighting user data on a dark background.Hosted by Esri. |
|---|---|---|---|
 |
'streets'General-purpose road map that emphasizes accurate, legible styling of roads and transit networks.Hosted by Esri. |  |
'satellite'Full global basemap composed of high-resolution satellite imagery.Hosted by Esri. |
 |
'topographic'General-purpose map with styling to depict topographic features.Hosted by Esri. |  |
'landcover'Map that combines satellite-derived land cover data, shaded relief, and ocean-bottom relief. The light, natural palette is suitable for thematic and reference maps.Created using Natural Earth. |
 |
'colorterrain'Shaded relief map blended with a land cover palette. Humid lowlands are green and arid lowlands are brown.Created using Natural Earth. |  |
'grayterrain'Terrain map in shades of gray. Shaded relief emphasizes both high mountains and micro-terrain found in lowlands. Created usingNatural Earth. |
 |
'bluegreen'Two-tone, land-ocean map with light green land areas and light blue water areas.Created using Natural Earth. |  |
'grayland'Two-tone, land-ocean map with gray land areas and white water areas.Created using Natural Earth. |
 |
'darkwater'Two-tone, land-ocean map with light gray land areas and dark gray water areas. This basemap is installed with MATLAB.Created using Natural Earth. | 'none'Blank background that plots your data with a latitude-longitude grid, ticks, and labels. |
All basemaps except 'darkwater' require Internet access. The'darkwater' basemap is included with MATLAB.
If you do not have consistent access to the Internet, you can download the basemaps created using Natural Earth onto your local system by using the Add-On Explorer. The five high-zoom-level maps are not available for download. For more about downloading basemaps and changing the default basemap on your local system, see Access Basemaps for Geographic Axes and Charts.
The basemaps hosted by Esri update periodically. As a result, you might see differences in your visualizations over time.
Alignment of boundaries and region labels are a presentation of the feature provided by the data vendors and do not imply endorsement by MathWorks®.
Data Types: char | string
Source table containing the data to plot, specified as a table or timetable.
Visibility of the grid lines, specified as 'on' or'off', or the logical values 1 (true) or 0 (false).
Alternatively, you can toggle the visibility of the grid lines by using the grid function.
Data Types: logical | char | string
This property is read-only.
Latitude limits of the map, returned as a two-element vector of the form[latmin latmax]. Each element is in the range [–90, 90] degrees.
Change the latitude limits by using the geolimits function.
The latitude limits do not change when you resize the chart by resizing the window, except to adapt to changes in the aspect ratio of the map.
Example: [-85 85]
Data Types: double
This property is read-only.
Longitude limits of map, returned as a two-element vector of the form[lonmin lonmax].
Change the longitude limits by using the geolimits function.
The longitude limits do not change when you resize the chart by resizing the window, except to adapt to changes in the aspect ratio of the map.
Example: [-100 100]
Data Types: double
Center point of the map, specified as a two-element numeric vector of the form [center_latitude center_longitude], wherecenter_latitude is the latitude in degrees andcenter_longitude is the longitude in degrees. The latitude value must be in the range (–90, 90).
Data Types: single | double
Layout of the map, including the insets and decorations, specified as'normal' or 'maximized'.
| Value | Description | Illustration |
|---|---|---|
| 'normal' | Map is inset from the edges of the chart, as defined by itsOuterPosition property. The axes labels, ticks, and tick labels are visible. The title is visible, when specified. Legends, when present, appear outside and to the right of the map. | 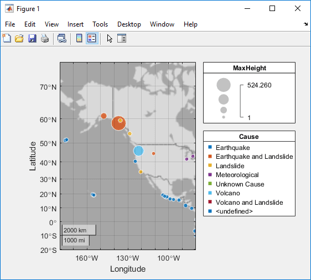 |
| 'maximized' | Map fills the entire space, as defined by theOuterPosition property. The axes labels, ticks, and tick labels are hidden. The title is hidden, even when specified. The grid is hidden, even when the GridVisible property has a value of 'on'. Legends, when present, appear within the map, toward the upper-right corner. | 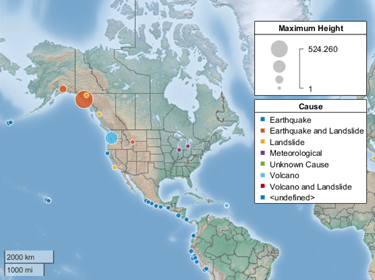 |
Data Types: char | string
Visibility of the scale bar on the map, specified as'on' or 'off', or the logical values 1 (true) or0 (false).
Data Types: logical | char | string
Zoom level of the map, specified as a numeric scalar in the range [0, 25]. The value is a base 2 logarithmic map scale. Increasing theZoomLevel value by 1 doubles the map scale.
Data Types: single | double
Position
Position property to hold constant when adding, removing, or changing decorations, specified as one of the following values:
"outerposition"— TheOuterPositionproperty remains constant when you add, remove, or change decorations such as a title or an axis label. If any positional adjustments are needed, MATLAB adjusts theInnerPositionproperty."innerposition"— TheInnerPositionproperty remains constant when you add, remove, or change decorations such as a title or an axis label. If any positional adjustments are needed, MATLAB adjusts theOuterPositionproperty.
Note
Setting this property has no effect when the parent container is aTiledChartLayout object.
Outer size and location, including the labels and legends, specified as a four-element vector of the form [left bottom width height]. By default, MATLAB measures the values in units normalized to the parent container. To change the units, set the Units property. The default value of [0 0 1 1] includes the whole interior of the container.
- The
leftandbottomelements define the distance from the lower-left corner of the container to the lower-left corner of the geographic bubble chart. - The
widthandheightelements are the dimensions of the geographic bubble chart, including a margin for the surrounding labels and legends.
This figure shows the areas defined by theOuterPosition values (blue) and theInnerPosition values (red).

Note
Setting this property has no effect when the parent container is aTiledChartLayout object.
Inner size and location, excluding the labels and legends, specified as a four-element vector of the form [left bottom width height]. By default, MATLAB measures the values in units normalized to the parent container. To change the units, set the Units property.
- The
leftandbottomelements define the distance from the lower-left corner of the container to the lower-left corner of the geographic bubble chart. - The
widthandheightelements are the dimensions of the geographic bubble chart, excluding the labels and legends.
This figure shows the areas defined by theOuterPosition values (blue) and theInnerPosition values (red).
Note
Setting this property has no effect when the parent container is aTiledChartLayout object.
Size and location, excluding the labels and legends, specified as a four-element vector of the form [left bottom width height]. This property is equivalent to theInnerPosition property.
Note
Setting this property has no effect when the parent container is aTiledChartLayout object.
Position units, specified as one of these values.
| Units | Description |
|---|---|
| 'normalized' (default) | Normalized with respect to the container, which is typically the figure or a panel. The lower left corner of the container maps to (0,0), and the upper right corner maps to(1,1). |
| 'inches' | Inches |
| 'centimeters' | Centimeters |
| 'characters' | Based on the defaultUIControl font of the graphics root object: Character width = width of letterx.Character height = distance between the baselines of two lines of text. |
| 'points' | Typography points. One point equals 1/72 of an inch. |
| 'pixels' | Pixels.On Windows® and Macintosh systems, the size of a pixel is 1/96th of an inch. This size is independent of your system resolution.On Linux® systems, the size of a pixel is determined by your system resolution. |
When specifying the units using a name-value argument during object creation, you must set the Units property before specifying the properties that you want to use these units, such asOuterPosition.
Layout options, specified as a TiledChartLayoutOptions orGridLayoutOptions object. This property is useful when the chart is either in a tiled chart layout or a grid layout.
To position the chart within the grid of a tiled chart layout, set theTile and TileSpan properties on theTiledChartLayoutOptions object. For example, consider a 3-by-3 tiled chart layout. The layout has a grid of tiles in the center, and four tiles along the outer edges. In practice, the grid is invisible and the outer tiles do not take up space until you populate them with axes or charts.

This code places the chart c in the third tile of the grid.
To make the chart span multiple tiles, specify the TileSpan property as a two-element vector. For example, this chart spans 2 rows and 3 columns of tiles.
c.Layout.TileSpan = [2 3];
To place the chart in one of the surrounding tiles, specify theTile property as "north","south", "east", or "west". For example, setting the value to "east" places the chart in the tile to the right of the grid.
To place the chart into a layout within an app, specify this property as aGridLayoutOptions object. For more information about working with grid layouts in apps, see uigridlayout.
If the chart is not a child of either a tiled chart layout or a grid layout (for example, if it is a child of a figure or panel) then this property is empty and has no effect.
Visibility of the geographic bubble chart, specified as'on' or 'off', or as numeric or logical 1 (true) or0 (false). A value of'on' is equivalent to true, and'off' is equivalent to false. Thus, you can use the value of this property as a logical value. The value is stored as an on/off logical value of type matlab.lang.OnOffSwitchState.
Parent/Child
Parent container, specified as a Figure,Panel, Tab,TiledChartLayout, or GridLayout object.
Version History
Introduced in R2017b
The "streets-light", "streets-dark", "streets", and "topographic" basemaps hosted by Esri have an improved visual appearance at high zoom levels. For example, this image compares a basemap at zoom level 21 in R2023a with the same basemap and zoom level in R2023b.

The basemaps can also have different appearances at other zoom levels. For example, this image compares a basemap at zoom level 15 in R2023a with the same basemap and zoom level in R2023b.

Starting in R2020a, setting or getting ActivePositionProperty is not recommended. Use the PositionConstraint property instead.
There are no plans to remove ActivePositionProperty at this time, but the property is no longer listed when you call the set,get, or properties functions on the chart object.
To update your code, make these changes:
- Replace all instances of
ActivePositionPropertywithPositionConstraint. - Replace all references to the
"position"option with the"innerposition"option.