gplot - Plot nodes and edges in adjacency matrix - MATLAB (original) (raw)
Plot nodes and edges in adjacency matrix
Syntax
Description
gplot([A](#mw%5F9d797f8a-80f5-4096-8fa4-1f97b2c36303),[XYCoords](#mw%5F5fc2f29c-2d8a-4278-ad8f-17132f3bf9a8)) plots a graph of the nodes and edges defined in the adjacency matrix A at the coordinates specified in XYCoords. The adjacency matrixA is an n-by-n matrix, wheren is the number of nodes. XYCoords is ann-by-2 matrix specifying_xy_-coordinates for each node.
gplot([A](#mw%5F9d797f8a-80f5-4096-8fa4-1f97b2c36303),[XYCoords](#mw%5F5fc2f29c-2d8a-4278-ad8f-17132f3bf9a8),[LineSpec](#f23-268532%5Fsep%5Fmw%5F3a76f056-2882-44d7-8e73-c695c0c54ca8)) additionally uses LineSpec to specify the line type, marker symbol, and color to use in the plot. For example, gplot(A,XY,'r-*') uses red lines for edges and red asterisks for nodes.
[[x](#mw%5Fa66e1414-bd9e-4fba-8731-b444297bc5f8),[y](#mw%5Fa66e1414-bd9e-4fba-8731-b444297bc5f8)] = gplot([A](#mw%5F9d797f8a-80f5-4096-8fa4-1f97b2c36303),[XYCoords](#mw%5F5fc2f29c-2d8a-4278-ad8f-17132f3bf9a8)) returns the NaN-delimited vectors x andy without generating a plot. Use x andy to generate a plot at a later time usingplot(x,y).
Examples
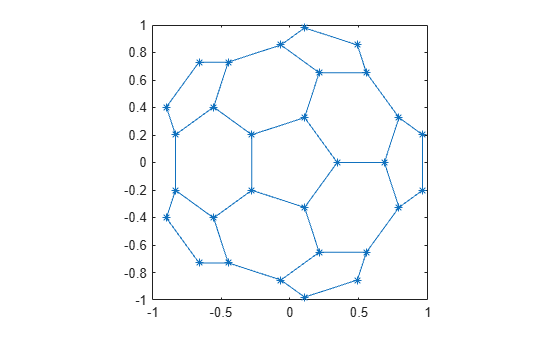
Plot Graph of Nodes Using Asterisks
Plot half of the carbon-60 molecule, placing asterisks at each node.
k = 1:30; [B,XY] = bucky; gplot(B(k,k),XY(k,[1 2]),'-*') axis square
Input Arguments
A — Adjacency matrix
matrix
Adjacency matrix, specified as a matrix. A describes the connections between the nodes in the graph by the location of nonzero values. If nodei and node j are connected, thenA(i,j) or A(j,i) is nonzero; otherwise,A(i,j) and A(j,i) are zero.
Example: A = ones(5) is the adjacency matrix of a graph with five nodes where each node is connected to all the others.
Example: A = [0 1 1 1; 1 0 0 0; 1 0 0 0; 1 0 0 0] is the adjacency matrix of a graph with four nodes where one node connects to the other three.
Data Types: single | double
XYCoords — _xy_-coordinates of nodes
N-by-2 matrix
_xy_-coordinates of nodes, specified as anN-by-2 matrix. Each row inXYCoords defines the coordinates for one node in the graph, soXYCoords(i,:) = [x(i) y(i)] gives the coordinates for nodei.
Example: XYCoords = [1 2; 3 4] plots one node at (1,2) and a second node at (3,4).
LineSpec — Line style, marker, and color
string scalar | character vector
Line style, marker, and color, specified as a string scalar or character vector containing symbols. The symbols can appear in any order. You do not need to specify all three characteristics (line style, marker, and color). For example, if you omit the line style and specify the marker, then the plot shows only the marker and no line.
Example: "--or" is a red dashed line with circle markers.
| Line Style | Description | Resulting Line |
|---|---|---|
| "-" | Solid line |  |
| "--" | Dashed line |  |
| ":" | Dotted line |  |
| "-." | Dash-dotted line |  |
| Marker | Description | Resulting Marker |
|---|---|---|
| "o" | Circle |  |
| "+" | Plus sign |  |
| "*" | Asterisk |  |
| "." | Point |  |
| "x" | Cross |  |
| "_" | Horizontal line |  |
| "|" | Vertical line |  |
| "square" | Square |  |
| "diamond" | Diamond |  |
| "^" | Upward-pointing triangle |  |
| "v" | Downward-pointing triangle |  |
| ">" | Right-pointing triangle |  |
| "<" | Left-pointing triangle |  |
| "pentagram" | Pentagram |  |
| "hexagram" | Hexagram |  |
| Color Name | Short Name | RGB Triplet | Appearance |
|---|---|---|---|
| "red" | "r" | [1 0 0] |  |
| "green" | "g" | [0 1 0] |  |
| "blue" | "b" | [0 0 1] |  |
| "cyan" | "c" | [0 1 1] |  |
| "magenta" | "m" | [1 0 1] |  |
| "yellow" | "y" | [1 1 0] |  |
| "black" | "k" | [0 0 0] |  |
| "white" | "w" | [1 1 1] |  |
Output Arguments
x, y — Node coordinates
vectors
Node coordinates, returned as vectors. x and y contain the same information as XYCoords, but in a different format that is suitable for plotting with the command plot(x,y). The line segments defined in x and y are separated withNaN values.
Tips
- Use graph and digraph objects to work with graph and network algorithms. You can visualize the networks with plot.
Version History
Introduced before R2006a