rendererinfo - Graphics renderer information - MATLAB (original) (raw)
Graphics renderer information
Syntax
Description
[info](#mw%5Fc72fdaa8-192f-4635-b463-945ae1240a49) = rendererinfo returns a structure containing the default renderer information for the current MATLAB® session.
[info](#mw%5Fc72fdaa8-192f-4635-b463-945ae1240a49) = rendererinfo([target](#mw%5F36b1928a-cec0-4ae0-a734-b6af57104f17)) returns a structure containing the renderer information for the target graphics object. Specify target as any type of axes or a standalone visualization. You can also specify an array of n axes or standalone visualizations, in which case info is returned as a 1-by-n structure array.
Examples
Default Renderer Information
Get the default renderer information for the current session.
info = struct with fields: GraphicsRenderer: 'OpenGL Software' Vendor: 'Brian Paul' Version: '2.1 Mesa 17.1.3' RendererDevice: 'Mesa X11' Details: [1x1 struct]
Information About Axes
Create a surface plot of the peaks function.
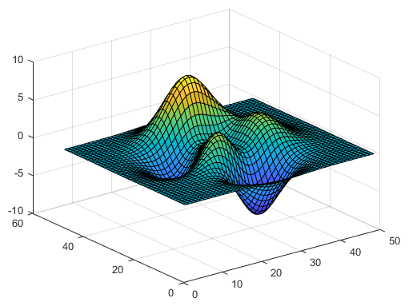
Get the current axes, and then get renderer information for the axes. Your system might return different information.
ax = gca; info = rendererinfo(ax)
info =
struct with fields:
GraphicsRenderer: 'OpenGL Hardware'
          Vendor: 'NVIDIA Corporation'
         Version: '4.6.0 NVIDIA 391.58'
  RendererDevice: 'Quadro P600/PCIe/SSE2'
         Details: [1×1 struct]
Get the driver details.
ans =
struct with fields:
       RendererDriverVersion: '23.21.13.9174'
   RendererDriverReleaseDate: '2018-6-4'
        HardwareSupportLevel: 'Full'
SupportsDepthPeelTransparency: 1
   SupportsAlignVertexCenters: 1
   SupportsGraphicsSmoothing: 1
              MaxTextureSize: 32768
          MaxFrameBufferSize: 32768
Information About Multiple Target Objects
Create a heatmap chart and a scatter plot in a figure.
tiledlayout(1,2) nexttile h = heatmap(rand(5)); ax1 = nexttile; scatter(ax1,1:10,rand(1,10))
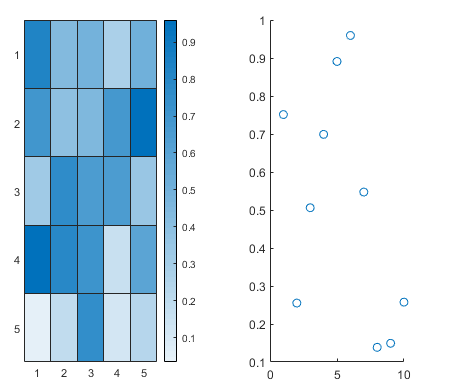
Get the renderer information for the heatmap chart and the parent axes of the scatter plot. In this case, info is an array that contains two structures.
info = rendererinfo([h ax1])
info =
1×2 struct array with fields:
GraphicsRenderer
Vendor
Version
RendererDevice
Details
Index into the array to get the renderer version for the heatmap chart. Your system might return different version information.
ans =
'4.6.0 NVIDIA 391.74'Input Arguments
target — Target object
axes | standalone visualization | array of axes or standalone visualizations
Target object, specified as one of the following:
- Any type of axes, such as an
Axes,PolarAxes, orGeographicAxesobject. - A standalone visualization, such as a heatmap.
- An array of axes, standalone visualizations, or a combination of them.
Output Arguments
info — Renderer information
structure
Renderer information, returned as a structure that contains information such as the name of the graphics renderer, vendor, and version. The Details field is a nested structure that contains additional details. Both the info structure and the info.Details structure are described in the tables below.
If you specify target as an array of n axes or standalone visualizations, info is returned as a 1-by-n structure array. Each structure in the array corresponds to an element oftarget.
Info Structure
All systems return these fields.
| Field | Description |
|---|---|
| GraphicsRenderer | Graphics renderer, returned as one of these values: 'OpenGL Hardware''OpenGL Software''MathWorks Painters''WebGL' |
| Vendor | Manufacturer of the graphics renderer implementation. |
| Version | Version of the graphics renderer implementation. |
| RendererDevice | Device that supports the graphics renderer. If you are using hardware-accelerated graphics, this field is the graphics card model name. |
| Details | Nested structure that contains additional details, such as the renderer's driver version. For the Painters renderer, this structure is empty. |
Details Structure
Some systems return a subset of these fields, depending on the graphics renderer. For the Painters renderer, the info.Details structure is empty.
| Field | Description |
|---|---|
| RendererDriverVersion | Version of the OpenGL® driver. This field displays only on Windows® systems running hardware-accelerated OpenGL. This field does not display on virtual machines. |
| RendererDriverReleaseDate | Release date of the OpenGL driver. This field displays only on Windows systems running hardware-accelerated OpenGL. This field does not display on virtual machines. |
| HardwareSupportLevel | Hardware support level, returned as one of these values: 'Full' — MATLAB uses graphics hardware as much as possible to provideadvanced graphics features. Most systems running hardware-accelerated OpenGL and WebGL™ return this value.'Basic' — MATLAB uses graphics hardware, but some features are disabled. Disabling graphics features is sometimes necessary to avoid graphics display issues.'None' — MATLAB does not use any graphics hardware. All systems running software OpenGL return this value. On some systems, software implementations of certain features might be supported.If MATLAB detects an unsupported driver, this field also contains'known graphics driver issues'. |
| SupportsDepthPeelTransparency | Depth peel transparency feature support, returned aslogical(1) if supported andlogical(0) otherwise. |
| SupportsAlignVertexCenters | Align vertex centers feature support, returned aslogical(1) if supported andlogical(0) otherwise. |
| SupportsGraphicsSmoothing | Graphics smoothing feature support, returned aslogical(1) if supported andlogical(0) otherwise. |
| MaxTextureSize | Maximum texture size that the renderer supports (in pixels). |
| MaxFrameBufferSize | Maximum frame buffer size that the renderer supports (in pixels). |
More About
Advanced Graphics Features
Advanced graphics features are features that require certain renderer implementations. These features are graphics smoothing, depth peel transparency, align vertex centers, and hardware-accelerated markers. You can tell whether your system supports some or all of these features by getting the value of the HardwareSupportLevel field of the info.Details structure.
This table lists the advanced graphics features and the circumstances under which they are supported. In some cases, certain features are supported, but they are disabled to avoid graphics display issues.
| Graphics Feature | Hardware OpenGL | Basic Hardware OpenGL | Software OpenGL on Windows | Software OpenGL on Linux® | WebGL |
|---|---|---|---|---|---|
| Graphics Smoothing | Supported for OpenGL 2.1 or higher | Supported for OpenGL 2.1 or higher | Not supported | Not supported | Supported |
| Depth Peel Transparency | Supported for OpenGL 2.1 or higher | Disabled | Not supported | Supported | Supported |
| Align Vertex Centers | Supported for OpenGL 2.1 or higher | Disabled | Not supported | Not supported | Supported |
| Hardware-accelerated markers | Supported for OpenGL 4.0 or higher | Disabled | Not supported | Not supported | Supported |
Graphics Smoothing
Graphics smoothing improves the appearance of plots by reducing jagged lines. By default, this feature is enabled if your system supports it. To turn off this feature for a particular figure, set the GraphicsSmoothing property of the figure to 'off'.
This table shows the difference when the feature is enabled or disabled.
| When Supported and Enabled | When Not Supported or Disabled |
|---|---|
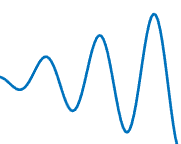 |
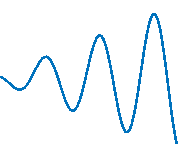 |
(Zoomed-in view)  |
(Zoomed-in view)  |
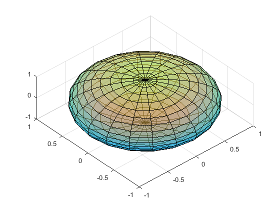
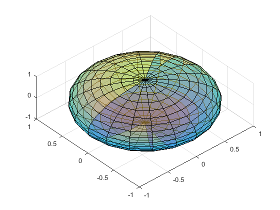
Depth Peel Transparency
Depth peel transparency is a feature for correctly drawing semitransparent 3-D objects or plots that contain intersecting semitransparent objects. In the table, the left image shows the result of using transparency on a sphere when the depth peel transparency feature is supported. The right image shows the same sphere with unexpected shaded areas that occur when the feature is not supported.
| When Supported | When Not Supported |
|---|---|
 |
 |
Align Vertex Centers
Align vertex centers is a feature for sharp vertical and horizontal lines. If graphics smoothing is enabled, horizontal and vertical lines might be uneven in thickness or color. The align vertex centers feature eliminates the uneven appearance. By default, the align vertex centers feature is not enabled. However, if your system supports this feature, then you can turn it on for objects that have anAlignVertexCenters property by setting the property to'on'.
This table shows the difference when the feature is enabled or disabled.
| When Supported and Enabled | When Not Supported or Disabled |
|---|---|
 |
 |
Hardware-Accelerated Markers
Hardware-accelerated markers take advantage of your graphics hardware for improved performance and quality. This table shows the difference when the feature is supported or not supported.
| When Supported | When Not Supported |
|---|---|
 |
 |
Tips
- Painters is an alternate rendering method for screen display and printing. For more information, see the Renderer property of the figure.
- By default, MATLAB tries to use hardware-accelerated graphics if your graphics hardware supports it. However, in some cases, MATLAB automatically switches to a software implementation if it detects one of these situations:
- You are using a graphics driver with known issues or graphics virtualization.
- A previous MATLAB session crashed due to a graphics issue. If the previous session was using software OpenGL and crashed, then subsequent sessions use a more stable version of software OpenGL that has fewer capabilities.
- Your system does not have the necessary graphics hardware.
Version History
Introduced in R2019a
R2022a: Added support for calling rendererinfo without input arguments
Call the rendererinfo function without any arguments to query the default graphics renderer information. This new syntax allows you to call the rendererinfo function in a way that is consistent with the opengl syntax.
R2019a: Recommended over opengl
rendererinfo can provide renderer information for a specific axes or standalone visualization, and it can report information about the WebGL renderer. The opengl function does not provide these features.