treeplot - Plot picture of tree - MATLAB (original) (raw)
Syntax
Description
treeplot([p](#mw%5Fb372aaa9-5a3e-4b65-9162-7241e17bad50)) plots one or more trees specified as a row vector of parent indices. p(i) = j indicates that nodej is a parent of node i, and p(i) = 0 indicates that node i is a root node.
treeplot([p](#mw%5Fb372aaa9-5a3e-4b65-9162-7241e17bad50),[NodeSpec](#mw%5F4b46217a-1ed4-45f8-a331-be1b404dce42),[EdgeSpec](#mw%5F6a2c86c9-8674-4cb5-a694-e27d41436e95)) sets the line style, marker symbol, and color for the nodes and edges in the tree plot. Use'' to omit the NodeSpec orEdgeSpec argument.
Examples
Plot Binary Tree
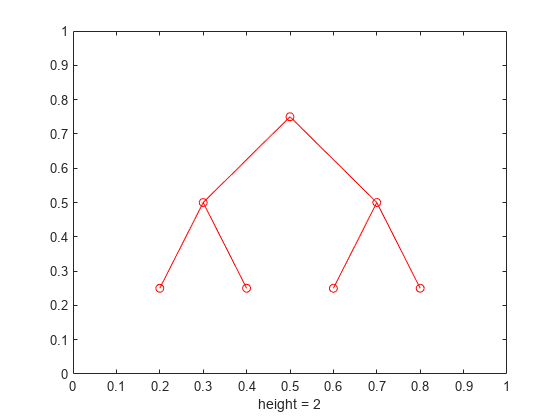
Plot a binary tree with 7 nodes.
Specify a row vector where each element contains the index of its parent node. Specify the root node with a value of 0. For example, specify the parent of node 1 as 2, the parent of node 2 as 4, the parent of node 3 as 2, and so on.
Plot the binary tree using treeplot.
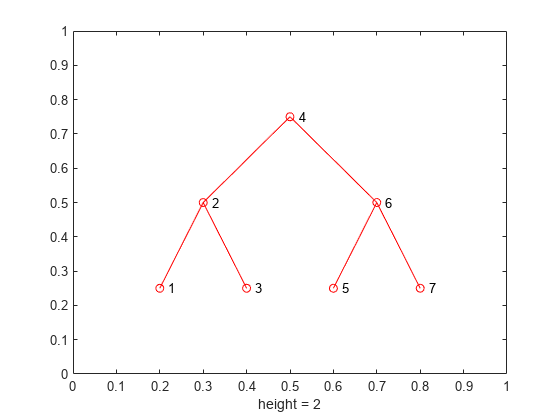
Generate the coordinates of the tree nodes using the treelayout function. Add text descriptions to show the node indices in the tree plot. Position the text labels 0.02 units to the right of their corresponding nodes.
[x,y] = treelayout(p); text(x + 0.02,y,{1,2,3,4,5,6,7})
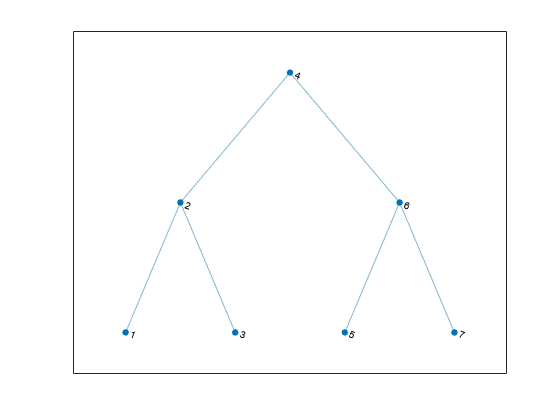
Another alternative to represent the tree structure is to use a digraph object. You can then visualize the structure with plot.
Create a digraph object using the syntax digraph(s,t) that specifies directed graph edges (s,t) in pairs. Visualize the tree with plot. Suppress the arrows from parent to child nodes by setting the ShowArrows option to false.
g = digraph(p(p~=0),find(p)); plot(g,"ShowArrows",false)
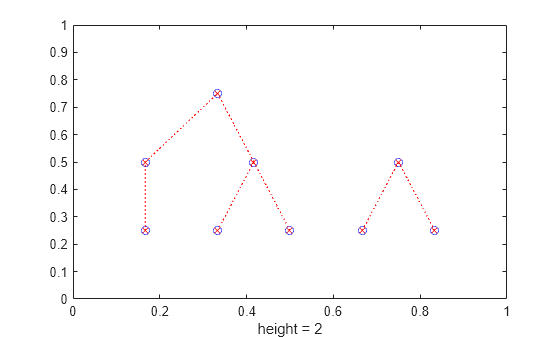
Specify Node and Edge Style in Tree Plot
Plot two trees. Specify node 1 and node 7 as root nodes by setting their parent indices to 0. Use blue circles for the nodes, and red-dotted lines with cross markers for the edges.
p = [0 1 1 2 3 3 0 7 7]; treeplot(p,'bo','rx:')
Input Arguments
p — Indices of parent nodes
row vector
Indices of parent nodes, specified as a row vector of positive integers less than or equal to length(p).
- If node
iis a root node, then specifyp(i)as0. - If node
ihas a parent node, then specifyp(i)as the parent of nodei.
Data Types: double
NodeSpec — Node marker and color
character vector | string
Node marker and color, specified as a character vector or string containing symbols. The symbols can appear in any order. You do not need to specify both marker and color. For example, if you specify the marker and omit the color, then the plot shows only the marker with the default red color.
Example: 'ob' represents circle markers with blue color
| Marker | Description |
|---|---|
| 'o' | Circle |
| '+' | Plus sign |
| '*' | Asterisk |
| '.' | Point |
| 'x' | Cross |
| '_' | Horizontal line |
| '|' | Vertical line |
| 's' | Square |
| 'd' | Diamond |
| '^' | Upward-pointing triangle |
| 'v' | Downward-pointing triangle |
| '>' | Right-pointing triangle |
| '<' | Left-pointing triangle |
| 'p' | Pentagram |
| 'h' | Hexagram |
| Color | Description |
|---|---|
| y | yellow |
| m | magenta |
| c | cyan |
| r | red |
| g | green |
| b | blue |
| w | white |
| k | black |
EdgeSpec — Edge style, marker, and color
character vector | string
Edge style, marker, and color, specified as a character vector or string containing symbols. The symbols can appear in any order. You do not need to specify all three characteristics (edge style, marker, and color). For example, if you omit the edge style and specify the marker, then the plot shows only the marker and no line.
Example: '--or' is a red dashed edge with circle markers
| Edge Style | Description |
|---|---|
| - | Solid line |
| -- | Dashed line |
| : | Dotted line |
| -. | Dash-dot line |
| Marker | Description |
|---|---|
| 'o' | Circle |
| '+' | Plus sign |
| '*' | Asterisk |
| '.' | Point |
| 'x' | Cross |
| '_' | Horizontal line |
| '|' | Vertical line |
| 's' | Square |
| 'd' | Diamond |
| '^' | Upward-pointing triangle |
| 'v' | Downward-pointing triangle |
| '>' | Right-pointing triangle |
| '<' | Left-pointing triangle |
| 'p' | Pentagram |
| 'h' | Hexagram |
| Color | Description |
|---|---|
| y | yellow |
| m | magenta |
| c | cyan |
| r | red |
| g | green |
| b | blue |
| w | white |
| k | black |
Tips
- Alternatively, use graph and digraph objects to work with graph and network algorithms. You can visualize the networks with plot.
Version History
Introduced before R2006a