Imaging of a glucose analog, calcium and NADH in neurons and astrocytes: dynamic responses to depolarization and sensitivity to pioglitazone (original) (raw)
. Author manuscript; available in PMC: 2012 Dec 1.
Published in final edited form as: Cell Calcium. 2011 Oct 5;50(6):548–558. doi: 10.1016/j.ceca.2011.09.002
Abstract
Neuronal Ca2+ dyshomeostasis associated with cognitive impairment and mediated by changes in several Ca2+ sources has been seen in animal models of both aging and diabetes. In the periphery, dysregulation of intracellular Ca2+ signals may contribute to the development of insulin resistance. In the brain, while it is well-established that type 2 diabetes mellitus is a risk factor for the development of dementia in the elderly, it is not clear whether Ca2+ dysregulation might also affect insulin sensitivity and glucose utilization. Here we present a combination of imaging techniques testing the disappearance of the fluorescent glucose analog 2-(N-(7-nitrobenz-2-oxa-1,3-diazol-4-yl)amino)-_2_-deoxyglucose (_2_-NBDG) as an indication of glycolytic activity in neurons and astrocytes. Our work shows that glucose utilization at rest is greater in neurons compared to astrocytes, and ceases upon activation in neurons with little change in astrocytes. Pretreatment of hippocampal cultures with pioglitazone, a drug used in the treatment of type 2 diabetes, significantly reduced glycolytic activity in neurons and enhanced it in astrocytes. This series of experiments, including FURA-2 and NADH imaging, provides results that are consistent with the idea that Ca2+ levels may rapidly alter glycolytic activity, and that downstream events beyond Ca2+ dysregulation with aging, may alter cellular metabolism in the brain.
1. Introduction
Because the brain must maintain intracellular ion homeostasis during long periods of synaptic communication and depolarization [1], it is believed that high levels of ATP synthesis are required, with the greatest consumption occurring during excitatory post-synaptic potentials [2]. Indeed, extracellular decreases in glucose are seen upon neuronal activation [3, 4]. Based on evidence demonstrating uncoupling between the two most predominant forms of ATP formation, namely glucose utilization and oxidative metabolism [5], Magistretti and Pellerin have proposed a brain model where glutamate released during action potentials activates glycolysis in surrounding astrocytes. Activated astrocytes then produce and provide lactate to neurons [6]. This astrocyte-neuron lactate shuttle hypothesis (ANLSH) is supported by evidence that both glucose and lactate are important energy substrates in neurons and astrocytes [6, 7]. Despite the popularity of this hypothesis, several points of controversy have emerged [reviewed in 7]. While the contribution of glucose and lactate to energetics in neurons and astrocytes is not a matter of debate, the degree to which each cell type obtains its energy from glucose at rest and during periods of activation is not clear.
It is apparent that in animal models of aging [8] and in several neurodegenerative diseases including Alzheimer’s disease (AD), some form of energetic dysregulation occurs. Positron emission tomography (PET) imaging has shown impaired energy metabolism to be correlated with decreased cognition in AD patients [9–11]. Moreover, in both the brain and the periphery, insulin insensitivity, a hallmark of type 2 diabetes mellitus (T2DM) is associated with an increased risk of AD and dementia [12–17]. Two research groups have recently shown beneficial effects of thiazolidinediones (TZDs) on memory function in early AD patients. The PPARγ-agonist rosiglitazone, a TZD effective in reestablishing peripheral insulin sensitivity in T2DM, has been shown to improve memory in patients with mild to moderate AD [18, 19]. Furthermore, in a recent pilot study, treatment with pioglitazone (another prescribed TZD) reduced cognitive decline in mild AD patients with T2DM [20]. There are several mechanisms by which TZDs could produce these beneficial effects, including increasing glucose utilization [21], modulating insulin signaling pathway [22], increasing glucose transporters – type 4 (GLUT4) [23, 24], modulating various Ca2+-related cellular processes [25, 26], reducing Aβ load [27–29], or suppressing inflammatory gene expression [30, 31]. Interestingly, data from adipocytes suggest that regulation of cellular insulin sensitivity is dependent on intracellular Ca2+ concentrations [32, 33]. The nature of this relationship, however, has not been investigated in the brain, where increased Ca2+dysregulation is considered a marker of brain aging that is well-correlated with cognitive impairment in animal models of brain aging [34–39].
Since the uptake of glucose is dependent on intracellular glucose utilization, several radio-labeled glucose analogs such as [14C] 2-deoxy-D-glucose, and [14C] or [3H] 3-O-methyl-D-glucose, have been used to indirectly measure glucose utilization using autoradiography methods. Unfortunately this and other approaches using positron emitting glucose analogs (i.e., [18F] fluoro-2-deoxy-D-glucose) in humans and primates do not provide sufficient spatial or temporal resolution for single cell analyses. However, a fluorescent glucose analog 2-(N-(7-nitrobenz-2-oxa-1,3-diazol-4-yl)amino)-2-deoxyglucose (2-NBDG) has been developed to allow real time measurement of glucose uptake in single cells [40]. This group was also able to combine 2-NBDG uptake measures with Ca2+ imaging in the same cell, using Fura-2, as a Ca2+ indicator. The glucose analog 2-NBDG has been shown to enter neurons and astrocytes through glucose transporters and to be subsequently phosphorylated by hexokinase and trapped inside cells [41]. Because 2-NBDG is a deoxyglucose derivative, the compound does not have the same biological activity as glucose and is not used by the cell. It has been suggested, however, that glycolysis favors intracellular degradation of 2-NBDG through oxydoreductases activated by NADH and ATP produced by glycolysis [42]. Recently, using dynamic uptake measures of a non-metabolized analog of this compound (6-NBDG) as well as newly developed glucose sensors, several studies have reported on the presence of greater glucose uptake/utilization in astrocytes compared to neurons during activation [43–46]. Here, we aimed to provide a complimentary approach for studies of glucose utilization in neurons and astrocytes during activation, by imaging the disappearance of the fluorescent glucose analog 2-NBDG. Based on the availability of these glucose imaging techniques, together with the paucity of studies linking Ca2+ dysregulation with glucose homeostasis in the brain, we also sought to determine the relationship between both variables in neurons and astrocytes.
Our studies had several goals designed to test the reliability of 2-NBDG disappearance as a direct indicator of glycolytic activity in single cells. Our first goal was to establish conditions necessary to test the function of 2-NBDG as a reporter of glucose metabolism inside single live hippocampal neurons and astrocytes. For this purpose, we examined the specificity of the signal with the glycolysis inhibitor iodoacetate, and also monitored oxidative metabolism using rotenone in combination with NADH imaging. Our second goal was to investigate the relationship between Ca2+ levels and glycolytic activity in these two cell types. Our third goal was to test whether the TZD pioglitazone (PIO) could modulate glucose utilization in neurons and astrocytes. Taken together, our results present a unique combination of methods developed for conventional microscopy to study dynamic changes in glycolysis in both neurons and astrocytes, while monitoring disappearance of 2-NBDG. We also provide the initial steps toward the development of applications for measures of glucose utilization in aged animals.
2. Methods
2.1. Cell cultures
Mixed (neuron/glia) hippocampal cultures were established from pregnant Sprague-Dawley rats as previously described [25, 47]. Hippocampi from E19 fetuses were removed and dissected in Hank’s balanced salt solution supplemented with 4.2 mM NaHCO3, 10mg/L gentamicin and 12 mM HEPES (pH 7.3). Tissue was placed in a trypsin containing solution (0.25% - Invitrogen Corp. Carlsbad, CA, USA; # 25200) for 11 min, then transferred to a supplemented minimum essential medium (SMEM) solution and triturated. SMEM was composed of MEM (Invitrogen #51200-038 - containing 5 mM glucose) and supplemented with L-glutamine (2 mM) and glucose (30 mM). One mL of the cell suspension was then added to one mL of the SMEM solution containing fetal bovine serum (10 %) and horse serum (10 %). Final cell concentration was approximately 5 × 10⁵ cells/mL. Cells were grown in a 35 mm poly-L-lysine-coated glass-bottom culture dishes (Mattek Corp., Ashland MA, USA). Dishes were maintained in an incubator (5% CO2, 36°C) until used at 12–18 days in vitro (DIV). On DIV 1, a half medium exchange was accomplished with horse-supplemented SMEM (10%). On DIV 6 another half medium exchange was accomplished using the same solution complemented this time with 100 μM FUDR and 200 μM Uridine. On DIV 12, 200 μL of 17 mM NaHCO3 in sterile water was added to the culture dish in order to maintain pH and limit evaporation. In some experiments, the high glucose-containing MEM (35 mM) was replaced with a lower glucose-containing MEM (5 mM) 24 h prior to imaging.
2.2. Solutions and indicator loading
The indicator loading solution contained (in mM) 145 NaCl, 2.5 KCl, 10 HEPES, 0.5 D-glucose, 2 CaCl2, 1 MgCl2, 0.01 glycine, pH 7.3. Culture dishes were incubated in the dark and at room air using this solution supplemented with 2 μM final Fura-2 AM, 0.085 % final DMSO, and 0.015 % final Pluronic F127 (Molecular Probes, Invitrogen). After 30 min, the solution was changed to an indicator-free solution. This solution was devoid of D-glucose to prevent transport competition between glucose and 2-NBDG (Invitrogen Corp., Carlsbad CA). In certain experiments (cells loaded with both Fura-2 and 2-NBDG), 2-NBDG (200 uM) was introduced for 5 min after the first 15 min of deesterification in zero glucose. After this 20 min Fura-2-AM deesterification/2-NBDG loading period, culture dishes were washed 3 times with the Ca2+ loading solution containing 10 mM D-glucose and were placed on the stage of the microscope. To test whether the 20 min period without glucose may have affected 2-NBDG loading differently in neurons and astrocytes, and to determine if longer 2-NBDG exposure (in the presence of glucose) may have reduced the difference in loading between these 2 cell types, co-cultures were kept in the incubator with 2-NBDG for 2–4 hours. While longer exposures increased resting 2-NBDG fluorescence in both cell types, astrocytes still showed reduced uptake compared to neurons. In 5 experiments (21 neurons and 12 astrocytes), the 2-NBDG signal in astrocytes was 36.4 % ± 10.8 of that seen in neurons (similar to Figure 1). All imaging experiments were accomplished on the stage of an epifluorescence microscope (E600FN; Nikon Inc., Melville, NY) and commenced within 5 min of the last wash. This period was used to permit sufficient efflux of non-phosphorylated 2-NBDG [48].
Figure 1.
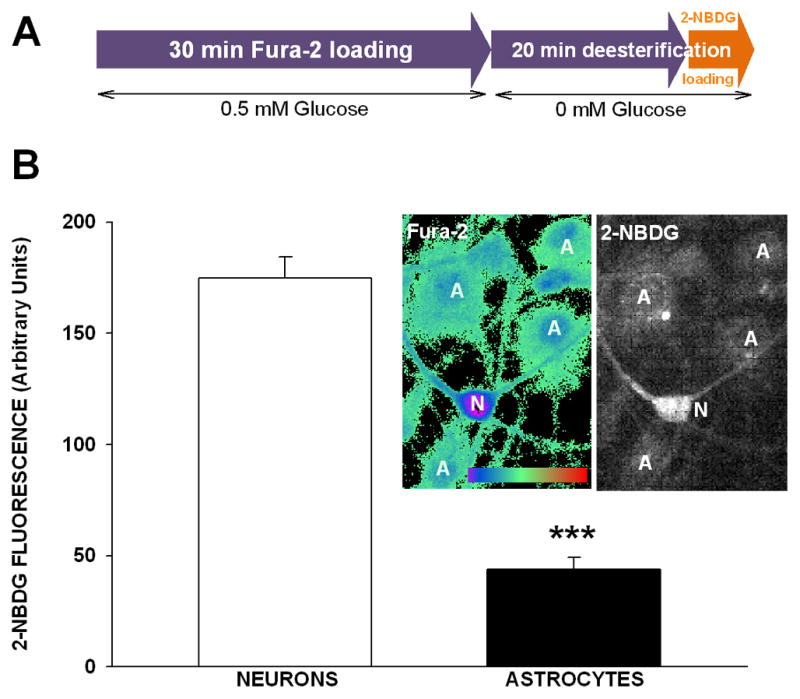
Calcium and glucose imaging in neurons and astrocytes in culture. (A) Timeline of the loading protocol used for Fura-2 (Ca2+ indicator) and 2-NBDG (fluorescent glucose analog). (B) 2-NBDG fluorescence intensity was significantly greater in neurons compared to astrocytes after a 5 min loading protocol (means ± SEM; n = 17–18; *** p < 0.0001, T-test). Photomicrograph shows ratiometric pseudocolor image of a pyramidal neuron (n) surrounded by several astrocytes (a). The same field of view showing 2-NBDG fluorescence in neurons and astrocytes is shown on the right.
2.3. Temperature control and perfusion system
All images were acquired with a 40 × immersion objective. For the 2-NBDG experiments we used an objective heater (HLS-1P, Cell Microcontrols, Norfolk VA), together with an inline heater (HPRE2, Cell Microcontrols) to maintain temperature at 32 °C (TC2bip, Cell Microcontrols). A homemade Plexiglas insert forming a small oval chamber in the center of the culture dish was used to restrict and maintain a constant flow of solutions through a gravity-fed delivery system. Constant suction on the opposite side of the chamber inlet was provided by vacuum to maintain solution flow and height. When drugs were delivered (i.e., glutamate, KCl, iodoacetate, rotenone), they were introduced into the imaging chamber through a port using a syringe pump (341B; Sage Instruments, Orion Research, Cambridge, MA) at a rate 1000 times slower than the gravity fed solution, resulting in a 1000 fold dilution in concentration. Because changes in NADH autofluorescence signals are relatively small, we switched to a static imaging setup combined with a rapid solution-exchange system (SF77A Warner Instruments Corp., Hamden, CT, USA) in order to better define the onset of events. The delivery system was placed ~75 μm above the cells and delivered either KCl (50 mM) or rotenone (0.1 μM) in pre-heated imaging solutions. Based on the short duration of these protocols (~200 s) and the use of an objective heater, the temperature drop was minimal.
2.4. Filters and Imaging
For Fura-2 ratiometric Ca2+ imaging, excitation of the fluorophore was provided by a high-speed filter changer (Lambda DG4, Sutter instruments) equipped with 340 ± 20 and 380 ± 20 nm exciter filters. Before being captured on an EMCCD camera (iXon - Andor Technology, Belfast, Ireland), emitted light was passed through a dichroic filter (~400 ηm high pass) and an emitter filter (520 ± 30 ηm, Chroma technology). No binning was employed and exposures of 500 ms were used. For 2-NBDG imaging we used an exciter centered at 475 ± 40 ηm, an emitter centered at 535 ± 45 ηm, and a dichroic mirror with a high-pass at ~505 ηm (Omega Optical; # XF100-2/E, Brattleboro, VT). Binning of the CCD (2×2) was used together with 300 ms exposures. For NADH autofluorescence imaging, excitation was provided by the 340 ± 20 ηm excitation filter, and the emitted light was passed through the ~400 ηm dichroic and a 420–480-emission filter (QMAX/EM420-480/25 Omega optical). To enhance the signal to noise ratio in these experiments, the images were acquired using the Electron Multiplying (EM) capabilities of the camera. The EM gain was set to 4095, the conventional gain was 4.4, and the exposure time was set at 3 s. No binning was employed.
2.5. Region of interest (ROI) and background subtraction
Analysis of single wavelengths was accomplished with the image acquisition software Imaging Workbench 5.0 (Indec BioSystems, Santa Clara, CA, USA). For all analyses the signal intensity averaged across the hand-drawn somatic area of each cell was subtracted by removing the average signal from an area adjacent to the cell imaged but devoid of cellular components. Because the 2-NBDG signal was dimmer than Fura-2 signals, we defined ROIs based on images captured during 340 nm excitation of the ratiometric calcium imaging pair. This approach allowed us to reliably identify glial cells from neuronal cells (based on morphology and grey values) and to transfer ROIs from the Fura-2 images to the 2-NBDG.
2.6. Calibration for ratiometric Ca2+ imaging
Ratios were converted to absolute Ca2+ levels using the following equation [Ca2+] = Kdβ (R-Rmin)/(Rmax-R) where R is the 340/380 emission ratio, and Rmin and Rmax represent ratios of the lowest and the highest standard Ca2+ concentration imaged (respectively). Calibration of the ratios was accomplished using a series of increasing free Ca2+ concentrations from 0 to 39 μM containing 1 mM Mg2+ (Invitrogen). Rmin, Rmax, and Kdβ were determined by fitting ratios from the calibration curve with a 4-term sigmoid function (SigmaPlot, Systat, Chicago, IL, USA), and were 0.29, 5.17, and 2.14 μM, respectively [49].
2.7. Imaging protocols
Two types of 2-NBDG imaging protocols were used. For the long duration protocol (Figs. 2, 3 and 6), a Fura-2 ratio and a 2-NBDG image were acquired consecutively every minute for the duration of the experiment (11–12 min). Data were acquired before, during, and after exposure to glutamate (100 μM) or KCl (50 mM). We used KCl-mediated depolarization in a subset of experiments to monitor the effects of an alternative challenge in neurons on glucose metabolism, also because glutamate is metabolically active, and finally, because we have shown previously that PIO could reduce NMDA-associated Ca2+ currents and levels. For the short duration protocol (Fig. 4), 2-NBDG images were acquired every 5 s for 3 min before, during and after application of KCl. For these experiments, Ca2+ ratios were obtained at the beginning of the experiment prior to stimulation with KCl. In a subset of experiments, cells were pretreated for 10 min with the glycolysis blocker iodoacetate (100 μM). This concentration was used because in cultured astrocytes, the drug was shown to selectively inhibit glycolysis [50]. No significant effect of iodoacetate was noted on intracellular resting [Ca2+] in the experiment with Fura-2 (Fig. 2C; 2-way ANOVA with Bonferroni post hoc p > 0.05). For the NADH imaging protocol (Fig. 5A) images were acquired every 5 s for 3 min before, during and after KCl. To test whether the decrease in 2-NBDG fluorescence was due to bleaching of the indicator during repetitive imaging, we performed several 2-NBDG imaging experiments in the absence of cells. 2-NBDG (100 μM) was imaged repeatedly in the zero glucose solution (see Solutions and indicator loading). Slopes of 2-NBDG fluorescence decrease were −0.47 ± 0.21 (n = 4) and −0.31 ± 0.12 (n = 4) for the long and short duration imaging protocols (respectively). Because bleaching levels appeared minimal, together with results showing nearly flat lines after glutamate or KCl, or under iodoacetate conditions, bleaching corrections were not applied. Because cell swelling during glutamate or KCl may induce dilution of intracellular indicator, artificially reducing 2-NBDG fluorescence [43], we monitored cell area changes in 13 neurons imaged before and after glutamate using the 340 ηm Fura-2 wavelength signal. As shown in prior studies [43, 45], results indicate glutamate did not significantly increase area (Pre: 0.247 ± 0.1 pixels2; Post: 0.250 ± 0.1 pixels2; p > 0.05).
Figure 2.

Calcium and glucose imaging in the same neuron. (A and B) Representative examples of 2-NDBG fluorescence changes (left axis, black circles), and Ca2+ changes (right axis, red triangles) taken in the same neuron. Data are presented under control conditions (CTRL- A, C and E) and in the presence of iodoacetate (100 μM- B, D and F). Arrow indicates the rapid decay in 2-NDBG fluorescence upon Ca2+ elevation. Iodoacetate eliminates this phase (B). Mean 2-NBDG fluorescence decrease over time (Δ 2-NBDG slope), is shown in C and D. In control conditions (CTRL), baseline slopes are reduced following a 3 min, 50 μM glutamate challenge (means ± SEM; n = 12–13; *** p < 0.001, ANOVA). Note that iodoacetate (D) reduces baseline glycolytic activity before the challenge (p < 0.01, Bonferroni _post-hoc_ test) and also eliminates the change in glycolytic activity in response to glutamate (p > 0.05, ANOVA). Glutamate causes a significant increase in Ca2+ (E and F) that is not reduced by iodoacetate pretreatment (means ± SEM; n = 12–13; *** p < 0.001, ANOVA).
Figure 3.

Calcium and glucose imaging in the same astrocyte. (A) Representative examples of 2-NDBG fluorescence changes (left axis, black circles), and Ca2+ changes (right axis, red triangles) taken in the same astrocyte. Because glutamate did not significantly reduce 2-NBDG fluorescence (A and B) after the insult (means ± SEM; n = 8; p > 0.05, ANOVA), data are only presented under control conditions (no iodoacetate). Mean 2-NBDG fluorescence decrease over time (Δ 2-NBDG slope), is shown in B and indicates that glycolytic activity is less in astrocytes compared to neurons (see Fig. 2C). Inset shows that glutamate causes a significant, albeit smaller increase in Ca2+ in astrocytes compared to neurons (means ± SEM; n = 12–13; *** p < 0.0001, T-test). Note that astrocyte resting Ca2+ is elevated compared to neurons (Fig. 2E, n = 8–12; p < 0.0001, T-test).
Figure 6.
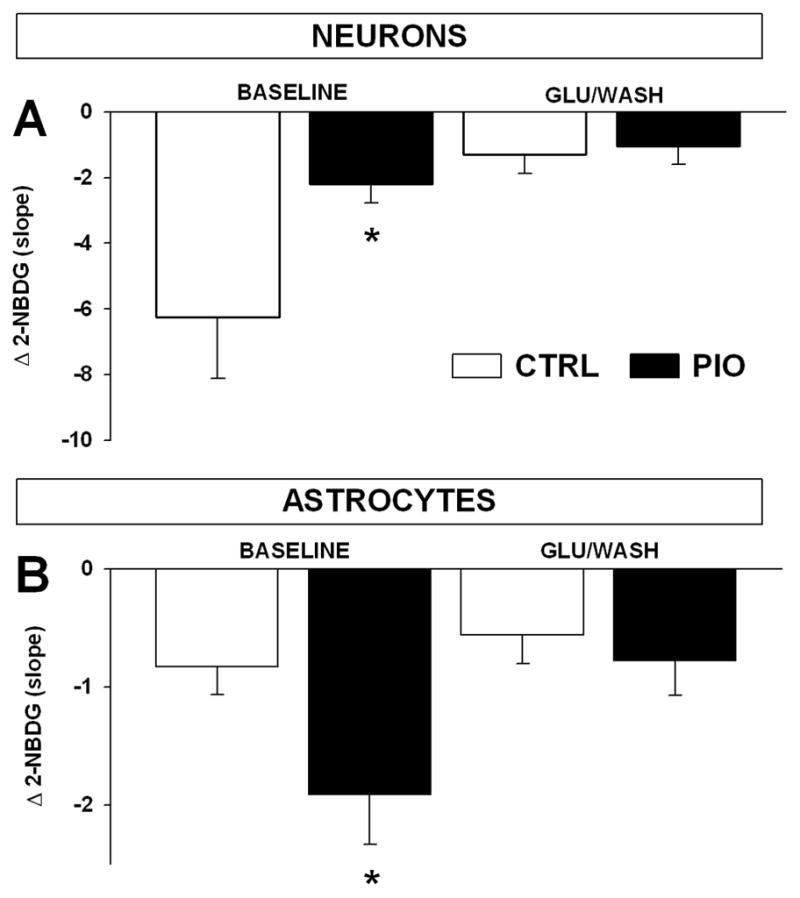
Pioglitazone pretreatment reduces glycolytic activity in neurons and increases it in astrocytes at rest. Glycolytic activity was monitored in neurons (A) and astrocytes (B) under control conditions (CTRL) and following a 24 hr, 10 μM pioglitazone treatment (PIO). (A) PIO significantly reduced baseline glucose utilization (before) but not stimulated (KCl/WASH) glycolytic activity in neurons (means ± SEM; n = 7–11 * p < 0.05, ANOVA). Similar quantitative data are shown in astrocytes (B), showing a significant increase in glycolytic activity in these cells at rest (means ± SEM; n = 6–7 * p > 0.05, ANOVA).
Figure 4.

Faster 2-NBDG imaging improves resolution of the immediate response to a depolarizing challenge. (A) Representative examples of 2-NBDG fluorescence changes in neurons under control (CTRL, white circles) and iodoacetate conditions (black circles). Depolarizing challenge for these experiments was 50 mM KCl. (B) Group mean data are presented and highlight a significant increase in glycolytic activity in response to KCl (### p < 0.001, Bonferroni post-hoc test) as well as the iodoacetate-mediated inhibition of the robust increase in this activity (means ± SEM; n = 9–11; *** p < 0.001, Bonferroni post-hoc test) during the immediate response to the KCl challenge.
Figure 5.

NADH imaging in neurons. (A) Phase contrast of a pyramidal neuron (left) and NADH autofluorescence imaging in the same neuron before (middle), and after KCl (50 mM-right). (B) A small yet significant decrease in NADH autofluorescence was seen in response to KCl (means ± SEM; n = 6; *** p < 0.001, T-test). (C) This decrease was entirely prevented by pretreatment of cultures with rotenone (0.1 μM, p > 0.05), highlighting the mitochondrial signature of these KCl-mediated changes
2.8. Statistics
Data analysis and slope calculations for the 2-NBDG fluorescence decrease were accomplished using Prism 5.0 (GraphPad Software, La Jolla, CA) and Microsoft Excel, respectively. For the long duration imaging protocols (Figs. 2, 3 and 6), a linear regression (slope) of the 2-NBDG fluorescence signal during baseline was compared to the same signal obtained during and after exposure to either glutamate or KCL using a 2-way ANOVA. For the short duration imaging protocols (Fig. 4), the slope of the fluorescence signal was calculated with the same regression analysis applied during baseline (40 ± 20 s), during the immediate response to KCl (11 ± 9 s), and in the last seconds of the experiment (34 ± 14 s). Here, a 2-way ANOVA with repeated measure was used. For comparisons of 2-NBDG fluorescence signals at rest in neurons vs. astrocytes (Fig. 1), as well as for comparison of slopes in NADH before and after KCl with or without rotenone, T-tests were used (paired in the case of NADH imaging). In these NADH experiments, signal intensities were normalized to baseline values (~ 50 s) and are reported as ΔF/F (%). Here, a paired T-test was used, comparing the averaged first 50 s of data with the last 50 s of the experiments (Fig. 5). Data from individual cells in the field of view (typically 2–4) were averaged such that each dish imaged was considered an experimental subject (n = 1). All data presented are means ± SEM. The results are based on imaging data obtained in nearly 380 cells including 259 neurons and 116 astrocytes. Data from individual cells were included in the analysis if baseline glycolysis rate was within two standard deviations from the group mean, and resting Ca2+ levels were < 200 ηM.
3. Results
3.1. 2-NBDG fluorescence/tracer loading in cells at rest
In this report, we describe a sensitive approach for the quantification of calcium and glucose analog changes inside the same cell. Figure 1A illustrates our dual indicator loading procedure, where cells are first loaded with Fura-2, followed by 2-NBDG. As previously described by others [48], we show that resting neurons display greater intracellular 2-NBDG fluorescence compared to neighboring astrocytes (Fig. 1B; p < 0.0001; T-test). Static baseline 2-NBDG fluorescence measures represent the sum of 2-NBDG uptake during the loading protocol, phosphorylation of the indicator by hexokinase, efflux of the non-phosphorylated product and trapping of the indicator inside the cell. Thus, higher glycolytic activity in astrocytes compared to neurons after the loading period could conceivably reduce the amount of fluorescent 2-NBDG present at the time of imaging. Similarly, decreased 2-NBDG uptake in astrocytes would also reduce baseline fluorescence. Evidence for similar hexokinase activity in these two cells types, together with evidence of higher glucose transporter activity in neurons compared to astrocytes [51–53], likely indicate that the lower 2-NBDG loading seen here is due to decreased uptake of the indicator during the 5 min loading period. Because prior work has shown that high glucose-containing media can reduce glucose oxidation rates in glial cells [54], we tested whether maintaining cultures in 5 mM glucose may increase glial and/or neuronal glucose uptake. Reducing glucose concentrations from 35 to 5 mM for 24 h lowered resting 2-NDBG fluorescence in neurons (~50 % reduction in indicator loading; p < 0.01; ANOVA, n = 4, data not shown). In astrocytes, this glucose substitution did not affect 2-NBDG loading (p > 0.05; ANOVA, n = 4, data not shown). These results indicate that, at least in neurons exposed 24 h to different levels of glucose, a dynamic relationship exists between substrate concentration and 2-NBDG loading. This process, linking glucose uptake to 2-NBDG loading was not seen, however, in astrocytes following the 24 h, 5 mM glucose substitution. It is clear, however, that the impact of glucose concentration on glucose uptake is different between these two cell types, and it does not appear that the low 2-NBDG fluorescence signal measured in astrocytes was due to the high glucose concentration in the culture medium.
3.2. Slow imaging protocols during glutamate challenges: 2-NBDG slope measures and Ca2+ imaging in the same cell
Figure 2 presents the results of dynamic glucose and Ca2+ imaging both at rest, and during stimulation with glutamate. The steady disappearance of 2-NBDG fluorescence prior to glutamate application was fit with a linear regression, yielding a negative slope across the 5 min baseline period (baseline slope Figs. 2A and 2C). Upon glutamate exposure, a transient increase in glycolytic activity was seen as a sudden disappearance in 2-NBDG fluorescence signal (arrow in Fig. 2A). This was followed by a flattening of the slope across the next 6 min (GLU/WASH slope in Figs. 2A and 2C). The slope of 2-NBDG degradation prior to glutamate stimulation was significantly higher than that seen after the stimulation (Fig. 2C, p < 0.0001, ANOVA). Pretreatment with the glycolysis inhibitor iodoacetate (Fig. 2B and 2D) reduced the baseline slope prior to glutamate activity (p < 0.001; ANOVA) and prevented the drop in 2-NBDG fluorescence in response to glutamate (Fig. 2D, p > 0.5; ANOVA). The initial rapid increase in glycolytic activity (arrow in Fig. 2A) coincided with a significant increase in intracellular Ca2+ (Fig. 2A right axis, red triangles, and 2E & F; p < 0.001; ANOVA). Iodoacetate pretreatment did not reduce resting Ca2+ levels or Ca2+ levels attained during glutamate exposure (Figs. 2E and F). These results indicate that transient Ca2+ elevations seem able to rapidly enhance, and then reduce glycolytic activity. A correlation analysis on cytosolic Ca2+ levels and rates of 2-NBDG disappearance in the same cells taken at rest show that greater Ca2+ levels are correlated with decreased glycolytic activity (p < 0.0001, r = 0.55; data not shown).
Based on the slopes of 2-NBDG fluorescence decrease taken during baseline, we observed that astrocytes displayed lower glycolytic rate when compared to neurons (Fig. 3B vs. Fig. 2C; p = 0.006, T-test). While astrocyte glycolytic activity seemed reduced by glutamate, only a trend for a decrease was measured (Fig. 3B; p = 0.09; T-test), and we did not quantify 2-NBDG fluorescence changes in iodoacetate conditions in these cells. It is interesting to note that compared to neurons, resting Ca2+ levels are elevated in astrocytes (p = 0.0034; T-test), and may contribute to reduced baseline glucose utilization at rest. We also observed that during the glutamate challenge, astrocytic Ca2+ levels were significantly reduced compared to levels seen in neurons (Fig. 3B inset vs. Fig 2E; p = 0.0054, T-test), and 2-NBDG fluorescence signal did not abruptly decrease in response to a glutamate challenge (p > 0.05). Because direct inhibition of glycolytic enzymes by Ca2+ has been shown in brain [55], it is possible that the lower Ca2+ levels attained during the glutamate challenge in astrocytes are not sufficient to impact glucose activity negatively. These results are nevertheless surprising, because the ANLSH predicts that glutamate should increase glycolytic activity in astrocytes [56]. To test whether the higher glucose in the culture medium (35 mM) may have had an impact on glucose utilization rates, we quantified glucose utilization (slopes) in cells maintained in 5 mM glucose media for 24 h. Under these lower glucose conditions, and in 4 experiments, neither baseline glycolytic activity (Δ 2-NBDG slope) nor the decrease in slope after glutamate exposure was significantly affected in either cell type (baseline neurons: − 1.78 ± 1.0; glu/wash neurons: 0.19 ± 0.8; baseline astrocytes: − 0.53 ± 0.5; glu/wash astrocytes: − 0.16 ± 0.4). Our results indicate that glycolytic activity is significantly greater in neurons compared to astrocytes, and that lowering available glucose for 24 h from 35 to 5 mM prior to 2-NBDG imaging does not alter metabolism in either cells.
3.3. Fast imaging protocols during KCL challenges: slope measures
To more precisely characterize the sudden decrease in 2-NBDG fluorescence upon depolarization (Fig. 2A, arrow) we increased image acquisition speed in a subset of experiments. Under these conditions, 2-NBDG fluorescence was monitored for 3 min including a 60 s baseline and a 2 min period during and after KCl (50 mM) stimulation. The increased temporal resolution in this set of experiments required shorter exposures precluding astrocyte data acquisition due to their dimmer fluorescence levels (Fig. 1B). Also, because image acquisition was set at 0.2 Hz, we could not switch to Fura-2 excitation and emission mirrors within this period and therefore, only 2-NBDG data are reported. As shown in Figure 4B, a sharp acceleration in 2-NBDG decrease was noted in response to KCl presentation, yielding increases in slopes with averages near -60 (p < 0.001, Bonferroni post-hoc test). This sharp increase in glucose utilization slope immediately following glutamate was significantly reduced by pretreatment with iodoacetate (Fig. 4A, p < 0.001; ANOVA).
3.4. NADH experiments
To test the hypothesis that 2-NBDG fluorescence decrease represents glycolytic activity which provides energy substrate to mitochondriae, we imaged NADH autofluorescence levels in response to KCl-induced depolarization in neurons. Under aerobic conditions, glycolytic activity provides substrates to the TCA cycle through the shuttling of acetyl-coA, a product of mitochondrial pyruvate dehydrogenase. Furthermore, NADH imaging is considered a robust indicator of metabolism in cells [57]. Thus, we aimed to identify the relationship between increases in glycolytic activity in response to KCl, and changes in NADH levels in the mitochondria. As ATP production is in series with glycolytic activity within a particular cell type, one would predict KCl should cause a decrease in NADH. As shown in Figure 5, NADH levels dropped rapidly in response to KCl (T-test, p < 0.001), coinciding in time with the sudden burst of glycolytic activity monitored with 2-NBDG fluorescence (Fig. 4). The mitochondrial nature of the NADH signal was investigated by pretreatment with rotenone, a complex I inhibitor which blocks electron transfer between NADH and ubiquinone [reviewed in 58]. Rotenone alone raised NADH levels significantly (p < 0.01; data not shown), and also prevented the KCL-mediated decrease in NADH (Fig. 5c; T-test, p > 0.05). Thus, it appears that the KCl-mediated decrease in NADH signal is of mitochondrial origin. Our work is consistent with reports in hippocampal slices showing that within the time frame used here (seconds), the NADH signals decrease (“NADH dip”) in synaptically-activated neurons prior to a delayed increase in NADH signal of astrocytic origin [59, 60].
3.5. Pioglitazone effects on neuronal and astrocytic glucose metabolism
We used KCl depolarization to investigate the impact of PIO on glycolytic activity before and after a depolarizing challenge in cultures maintained in the high glucose containing MEM. Because several labs have shown that TZDs can modulate glucose utilization differently in neurons and astrocytes [21, 61, 62], we tested whether PIO could regulate glucose metabolism in neurons and astrocytes. Using imaging protocols similar to those presented in figure 1 we show that PIO significantly reduced baseline glucose utilization in neurons (Fig. 6A; p < 0.05, ANOVA), and increased activity in astrocytes (Fig. 6B; p < 0.05; ANOVA). As shown before with a glutamate challenge (Figs. 2 and 3), 2-NBDG slopes were also reduced in neurons (p < 0.005; ANOVA) but not astrocytes (p > 0.05; ANOVA) in response to a KCl challenge. This was however, reversed by PIO treatment and in neurons treated with the TZD, KCl depolarization no longer reduced glycolytic activity (p>0.05; ANOVA). Similarly, in astrocytes treated with PIO, KCl significantly reduced glycolytic activity (p<0.05; ANOVA). Quantification of Ca2+ levels attained during baseline as well as during the KCl-mediated depolarization in 7 CTRL and 10 PIO culture dishes shows PIO had not significant effect on Ca2+ levels (F (1, 49) = 1.8; p = 0.23; RM ANOVA, data not shown). Similar results were seen in astrocytes (n = 7 CTRL and n = 6 PIO) with no effect of PIO on Ca2+ levels at rest or during KCl stimulation (F (1, 63) = 0.04; p = 0.85; RM ANOVA, data not shown). These results indicate that pioglitazone can modulate glycolytic activity at rest more so than during activation and are also consistent with prior reports investigating PIO’s effect on glycolysis in separated cultures of neurons or astrocytes [21, 62]. In these studies pioglitazone was clearly shown to enhance lactate oxidation in neurons [62], a mechanism which could underlie the reduced glycolytic activity seen here in neurons (Fig. 6A). Furthermore, and as reported here (Fig. 6B), pioglitazone was also shown to increase glucose consumption in astrocytes [21].
4. Discussion
We used 2-NBDG as an alternative tool to assess glycolysis in neurons and glia by measuring events downstream of 2-NBDG uptake. Our results indicate that glucose utilization differs substantially between these two cell types. In co-cultures, we found greater 2-NBDG loading in neurons compared to astrocytes. Further, based on the slope of 2-NBDG disappearance during resting conditions, our results suggest that neurons are undergoing comparatively greater levels of glucose utilization than astrocytes. Further, stimulation of cells with either glutamate or KCl to mimic an increase in network activity resulted in a reduction in 2-NBDG fluorescence in neurons, but was unchanged in astrocytes. These results may imply that glycolysis is sufficient to maintain basal neuronal function during quiescent states but that neurons may require an alternate source to supply energy demands during activity. Several lines of evidence appear to indicate that these changes in 2-NBDG fluorescence do indeed reflect different modes of glucose utilization by neurons and glia. Because cells were preloaded with 2-NBDG and the indicator was not present in the solution bathing the cells during imaging, it is unlikely that alterations in 2-NBDG fluorescence represent changes in uptake. Further, it is unlikely that the decrease in 2-NBDG fluorescence was due to efflux because the 5 min wait period prior to imaging should have allowed sufficient time for efflux of non-phosphorylated 2-NBDG [48]. Glucose extrusion rates also appear to be independent of either hexokinase product accumulation (in this case 2-NBDG-6P), or Na+-influx/depolarization [63]. Finally, in primary cortical neurons, glutamate causes a reduction in the levels and activity of phosphatase proteins (PP1, PP2A and PP2B) [64], reducing the likelihood that the change in 2-NBDG fluorescence upon stimulation is due to dephosphorylation of 2-NBDG-6P and subsequent efflux. Thus, it appears that the 2-NBDG fluorescence changes reported here, showing steady decreases at baseline (Figures 2,3,4, and 6) followed by a flattening of the response to glutamate, KCl or iodoacetate, may reflect changes in glucose utilization rather than changes in either indicator uptake or efflux.
4.1. 2-NBDG loading in neurons and glia
Glial cells displayed significantly less 2-NBDG fluorescence at rest compared to neurons (Fig. 1). One interpretation for this result is that glial cells are glycolytically hyperactive such that 2-NBDG is broken down faster than it can be taken up or extruded. Our data do not support this interpretation as we show here that baseline 2-NBDG fluorescence decreased at a slower rate in glia compared to neurons (Fig. 3). Furthermore, evidence suggests that hexokinase activity is not significantly different between neurons and glia [65, 66], and that the enzyme has a slower rate (rate-limiting step) compared to uptake and extrusion in neurons [63]. Another potential interpretation is that glial cells do not use 2-NBDG and that upon entering the cell, the glucose analog is readily transported out prior to being phosphorylated by hexokinase. Again, however evidence of similar hexokinase activity in these two cell types does not support this argument. It is possible that, being thinner veil-like structures [reviewed in 67], glial cells give the impression of being poorly loaded when imaged with an epifluorescence microscope. While this interpretation could conceivably address low 2-NBDG fluorescence in glial cells at rest, it is not compatible with the low rate of 2-NBDG disappearance we observed in glial cells, as changes in loading would not be expected to influence rates of fluorescence change for a non-buffering indicator.
An alternative interpretation for the lower 2-NBDG fluorescence at rest in astrocytes compared to neurons is that neurons take up glucose more readily than glial cells, resulting in higher 2-NBDG fluorescence. Based on kinetic data obtained in cerebellar granule cells in culture, higher transporter activity is seen in cells that express type 3 glucose transporters (GLUT3-neuronal) compared to cells that express type 1 transporters (GLUT1-glial) [51–53]. Corroborating evidence from other groups also shows decreased glucose uptake and metabolism in astrocytes compared to neurons [48, 68], perhaps because astrocytic glycogen can be mobilized readily in these cells [69, 70]. Furthermore, it has been shown that astroglia cultures maintained in media containing high glucose concentrations (> 25 mM) show suppressed oxidative metabolism [54]. Thus, when maintained under conditions using elevated glucose as those used here, glial cells could well show decreased glycolytic activity compared to neurons. Our attempt to increase 2-NBDG fluorescence in astrocytes by switching cells into lower glucose (5 mM) for 24 h, however, did not enhance indicator levels in astrocytes or neurons. In fact, reduced 2-NBDG loading was seen in neurons, and may well represent the obligatory dynamic uptake process present in cells.
4.2. Dynamic measures of glucose utilization (rates) and stimulated calcium levels
Examining the rates of 2-NBDG disappearance over time with Ca2+ imaging allowed us to monitor both variables in the same cell at rest (baseline) and in response to a depolarizing challenge. Previous reports in adipocytes [71, 72], and neurons [45] have shown negative correlations between measures of glucose uptake and intracellular Ca2+ levels. Consistent with this, we show that rapid elevations in Ca2+ are associated with equally fast decreases in glycolysis rates in neurons (Fig. 2). It is not clear, however, from our experiments whether calcium per se is able to mediate changes in glycolytic activity in neurons and astrocytes acutely. Recently, it has been shown that in hippocampal co-cultures, increased sodium influx either alone or in combination with Ca2+ during and following a glutamate challenge, decreases neuronal glucose uptake but increases astrocytic uptake [45, 73]. While we also report a decrease in glycolytic activity in neurons responding to a depolarization challenge, this was not the case for astrocytes. To determine if the difference in astrocyte metabolism might be due, at least in part, to glucose levels in the culture medium, we investigated the impact of maintaining cells in 5 mM glucose prior to measures of glucose utilization in response to a depolarizing challenge. This approach did not significantly alter glucose utilization rates in either cell type, therefore, differences in extracellular glucose levels are not likely the explanation for the divergence in results between our work and that of others [45]. It is also unclear if differences in cell types [74–78], the types of glucose transporters present, or the hormonal or temperature sensitivity of the system may contribute to the relationship between Ca2+ and glycolytic activity.
4.3. Sudden change in 2-NBDG fluorescence during activation: glycolytic burst
Coinciding with the onset of the Ca2+ rise during KCl- or glutamate-mediated depolarization, we show a significant drop in 2-NBDG fluorescence. This sudden decrease in 2-NBDG fluorescence (Fig. 4) may represent a burst of glycolytic activity. This hypothesis was supported by the observation that blocking glycolysis with iodoacetate reduced the steady rate of 2-NDBG disappearance at rest (baseline activity Fig. 2 and Fig. 4) as well as the sudden decrease in 2-NBDG fluorescence (Fig. 4). Based on our studies, it seems that glial cells do not exhibit a rapid burst of glycolytic activity. Together with evidence of small increases in Ca2+ seen in these cells (Fig. 3C), a reported decoupling between Ca2+ influx and production of reactive oxygen species [79], a propensity to mobilize glycogen [70], and a delayed glutamate-dependent lactate production [59], indicate that astrocytes likely depend on alternative energy sources. Irrespective of the results in glial cells, it is clear that glycolytic activity in neurons might be a more dynamic process able to respond on a second by second basis to changes in energy demands [44]. It is also clear that during baseline imaging periods, astrocytic glycolytic activity is much reduced compared to that seen in neurons (Fig. 3B vs. Fig. 2C).
4.4. Switch to alternative energy sources during activation
Our results suggest that glycolysis in neurons was significantly reduced following stimulation with glutamate or KCl, indicating a possible switch in energy source. We attempted to determine whether this shift was due to the production of mitochondrial ATP, derived from alternate but more readily available neuronal energy sources, or to the utilization of lactate as an energy substrate which may be more delayed. That is, lactate is first produced in astrocytes from glucose, then shuttled to the neuron, transformed into pyruvate and eventually enters the TCA cycle. Therefore, we monitored changes in mitochondrial NADH autofluorescence in response to depolarization to determine whether a possible burst of glycolysis in neurons induces either a rapid or a delayed activation of oxidative phosphorylation. We measured a rapid decrease in NADH autofluorescence upon activation suggestive of an immediate increase in complex I activity and ATP production within the neuron. These results are similar to studies showing a temporal separation in NADH fluorescence between neurons and astrocytes, whereby synaptic activation results in a rapid decrease in NADH autofluorescence in neurons [59, 60], and is followed by an overshoot in NADH in astrocytes (20–60 s later) [59]. The decrease in NADH autofluorescence reported here coincided with both an elevation in Ca2+ and a significant reduction in the rates of 2-NBDG signal disappearance in the same cell. Taken together, these results may provide support for the notion that the depolarization induced burst of glycolysis triggers oxidative phosphorylation within the neuron, alleviating the need for further glycolysis. Given the almost instantaneous decrease in NADH fluorescence and absence of a delayed increase in NADH fluorescence in neurons (i.e., from astrocyte-derived lactate), it would appear that astrocyte-derived lactate is not the preferred source of energy for neuronal mitochondria within the time frame associated with our experimental protocols.
4.5. Glucose dynamics in neurons and astrocytes
The enhanced glycolytic activity seen at rest in neurons compared to astrocytes was unexpected as several prior studies have reported opposite results [43–45, 80]. In order to better mimic interactions between neurons and glia, our experiments were accomplished in mixed cultures, however, those conditions only partially characterize in vivo settings as vascular, immune and other cellular components are lacking. Currently, almost all studies combining Ca2+ imaging with glucose or lactate utilization have used cultures and only two studies have used NBDG in vivo [44, 48]. Similar to our study, in one of these in vivo studies, glial cells took up less 2-NBDG than neurons [48] while the other showed no significant difference in fluorescence glucose uptake at rest between these 2 cell types. However a larger increase in fluorescent glucose uptake was seen in astrocytes during stimulation [44]. In other cell culture studies, greater 2- and 6-NBDG uptake was seen in astrocytes compared to neurons [45], and using glucose nanosensor technology in tissue slice cultures, the same group showed increased glycolysis in astrocytes during K+ exposure [43]. Further, while astrocytes appear able to respond to stressors with increases in glycolysis, it was recently shown that in cultures devoid of astrocytes, neurons fail to upregulate glycolysis during periods of stress [80].
Reconciling the differences seen between in vitro and in vivo settings will require additional experiments including how the duration and type of stimulus impacts the outcome. Indeed, it seems that in mixed cultures at least, a 5–20 min exposure to glutamate is needed to elicit increases in astrocytic glycolysis [43], while shorter glutamate exposures (as those used here) seem to cause inhibition of glycolytic activity in astrocytes. It appears that culture density and temperature are two variables that likely affect glucose uptake/metabolism as well as glucose compartmentalization. Cell proximity may also play a key role in the bioenergetic relationships between neurons and astrocytes, and activation of the ANLS may be somewhat decoupled in low density cultures (note that because our cultures are grown on glass to facilitate imaging, density may be somewhat reduced). This may indeed be important, as recent data show that K+ release from neurons may help stimulate glycolysis in astrocytes [43]. Still, it is surprising that increased glucose uptake and utilization would be seen in cells that are able to use and store glycogen readily for energy needs. Nevertheless, further studies are needed to clarify these issues and determine the nature of the relationship between synaptic depolarization/activation and rates of glycolysis in neurons and astrocytes, particularly under in vivo conditions [44, 48].
4.6. PIO decreases glucose utilization in neurons and increases it in astrocytes
It has been suggested that TZDs improve metabolic homeostasis in the brain [21, 62, 81–84] as in the periphery [85, 86]. Several in vivo and in vitro studies have investigated whether PIO could impact glucose utilization in neuronal and astroglial cells [21, 61, 62]. While the effect does not appear to be directly mediated by increased GLUT1 mRNA expression, the presence of elevated lactate production in astrocyte cultures in response to PIO [21, 62] has been hypothesized to provide oxidative energy to neurons. However, these experiments were not conducted in co-cultures but rather on isolated neurons or glia. On the other hand, in vivo studies show that a 2-month PIO treatment may actually reduce glucose utilization in the brain [61]. Therefore, we sought to determine the impact of PIO on neuronal and astrocytic glucose utilization in co-culture conditions. We found that 24 h treatment with PIO reduced baseline glucose utilization in neurons and enhanced it in astrocytes. These results are consistent with prior studies that have reported on disparate effects of PIO in neurons and astrocytes. In these studies, the drug has been shown to cause an increase in lactate oxidation in neurons but not astrocytes with a concomitant increase in lactate production in both cell types [62]. PIO has also been shown to increase glucose uptake and metabolism in astrocytes [21], as well as decrease cerebral glucose utilization [61]. We interpret the parallels between these studies and our results as further evidence that our measures represent a potentially valid approach to measuring glycolysis, and that PIO by increasing glycolytic activity in astrocytes, provides lactate to neurons, thereby decreasing neuronal demands on glucose for energy.
4.7. Conclusion
Here, we used a relatively inexpensive imaging method with sufficient spatial and temporal resolution to monitor glycolytic activity and Ca2+ levels in neurons and astrocytes in response to stimulation. This technique does not require confocal microscopy, PET imaging, NMR spectroscopy, or cellular transfection of nanosensors, but instead can be accomplished with minimal investment in filter cubes and an epifluorescence microscope. Our work highlights the presence of events downstream of Ca2+ which can rapidly influence energy metabolism in these cells. This contrasts significantly with peripheral cells (i.e., fat and muscle), where large and sustained increases in Ca2+ levels (tens of minutes) are needed to impact glucose transporter function [32, 72]. The evidence that Ca2+ levels are elevated in aged hippocampal neurons [87], together with the results reported here linking Ca2+ elevations with decreases in bioenergetics, suggest that Ca2+ dyshomeostasis with age could have a negative impact on cellular energy metabolism. Given these findings, perhaps it is not surprising that a decrease in genes mediating glucose utilization, coupled with a shift toward the use of fatty acids as an alternative energy source, has been reported in hippocampal tissue from aged, cognitively impaired F344 rats [88]. Further, it is likely that one potential mechanism associated with the beneficial effects of intranasal insulin seen on cognition in the elderly [89, 90] could be to increase glucose availability with age, thereby overcoming the inhibitory effects of elevated Ca2+ on aerobic glycolysis. Alternatively, similar results could be achieved using pioglitazone to increase mitochondrial bioenergetics in neurons through an elevation in lactate production and glycolysis in astrocytes.
Acknowledgments
We wish to thank Ms. Jelena Popovid and Mr. Michael Bridges for their technical expertise and assistance with the culture preparations. We thank Dr. Patrick Sullivan (University of Kentucky, Spinal Cord and Brain Injury Research and Department of Anatomy and Neurobiology) for his gift of rotenone. We also would like to thank Drs. Piascik and Hadley (University of Kentucky, Department of Molecular and Biomedical Pharmacology) for their critical reading of the manuscript and helpful discussions. These studies were supported by grants AG029268, AG033649, NCRR-P20-RR15592, and a gift from the Neurosciences Education and Research Foundation.
Footnotes
Conflict of Interest: The authors declare that within the past 3 years, no financial of personal competing interests exist.
Publisher's Disclaimer: This is a PDF file of an unedited manuscript that has been accepted for publication. As a service to our customers we are providing this early version of the manuscript. The manuscript will undergo copyediting, typesetting, and review of the resulting proof before it is published in its final citable form. Please note that during the production process errors may be discovered which could affect the content, and all legal disclaimers that apply to the journal pertain.
Contributor Information
Tristano Pancani, Email: tristano.pancani@uky.edu.
Katie L. Anderson, Email: Katie.anderson2@uky.edu.
Nada M. Porter, Email: Nadap@email.uky.edu.
Olivier Thibault, Email: othibau@uky.edu.
References
- 1.Mata M, Fink DJ, Gainer H, Smith CB, Davidsen L, Savaki H, Schwartz WJ, Sokoloff L. Activity-dependent energy metabolism in rat posterior pituitary primarily reflects sodium pump activity. J Neurochem. 1980;34:213–5. doi: 10.1111/j.1471-4159.1980.tb04643.x. [DOI] [PubMed] [Google Scholar]
- 2.Alle H, Roth A, Geiger JR. Energy-efficient action potentials in hippocampal mossy fibers. Science. 2009;325:1405–8. doi: 10.1126/science.1174331. [DOI] [PubMed] [Google Scholar]
- 3.Hu Y, Wilson GS. Rapid changes in local extracellular rat brain glucose observed with an in vivo glucose sensor. J Neurochem. 1997;68:1745–52. doi: 10.1046/j.1471-4159.1997.68041745.x. [DOI] [PubMed] [Google Scholar]
- 4.McNay EC, Fries TM, Gold PE. Decreases in rat extracellular hippocampal glucose concentration associated with cognitive demand during a spatial task. Proc Natl Acad Sci U S A. 2000;97:2881–5. doi: 10.1073/pnas.050583697. [DOI] [PMC free article] [PubMed] [Google Scholar]
- 5.Fox PT, Raichle ME, Mintun MA, Dence C. Nonoxidative glucose consumption during focal physiologic neural activity. Science. 1988;241:462–4. doi: 10.1126/science.3260686. [DOI] [PubMed] [Google Scholar]
- 6.Pellerin L, Magistretti PJ. Glutamate uptake into astrocytes stimulates aerobic glycolysis: a mechanism coupling neuronal activity to glucose utilization. Proc Natl Acad Sci U S A. 1994;91:10625–9. doi: 10.1073/pnas.91.22.10625. [DOI] [PMC free article] [PubMed] [Google Scholar]
- 7.Jolivet R, Allaman I, Pellerin L, Magistretti PJ, Weber B. Comment on recent modeling studies of astrocyte-neuron metabolic interactions. J Cereb Blood Flow Metab. 2010;30:1982–6. doi: 10.1038/jcbfm.2010.132. [DOI] [PMC free article] [PubMed] [Google Scholar]
- 8.Roberts EL, Jr, Chih CP. Age-related alterations in energy metabolism contribute to the increased vulnerability of the aging brain to anoxic damage. Brain Res. 1995;678:83–90. doi: 10.1016/0006-8993(95)00168-p. [DOI] [PubMed] [Google Scholar]
- 9.Rapoport SI. Coupled reductions in brain oxidative phosphorylation and synaptic function can be quantified and staged in the course of Alzheimer disease. Neurotox Res. 2003;5:385–98. doi: 10.1007/BF03033167. [DOI] [PubMed] [Google Scholar]
- 10.Salkovic-Petrisic M, Osmanovic J, Grunblatt E, Riederer P, Hoyer S. Modeling sporadic Alzheimer’s disease: the insulin resistant brain state generates multiple long-term morphobiological abnormalities including hyperphosphorylated tau protein and amyloid-beta. J Alzheimers Dis. 2009;18:729–50. doi: 10.3233/JAD-2009-1184. [DOI] [PubMed] [Google Scholar]
- 11.Mosconi L, De Santi S, Li J, Tsui WH, Li Y, Boppana M, Laska E, Rusinek H, de Leon MJ. Hippocampal hypometabolism predicts cognitive decline from normal aging. Neurobiol Aging. 2008;29:676–92. doi: 10.1016/j.neurobiolaging.2006.12.008. [DOI] [PMC free article] [PubMed] [Google Scholar]
- 12.Craft S, Peskind E, Schwartz MW, Schellenberg GD, Raskind M, Porte D., Jr Cerebrospinal fluid and plasma insulin levels in Alzheimer’s disease: relationship to severity of dementia and apolipoprotein E genotype. Neurology. 1998;50:164–8. doi: 10.1212/wnl.50.1.164. [DOI] [PubMed] [Google Scholar]
- 13.Ott A, Stolk RP, van Harskamp F, Pols HA, Hofman A, Breteler MM. Diabetes mellitus and the risk of dementia: The Rotterdam Study. Neurology. 1999;53:1937–42. doi: 10.1212/wnl.53.9.1937. [DOI] [PubMed] [Google Scholar]
- 14.Biessels GJ, Staekenborg S, Brunner E, Brayne C, Scheltens P. Risk of dementia in diabetes mellitus: a systematic review. Lancet Neurol. 2006;5:64–74. doi: 10.1016/S1474-4422(05)70284-2. [DOI] [PubMed] [Google Scholar]
- 15.de la Monte SM, Tong M, Lester-Coll N, Plater M, Jr, Wands JR. Therapeutic rescue of neurodegeneration in experimental type 3 diabetes: relevance to Alzheimer’s disease. J Alzheimers Dis. 2006;10:89–109. doi: 10.3233/jad-2006-10113. [DOI] [PubMed] [Google Scholar]
- 16.Gasparini L, Netzer WJ, Greengard P, Xu H. Does insulin dysfunction play a role in Alzheimer’s disease? Trends Pharmacol Sci. 2002;23:288–93. doi: 10.1016/s0165-6147(02)02037-0. [DOI] [PubMed] [Google Scholar]
- 17.Hoyer S. Glucose metabolism and insulin receptor signal transduction in Alzheimer disease. Eur J Pharmacol. 2004;490:115–25. doi: 10.1016/j.ejphar.2004.02.049. [DOI] [PubMed] [Google Scholar]
- 18.Watson GS, Cholerton BA, Reger MA, Baker LD, Plymate SR, Asthana S, Fishel MA, Kulstad JJ, Green PS, Cook DG, Kahn SE, Keeling ML, Craft S. Preserved cognition in patients with early Alzheimer disease and amnestic mild cognitive impairment during treatment with rosiglitazone: a preliminary study. Am J Geriatr Psychiatry. 2005;13:950–8. doi: 10.1176/appi.ajgp.13.11.950. [DOI] [PubMed] [Google Scholar]
- 19.Risner ME, Saunders AM, Altman JF, Ormandy GC, Craft S, Foley IM, Zvartau-Hind ME, Hosford DA, Roses AD. Efficacy of rosiglitazone in a genetically defined population with mild-to-moderate Alzheimer’s disease. Pharmacogenomics J. 2006;6:246–54. doi: 10.1038/sj.tpj.6500369. [DOI] [PubMed] [Google Scholar]
- 20.Sato T, Hanyu H, Hirao K, Kanetaka H, Sakurai H, Iwamoto T. Efficacy of PPAR-gamma agonist pioglitazone in mild Alzheimer disease. Neurobiol Aging. 2009 doi: 10.1016/j.neurobiolaging.2009.10.009. [DOI] [PubMed] [Google Scholar]
- 21.Dello Russo C, Gavrilyuk V, Weinberg G, Almeida A, Bolanos JP, Palmer J, Pelligrino D, Galea E, Feinstein DL. Peroxisome proliferator-activated receptor gamma thiazolidinedione agonists increase glucose metabolism in astrocytes. J Biol Chem. 2003;278:5828–36. doi: 10.1074/jbc.M208132200. [DOI] [PubMed] [Google Scholar]
- 22.Berger J, Moller DE. The mechanisms of action of PPARs. Annu Rev Med. 2002;53:409–35. doi: 10.1146/annurev.med.53.082901.104018. [DOI] [PubMed] [Google Scholar]
- 23.Grillo CA, Piroli GG, Hendry RM, Reagan LP. Insulin-stimulated translocation of GLUT4 to the plasma membrane in rat hippocampus is PI3-kinase dependent. Brain Res. 2009;1296:35–45. doi: 10.1016/j.brainres.2009.08.005. [DOI] [PMC free article] [PubMed] [Google Scholar]
- 24.Hauner H. The mode of action of thiazolidinediones. Diabetes Metab Res Rev. 2002;18(Suppl 2):S10–5. doi: 10.1002/dmrr.249. [DOI] [PubMed] [Google Scholar]
- 25.Pancani T, Phelps JT, Searcy JL, Kilgore MW, Chen KC, Porter NM, Thibault O. Distinct modulation of voltage-gated and ligand-gated Ca2+ currents by PPAR-gamma agonists in cultured hippocampal neurons. J Neurochem. 2009;109:1800–11. doi: 10.1111/j.1471-4159.2009.06107.x. [DOI] [PMC free article] [PubMed] [Google Scholar]
- 26.Zhao X, Ou Z, Grotta JC, Waxham N, Aronowski J. Peroxisome-proliferator-activated receptor-gamma (PPARgamma) activation protects neurons from NMDA excitotoxicity. Brain Res. 2006;1073–1074:460–9. doi: 10.1016/j.brainres.2005.12.061. [DOI] [PubMed] [Google Scholar]
- 27.Camacho IE, Serneels L, Spittaels K, Merchiers P, Dominguez D, De Strooper B. Peroxisome-proliferator-activated receptor gamma induces a clearance mechanism for the amyloid-beta peptide. J Neurosci. 2004;24:10908–17. doi: 10.1523/JNEUROSCI.3987-04.2004. [DOI] [PMC free article] [PubMed] [Google Scholar]
- 28.Combs CK, Johnson DE, Karlo JC, Cannady SB, Landreth GE. Inflammatory mechanisms in Alzheimer’s disease: inhibition of beta-amyloid-stimulated proinflammatory responses and neurotoxicity by PPARgamma agonists. J Neurosci. 2000;20:558–67. doi: 10.1523/JNEUROSCI.20-02-00558.2000. [DOI] [PMC free article] [PubMed] [Google Scholar]
- 29.Heneka MT, Sastre M, Dumitrescu-Ozimek L, Hanke A, Dewachter I, Kuiperi C, O’Banion K, Klockgether T, Van Leuven F, Landreth GE. Acute treatment with the PPAR{gamma} agonist pioglitazone and ibuprofen reduces glial inflammation and A{beta}1–42 levels in APPV717I transgenic mice. Brain. 2005 doi: 10.1093/brain/awh452. [DOI] [PubMed] [Google Scholar]
- 30.Landreth GE, Heneka MT. Anti-inflammatory actions of peroxisome proliferator-activated receptor gamma agonists in Alzheimer’s disease. Neurobiol Aging. 2001;22:937–44. doi: 10.1016/s0197-4580(01)00296-2. [DOI] [PubMed] [Google Scholar]
- 31.Heneka MT, Gavrilyuk V, Landreth GE, O’Banion MK, Weinberg G, Feinstein DL. Noradrenergic depletion increases inflammatory responses in brain: effects on IkappaB and HSP70 expression. J Neurochem. 2003;85:387–98. doi: 10.1046/j.1471-4159.2003.01694.x. [DOI] [PubMed] [Google Scholar]
- 32.Reusch JE, Begum N, Sussman KE, Draznin B. Regulation of GLUT-4 phosphorylation by intracellular calcium in adipocytes. Endocrinology. 1991;129:3269–73. doi: 10.1210/endo-129-6-3269. [DOI] [PubMed] [Google Scholar]
- 33.Draznin B, Sussman K, Kao M, Lewis D, Sherman N. The existence of an optimal range of cytosolic free calcium for insulin-stimulated glucose transport in rat adipocytes. J Biol Chem. 1987;262:14385–8. [PubMed] [Google Scholar]
- 34.Deyo RA, Straube KT, Disterhoft JF. Nimodipine facilitates associative learning in aging rabbits. Science. 1989;243:809–11. doi: 10.1126/science.2916127. [DOI] [PubMed] [Google Scholar]
- 35.Thibault O, Gant JC, Landfield PW. Expansion of the calcium hypothesis of brain aging and Alzheimer’s disease: minding the store. Aging Cell. 2007;6:307–17. doi: 10.1111/j.1474-9726.2007.00295.x. [DOI] [PMC free article] [PubMed] [Google Scholar]
- 36.Disterhoft JF, Thompson LT, Moyer JR, Jr, Mogul DJ. Calcium-dependent afterhyperpolarization and learning in young and aging hippocampus. Life Sci. 1996;59:413–20. doi: 10.1016/0024-3205(96)00320-7. [DOI] [PubMed] [Google Scholar]
- 37.Thibault O, Landfield PW. Increase in single L-type calcium channels in hippocampal neurons during aging. Science. 1996;272:1017–20. doi: 10.1126/science.272.5264.1017. [DOI] [PubMed] [Google Scholar]
- 38.Foster TC, Sharrow KM, Masse JR, Norris CM, Kumar A. Calcineurin links Ca2+ dysregulation with brain aging. J Neurosci. 2001;21:4066–73. doi: 10.1523/JNEUROSCI.21-11-04066.2001. [DOI] [PMC free article] [PubMed] [Google Scholar]
- 39.Toescu EC, Verkhratsky A. The importance of being subtle: small changes in calcium homeostasis control cognitive decline in normal aging. Aging Cell. 2007;6:267–73. doi: 10.1111/j.1474-9726.2007.00296.x. [DOI] [PubMed] [Google Scholar]
- 40.Yamada K, Nakata M, Horimoto N, Saito M, Matsuoka H, Inagaki N. Measurement of glucose uptake and intracellular calcium concentration in single, living pancreatic beta-cells. J Biol Chem. 2000;275:22278–83. doi: 10.1074/jbc.M908048199. [DOI] [PubMed] [Google Scholar]
- 41.Yoshioka K, Saito M, Oh KB, Nemoto Y, Matsuoka H, Natsume M, Abe H. Intracellular fate of 2-NBDG, a fluorescent probe for glucose uptake activity, in Escherichia coli cells. Biosci Biotechnol Biochem. 1996;60:1899–901. doi: 10.1271/bbb.60.1899. [DOI] [PubMed] [Google Scholar]
- 42.Natarajan A, Srienc F. Dynamics of glucose uptake by single Escherichia coli cells. Metab Eng. 1999;1:320–33. doi: 10.1006/mben.1999.0125. [DOI] [PubMed] [Google Scholar]
- 43.Bittner CX, Valdebenito R, Ruminot I, Loaiza A, Larenas V, Sotelo-Hitschfeld T, Moldenhauer H, San Martin A, Gutierrez R, Zambrano M, Barros LF. Fast and reversible stimulation of astrocytic glycolysis by k+ and a delayed and persistent effect of glutamate. J Neurosci. 2011;31:4709–13. doi: 10.1523/JNEUROSCI.5311-10.2011. [DOI] [PMC free article] [PubMed] [Google Scholar]
- 44.Chuquet J, Quilichini P, Nimchinsky EA, Buzsaki G. Predominant enhancement of glucose uptake in astrocytes versus neurons during activation of the somatosensory cortex. J Neurosci. 2010;30:15298–303. doi: 10.1523/JNEUROSCI.0762-10.2010. [DOI] [PMC free article] [PubMed] [Google Scholar]
- 45.Porras OH, Loaiza A, Barros LF. Glutamate mediates acute glucose transport inhibition in hippocampal neurons. J Neurosci. 2004;24:9669–73. doi: 10.1523/JNEUROSCI.1882-04.2004. [DOI] [PMC free article] [PubMed] [Google Scholar]
- 46.Barros LF, Courjaret R, Jakoby P, Loaiza A, Lohr C, Deitmer JW. Preferential transport and metabolism of glucose in Bergmann glia over Purkinje cells: a multiphoton study of cerebellar slices. Glia. 2009;57:962–70. doi: 10.1002/glia.20820. [DOI] [PubMed] [Google Scholar]
- 47.Porter NM, Thibault O, Thibault V, Chen KC, Landfield PW. Calcium channel density and hippocampal cell death with age in long-term culture. J Neurosci. 1997;17:5629–39. doi: 10.1523/JNEUROSCI.17-14-05629.1997. [DOI] [PMC free article] [PubMed] [Google Scholar]
- 48.Itoh Y, Abe T, Takaoka R, Tanahashi N. Fluorometric determination of glucose utilization in neurons in vitro and in vivo. J Cereb Blood Flow Metab. 2004;24:993–1003. doi: 10.1097/01.WCB.0000127661.07591.DE. [DOI] [PubMed] [Google Scholar]
- 49.Grynkiewicz G, Poenie M, Tsien RY. A new generation of Ca2+ indicators with greatly improved fluorescence properties. J Biol Chem. 1985;260:3440–50. [PubMed] [Google Scholar]
- 50.Schmidt MM, Dringen R. Differential effects of iodoacetamide and iodoacetate on glycolysis and glutathione metabolism of cultured astrocytes. Front Neuroenergetics. 2009;1:1. doi: 10.3389/neuro.14.001.2009. [DOI] [PMC free article] [PubMed] [Google Scholar]
- 51.Maher F, Davies-Hill TM, Lysko PG, Henneberry RC, Simpson IA. Expression of two glucose transporters, GLUT1 and GLUT3, in cultured cerebellar neurons: Evidence for neuron-specific expression of GLUT3. Mol Cell Neurosci. 1991;2:351–60. doi: 10.1016/1044-7431(91)90066-w. [DOI] [PubMed] [Google Scholar]
- 52.Maher F, Davies-Hill TM, Simpson IA. Substrate specificity and kinetic parameters of GLUT3 in rat cerebellar granule neurons. Biochem J. 1996;315 (Pt 3):827–31. doi: 10.1042/bj3150827. [DOI] [PMC free article] [PubMed] [Google Scholar]
- 53.Simpson IA, Carruthers A, Vannucci SJ. Supply and demand in cerebral energy metabolism: the role of nutrient transporters. J Cereb Blood Flow Metab. 2007;27:1766–91. doi: 10.1038/sj.jcbfm.9600521. [DOI] [PMC free article] [PubMed] [Google Scholar]
- 54.Abe T, Takahashi S, Suzuki N. Oxidative metabolism in cultured rat astroglia: effects of reducing the glucose concentration in the culture medium and of D-aspartate or potassium stimulation. J Cereb Blood Flow Metab. 2006;26:153–60. doi: 10.1038/sj.jcbfm.9600175. [DOI] [PubMed] [Google Scholar]
- 55.Benjamin AM, Verjee ZH. Control of aerobic glycolysis in the brain in vitro. Neurochem Res. 1980;5:921–34. doi: 10.1007/BF00966133. [DOI] [PubMed] [Google Scholar]
- 56.Magistretti PJ. Role of glutamate in neuron-glia metabolic coupling. Am J Clin Nutr. 2009;90:875S–880S. doi: 10.3945/ajcn.2009.27462CC. [DOI] [PubMed] [Google Scholar]
- 57.Shuttleworth CW. Use of NAD(P)H and flavoprotein autofluorescence transients to probe neuron and astrocyte responses to synaptic activation. Neurochem Int. 56:379–86. doi: 10.1016/j.neuint.2009.12.015. [DOI] [PMC free article] [PubMed] [Google Scholar]
- 58.Degli Esposti M. Inhibitors of NADH-ubiquinone reductase: an overview. Biochim Biophys Acta. 1998;1364:222–35. doi: 10.1016/s0005-2728(98)00029-2. [DOI] [PubMed] [Google Scholar]
- 59.Kasischke KA, Vishwasrao HD, Fisher PJ, Zipfel WR, Webb WW. Neural activity triggers neuronal oxidative metabolism followed by astrocytic glycolysis. Science. 2004;305:99–103. doi: 10.1126/science.1096485. [DOI] [PubMed] [Google Scholar]
- 60.Shuttleworth CW, Brennan AM, Connor JA. NAD(P)H fluorescence imaging of postsynaptic neuronal activation in murine hippocampal slices. J Neurosci. 2003;23:3196–208. doi: 10.1523/JNEUROSCI.23-08-03196.2003. [DOI] [PMC free article] [PubMed] [Google Scholar]
- 61.Galea E, Feinstein DL, Lacombe P. Pioglitazone does not increase cerebral glucose utilisation in a murine model of Alzheimer’s disease and decreases it in wild-type mice. Diabetologia. 2006;49:2153–61. doi: 10.1007/s00125-006-0326-0. [DOI] [PubMed] [Google Scholar]
- 62.Izawa Y, Takahashi S, Suzuki N. Pioglitazone enhances pyruvate and lactate oxidation in cultured neurons but not in cultured astroglia. Brain Res. 2009;1305:64–73. doi: 10.1016/j.brainres.2009.09.098. [DOI] [PubMed] [Google Scholar]
- 63.Whitesell RR, Ward M, McCall AL, Granner DK, May JM. Coupled glucose transport and metabolism in cultured neuronal cells: determination of the rate-limiting step. J Cereb Blood Flow Metab. 1995;15:814–26. doi: 10.1038/jcbfm.1995.102. [DOI] [PubMed] [Google Scholar]
- 64.Yi KD, Chung J, Pang P, Simpkins JW. Role of protein phosphatases in estrogen-mediated neuroprotection. J Neurosci. 2005;25:7191–8. doi: 10.1523/JNEUROSCI.1328-05.2005. [DOI] [PMC free article] [PubMed] [Google Scholar]
- 65.Lai JC, Behar KL, Liang BB, Hertz L. Hexokinase in astrocytes: kinetic and regulatory properties. Metab Brain Dis. 1999;14:125–33. doi: 10.1023/a:1020761831295. [DOI] [PubMed] [Google Scholar]
- 66.Rust RS, Jr, Carter JG, Martin D, Nerbonne JM, Lampe PA, Pusateri ME, Lowry OH. Enzyme levels in cultured astrocytes, oligodendrocytes and Schwann cells, and neurons from the cerebral cortex and superior cervical ganglia of the rat. Neurochem Res. 1991;16:991–9. doi: 10.1007/BF00965842. [DOI] [PubMed] [Google Scholar]
- 67.Theodosis DT, Poulain DA, Oliet SH. Activity-dependent structural and functional plasticity of astrocyte-neuron interactions. Physiol Rev. 2008;88:983–1008. doi: 10.1152/physrev.00036.2007. [DOI] [PubMed] [Google Scholar]
- 68.Takahashi S, Driscoll BF, Law MJ, Sokoloff L. Role of sodium and potassium ions in regulation of glucose metabolism in cultured astroglia. Proc Natl Acad Sci U S A. 1995;92:4616–20. doi: 10.1073/pnas.92.10.4616. [DOI] [PMC free article] [PubMed] [Google Scholar]
- 69.Brown AM, Ransom BR. Astrocyte glycogen and brain energy metabolism. Glia. 2007;55:1263–71. doi: 10.1002/glia.20557. [DOI] [PubMed] [Google Scholar]
- 70.DiNuzzo M, Mangia S, Maraviglia B, Giove F. Glycogenolysis in astrocytes supports blood-borne glucose channeling not glycogen-derived lactate shuttling to neurons: evidence from mathematical modeling. J Cereb Blood Flow Metab. 2010;30:1895–904. doi: 10.1038/jcbfm.2010.151. [DOI] [PMC free article] [PubMed] [Google Scholar]
- 71.Begum N, Leitner W, Reusch JE, Sussman KE, Draznin B. GLUT-4 phosphorylation and its intrinsic activity. Mechanism of Ca(2+)-induced inhibition of insulin-stimulated glucose transport. J Biol Chem. 1993;268:3352–6. [PubMed] [Google Scholar]
- 72.Draznin B, Lewis D, Houlder N, Sherman N, Adamo M, Garvey WT, LeRoith D, Sussman K. Mechanism of insulin resistance induced by sustained levels of cytosolic free calcium in rat adipocytes. Endocrinology. 1989;125:2341–9. doi: 10.1210/endo-125-5-2341. [DOI] [PubMed] [Google Scholar]
- 73.Porras OH, Ruminot I, Loaiza A, Barros LF. Na(+)-Ca(2+) cosignaling in the stimulation of the glucose transporter GLUT1 in cultured astrocytes. Glia. 2008;56:59–68. doi: 10.1002/glia.20589. [DOI] [PubMed] [Google Scholar]
- 74.Quintanilla RA, Porras OH, Castro J, Barros LF. Cytosolic [Ca(2+)] modulates basal GLUT1 activity and plays a permissive role in its activation by metabolic stress and insulin in rat epithelial cells. Cell Calcium. 2000;28:97–106. doi: 10.1054/ceca.2000.0135. [DOI] [PubMed] [Google Scholar]
- 75.Bihler I, Charles P, Sawh PC. Role of calcium in the regulation of sugar transport in the avian erythrocyte: effects of the calcium ionophore, A23187. Cell Calcium. 1982;3:243–62. doi: 10.1016/0143-4160(82)90004-5. [DOI] [PubMed] [Google Scholar]
- 76.Kitagawa K. Ca2+-dependent translocation of hexose carrier in mouse fibroblast Swiss 3T3 cells. Biochim Biophys Acta. 1987;928:272–81. doi: 10.1016/0167-4889(87)90186-8. [DOI] [PubMed] [Google Scholar]
- 77.Cheung JY, Constantine JM, Bonventre JV. Cytosolic free calcium concentration and glucose transport in isolated cardiac myocytes. Am J Physiol. 1987;252:C163–72. doi: 10.1152/ajpcell.1987.252.2.C163. [DOI] [PubMed] [Google Scholar]
- 78.Klip A, Li G, Logan WJ. Role of calcium ions in insulin action on hexose transport in L6 muscle cells. Am J Physiol. 1984;247:E297–304. doi: 10.1152/ajpendo.1984.247.3.E297. [DOI] [PubMed] [Google Scholar]
- 79.Kahlert S, Zundorf G, Reiser G. Glutamate-mediated influx of extracellular Ca2+ is coupled with reactive oxygen species generation in cultured hippocampal neurons but not in astrocytes. J Neurosci Res. 2005;79:262–71. doi: 10.1002/jnr.20322. [DOI] [PubMed] [Google Scholar]
- 80.Herrero-Mendez A, Almeida A, Fernandez E, Maestre C, Moncada S, Bolanos JP. The bioenergetic and antioxidant status of neurons is controlled by continuous degradation of a key glycolytic enzyme by APC/C-Cdh1. Nat Cell Biol. 2009;11:747–52. doi: 10.1038/ncb1881. [DOI] [PubMed] [Google Scholar]
- 81.Madrigal JL, Kalinin S, Richardson JC, Feinstein DL. Neuroprotective actions of noradrenaline: effects on glutathione synthesis and activation of peroxisome proliferator activated receptor delta. J Neurochem. 2007;103:2092–101. doi: 10.1111/j.1471-4159.2007.04888.x. [DOI] [PubMed] [Google Scholar]
- 82.Fuenzalida K, Quintanilla R, Ramos P, Piderit D, Fuentealba RA, Martinez G, Inestrosa NC, Bronfman M. Peroxisome proliferator-activated receptor gamma up-regulates the Bcl-2 anti-apoptotic protein in neurons and induces mitochondrial stabilization and protection against oxidative stress and apoptosis. J Biol Chem. 2007;282:37006–15. doi: 10.1074/jbc.M700447200. [DOI] [PubMed] [Google Scholar]
- 83.Hunter RL, Choi DY, Ross SA, Bing G. Protective properties afforded by pioglitazone against intrastriatal LPS in Sprague-Dawley rats. Neurosci Lett. 2008;432:198–201. doi: 10.1016/j.neulet.2007.12.019. [DOI] [PMC free article] [PubMed] [Google Scholar]
- 84.Sauerbeck A, Gao J, Readnower R, Liu M, Pauly JR, Bing G, Sullivan P. Pioglitazone attenuates mitochondrial dysfunction, cognitive impairment, cortical tissue loss, and inflammation following traumatic brain injury. Exp Neurol. doi: 10.1016/j.expneurol.2010.10.003. [DOI] [PMC free article] [PubMed] [Google Scholar]
- 85.el-Kebbi IM, Roser S, Pollet RJ. Regulation of glucose transport by pioglitazone in cultured muscle cells. Metabolism. 1994;43:953–8. doi: 10.1016/0026-0495(94)90173-2. [DOI] [PubMed] [Google Scholar]
- 86.Shimaya A, Kurosaki E, Shioduka K, Nakano R, Shibasaki M, Shikama H. YM268 increases the glucose uptake, cell differentiation, and mRNA expression of glucose transporter in 3T3-L1 adipocytes. Horm Metab Res. 1998;30:543–8. doi: 10.1055/s-2007-978929. [DOI] [PubMed] [Google Scholar]
- 87.Thibault O, Hadley R, Landfield PW. Elevated postsynaptic [Ca2+]i and L-type calcium channel activity in aged hippocampal neurons: relationship to impaired synaptic plasticity. J Neurosci. 2001;21:9744–56. doi: 10.1523/JNEUROSCI.21-24-09744.2001. [DOI] [PMC free article] [PubMed] [Google Scholar]
- 88.Rowe WB, Blalock EM, Chen KC, Kadish I, Wang D, Barrett JE, Thibault O, Porter NM, Rose GM, Landfield PW. Hippocampal expression analyses reveal selective association of immediate-early, neuroenergetic, and myelinogenic pathways with cognitive impairment in aged rats. J Neurosci. 2007;27:3098–110. doi: 10.1523/JNEUROSCI.4163-06.2007. [DOI] [PMC free article] [PubMed] [Google Scholar]
- 89.Benedict C, Hallschmid M, Schmitz K, Schultes B, Ratter F, Fehm HL, Born J, Kern W. Intranasal insulin improves memory in humans: superiority of insulin aspart. Neuropsychopharmacology. 2007;32:239–43. doi: 10.1038/sj.npp.1301193. [DOI] [PubMed] [Google Scholar]
- 90.Reger MA, Watson GS, Frey WH, 2nd, Baker LD, Cholerton B, Keeling ML, Belongia DA, Fishel MA, Plymate SR, Schellenberg GD, Cherrier MM, Craft S. Effects of intranasal insulin on cognition in memory-impaired older adults: modulation by APOE genotype. Neurobiol Aging. 2006;27:451–8. doi: 10.1016/j.neurobiolaging.2005.03.016. [DOI] [PubMed] [Google Scholar]