TOX is a critical regulator of tumour-specific T cell differentiation (original) (raw)
. Author manuscript; available in PMC: 2020 Nov 28.
Published in final edited form as: Nature. 2019 Jun 17;571(7764):270–274. doi: 10.1038/s41586-019-1324-y
Abstract
Tumour-specific CD8 T cell dysfunction is a differentiation state that is distinct from the functional effector or memory T cell states1–6. Here we identify the nuclear factor TOX as a crucial regulator of the differentiation of tumour-specific T (TST) cells. We show that TOX is highly expressed in dysfunctional TST cells from tumours and in exhausted T cells during chronic viral infection. Expression of TOX is driven by chronic T cell receptor stimulation and NFAT activation. Ectopic expression of TOX in effector T cells in vitro induced a transcriptional program associated with T cell exhaustion. Conversely, deletion of Tox in TST cells in tumours abrogated the exhaustion program: _Tox_-deleted TST cells did not upregulate genes for inhibitory receptors (such as Pdcd1, Entpd1, Havcr2, Cd244 and Tigit), the chromatin of which remained largely inaccessible, and retained high expression of transcription factors such as TCF-1. Despite their normal, ‘non-exhausted’ immunophenotype, _Tox-_deleted TST cells remained dysfunctional, which suggests that the regulation of expression of inhibitory receptors is uncoupled from the loss of effector function. Notably, although _Tox_-deleted CD8 T cells differentiated normally to effector and memory states in response to acute infection, _Tox_-deleted TST cells failed to persist in tumours. We hypothesize that the TOX-induced exhaustion program serves to prevent the overstimulation of T cells and activation-induced cell death in settings of chronic antigen stimulation such as cancer.
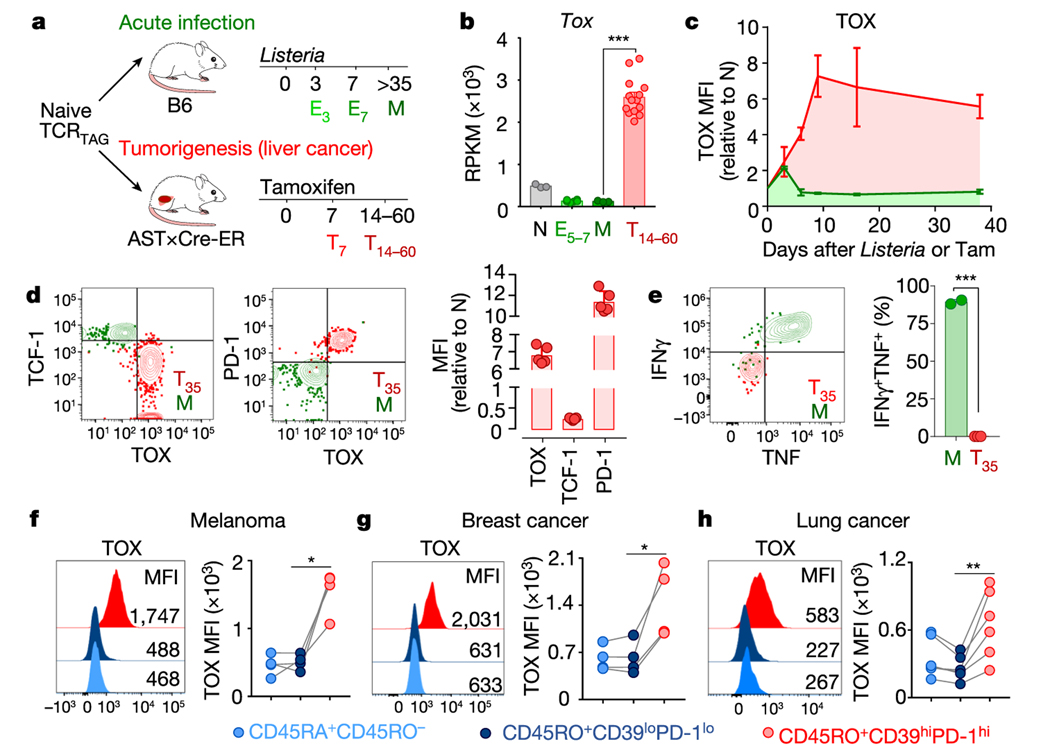
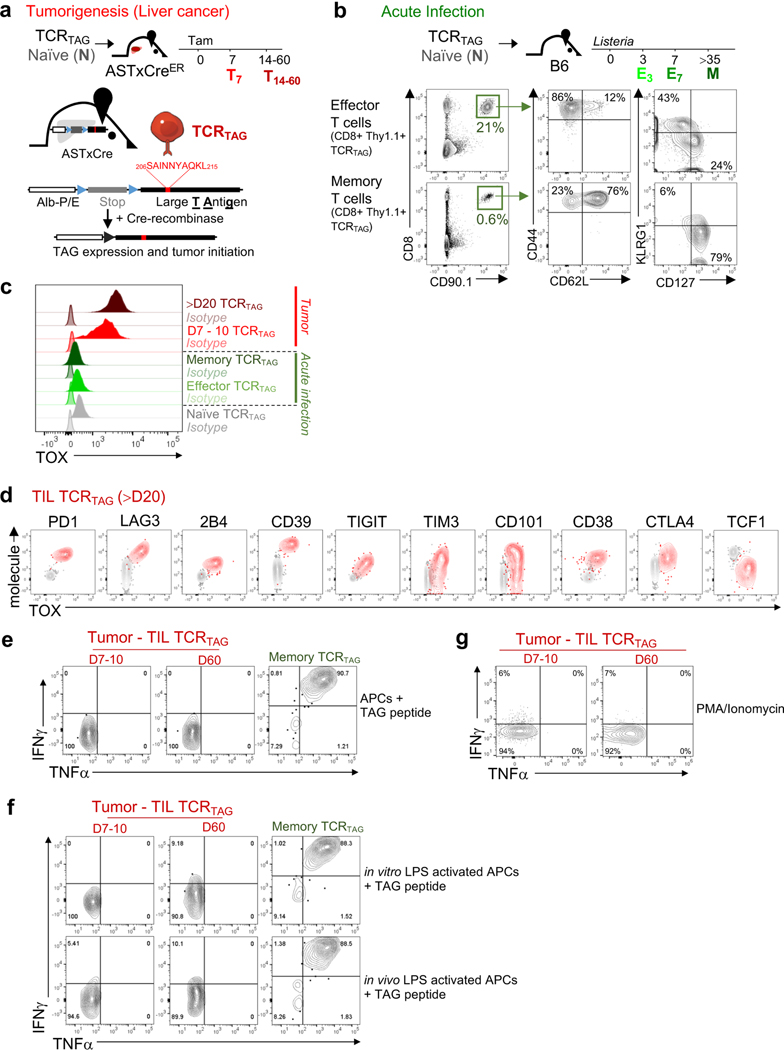
Using an inducible model of autochthonous liver cancer in which SV40 large T antigen (TAG) is the oncogenic driver and tumour-specific antigen7 (Fig. 1a and Extended Data Fig. 1a), we recently showed that CD8+ T cells expressing a restricted T cell receptor (TCR) specific for TAG (hereafter referred to as TCRTAG cells) differentiate to an epigenetically encoded dysfunctional state, exhibiting hallmarks of TST cell dysfunction including the expression of inhibitory receptors and loss of effector cytokines3,5. Numerous transcription factors were dysregulated in dysfunctional TCRTAG cells (such as NFAT, TCF-1, LEF1, IRF4 and BLIMP1) compared with functional effector or memory TCRTAG cells generated during acute infection with Listeria (using a recombinant Listeria monocytogenes strain that expressed TAG epitope I (_Lm_TAG))5. However, many of these transcription factors are also crucial for the development of normal effector and memory T cells8; thus, we set out to identify transcription factors that were specifically expressed in dysfunctional TCRTAG cells. We analysed our RNA sequencing (RNA-seq) data5 and found that the gene encoding the nuclear factor TOX was highly expressed in dysfunctional TCRTAG cells, but low in functional naive, effector and memory TCRTAG cells (Fig. 1b). TOX is a nuclear DNA-binding factor and a member of the high-motility group box superfamily that is thought to bind DNA in a sequence-independent but structure-dependent manner9. Although TOX is required during thymic development of CD4+ T lineage cells, natural killer and innate lymphoid cells10–12, and in regulating CD8 T cell-mediated autoimmunity13, its role in tumour-induced T cell dysfunction is unknown. To assess TOX expression during CD8 T cell differentiation in acute infection and tumorigenesis, congenically marked naive TCRTAG cells were transferred into (i) wild-type C57BL/6 (B6) mice immunized with _Lm_TAG, or (ii) tamoxifen-inducible liver cancer mice (AST×Cre-ERT2; AST denotes albumin-floxStop-SV40 large T antigen) treated with tamoxifen (Fig. 1a and Extended Data Fig. 1a, b). TOX was expressed at low levels early after Listeria infection but declined to baseline levels (by day 5 after infection) and remained low in memory T cells (Fig. 1c and Extended Data Figs. 1c, 2). By contrast, during tumour progression, TOX expression increased in TCRTAG cells and remained high (Fig. 1c and Extended Data Figs. 1c, 2). High expression of TOX correlated with high expression of several inhibitory receptors and low expression of TCF-1 (Fig. 1d and Extended Data Figs. 1d, 2b, c). Moreover, TOXexpressing TCRTAG cells failed to produce the effector cytokines IFNγ and TNF after stimulation ex vivo with cognate peptide or phorbol myristate acetate (PMA) and ionomycin (Fig. 1e and Extended Data Fig. 1e–g).
Fig. 1 |. TOX is highly expressed in tumour-infiltrating CD8 T cells of mouse and human tumours.
a, Experimental scheme for acute infection (green) and tumorigenesis (red). E3 and E7, effector cells isolated 3 and 7 days after immunization, respectively; M, memory cells; T7 and T14–60, T cells isolated from liver tumours at 7 and 14–60 days after transfer. b, Reads per kilobase of transcript per million mapped read (RPKM) values of Tox. n = 3 (naive (N), memory); n = 6 (E5–7); n = 14 (T14–60) TCRTAG cells isolated from liver tumour lesions of AST×Cre-ERT2 mice at 14, 21, 28, 35 and more than 60 days after transfer5. c, Expression levels of TOX protein in TCRTAG cells during Listeria infection (green) or tumorigenesis (red), assessed by flow cytometry at indicated time points with n = 2–3 mice. MFI, mean fluorescent intensity; Tam, tamoxifen. d, Expression of TOX, TCF-1 and PD-1 in TCRTAG cells isolated from liver tumour lesions 35 days after transfer (T35; red, _n_= 5); memory TCRTAG cells are shown as control (M; green). e, IFNγ and TNF production of memory TCRTAG cells (M; green, _n_= 2) and liver tumour-infiltrating TCRTAG cells (T; red, _n_= 3). Data are representative of more than five independent experiments. f–h, TOX expression in human tumour-infiltrating CD8+ T cells isolated from patients with melanoma (n = 4) (f), breast cancer (n = 4) (g), and lung cancer (n = 6) (h). Each symbol represents an individual mouse (for b–e) or individual patient (for f–h). Data are mean ± s.e.m. *P ≤ 0.05, **P ≤ 0.01, ***P ≤ 0.001, two-sided Student’s _t_-test.
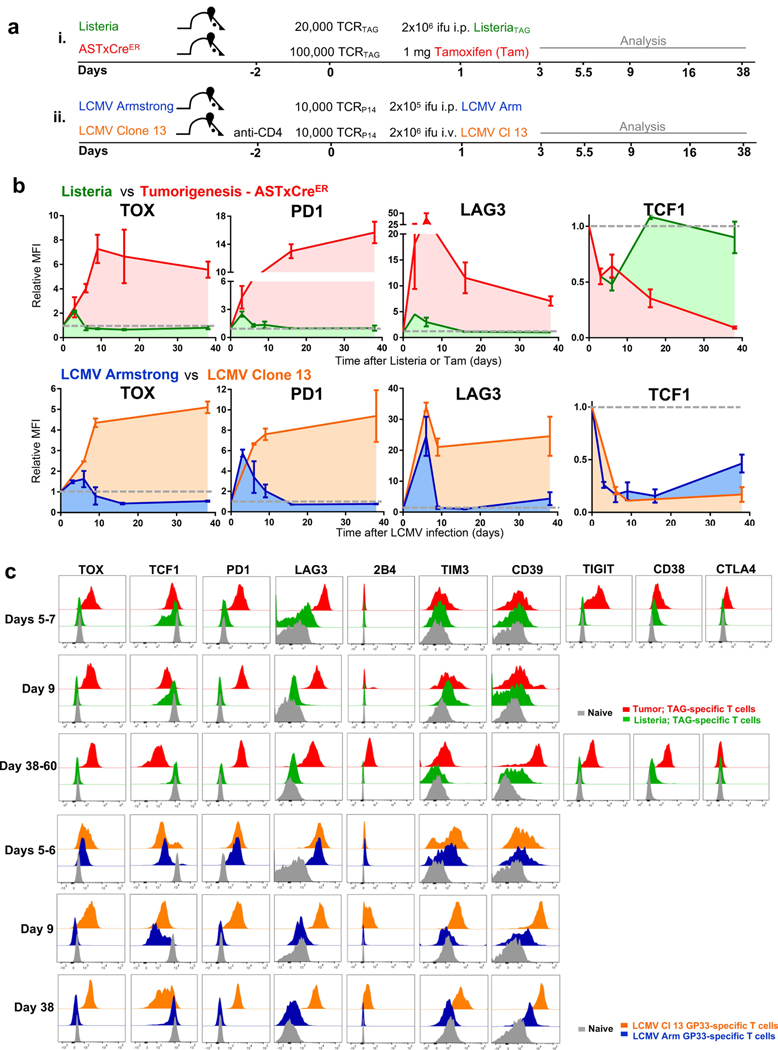
Persistent antigen encounter or TCR stimulation drives expression of inhibitory receptors and T cell exhaustion during chronic infections14 and in tumours3,15. Therefore, we analysed the expression of TOX and inhibitory receptors in GP33 virus-specific CD8 T (TCRP14) cells during acute infection with lymphocytic choriomeningitis virus (LCMV) Armstrong and chronic infection with LCMV clone 13 (Extended Data Fig. 2). TOX was transiently expressed early during acute infection with LCMV Armstrong but declined to baseline by day 5 after infection. In chronic infection with LCMV clone 13, TOX expression progressively increased in TCRP14 cells, remained increased, and correlated with high expression of several inhibitory receptors (Extended Data Fig. 2).
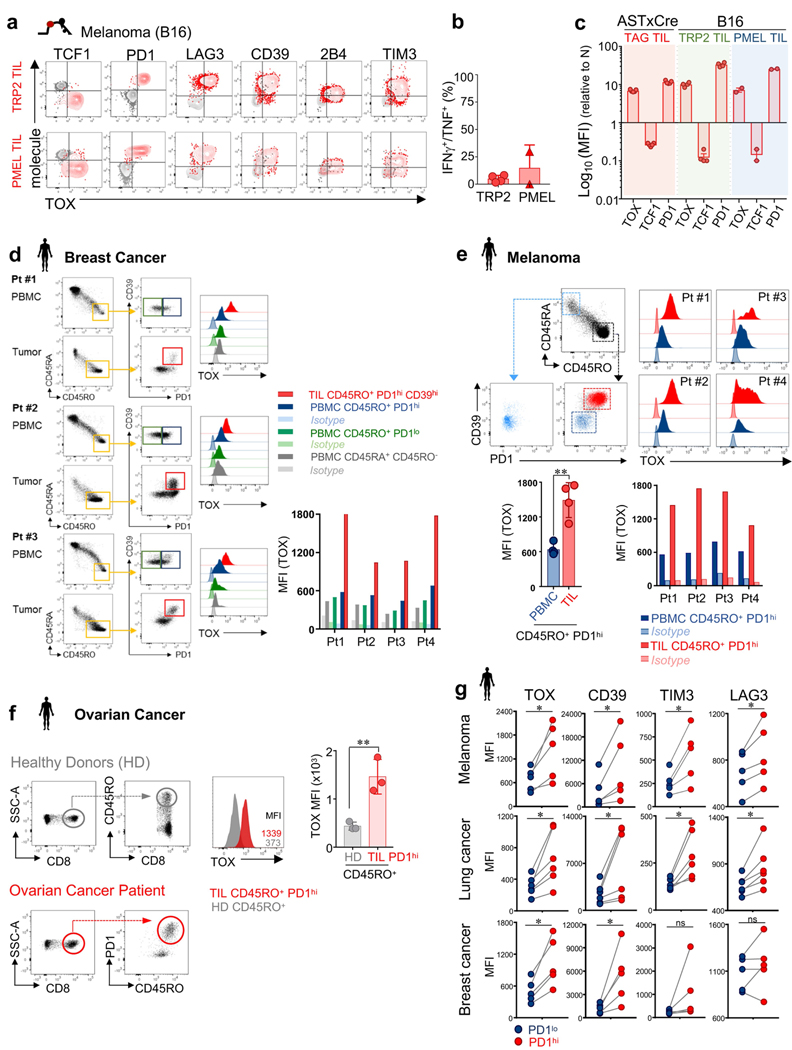
We confirmed TOX expression in the mouse B16F10 (B16) melanoma model. B16 tumours overexpress two melanoma-associated proteins, TRP2 and PMEL, which are recognized by TRP2-specific (TCRTRP2) and PMEL-specific (TCRPMEL) CD8 T cells, respectively16,17. Naive transgenic TCRTRP2 or TCRPMEL cells were adoptively transferred into B16 tumour-bearing mice, and again we found that dysfunctional, tumour-infiltrating TCRTRP2 and TCRPMEL cells expressed high levels of TOX and inhibitory receptors, and low levels of TCF-1 (Extended Data Fig. 3a–c). Thus, persistent upregulation of TOX in T cells is induced in settings of chronic antigen stimulation such as chronic infection and cancer.
Next, we examined the expression of TOX in human CD8+ tumour-infiltrating lymphocytes (TILs) and peripheral blood mononuclear cells (PBMCs) from patients with melanoma, breast, lung and ovarian cancer (Fig. 1f–h and Extended Data Fig. 3d–g). CD45RO+ PD-1hiCD39hi CD8+ TILs expressed high levels of TOX compared with CD45RO+PD-1loCD39lo or CD45RA+ TILs in the same tumour or CD45RO+PD-1hi PBMCs from the same patient. PD-1hi TILs expressed higher levels of TOX, CD39, TIM-3 and LAG-3 than PD-1lo TILs from the same tumour (Extended Data Fig. 3g). Thus, TOX is highly expressed in subsets of human TILs, and TOX expression in TILs correlates with other characterized markers of T cell exhaustion.
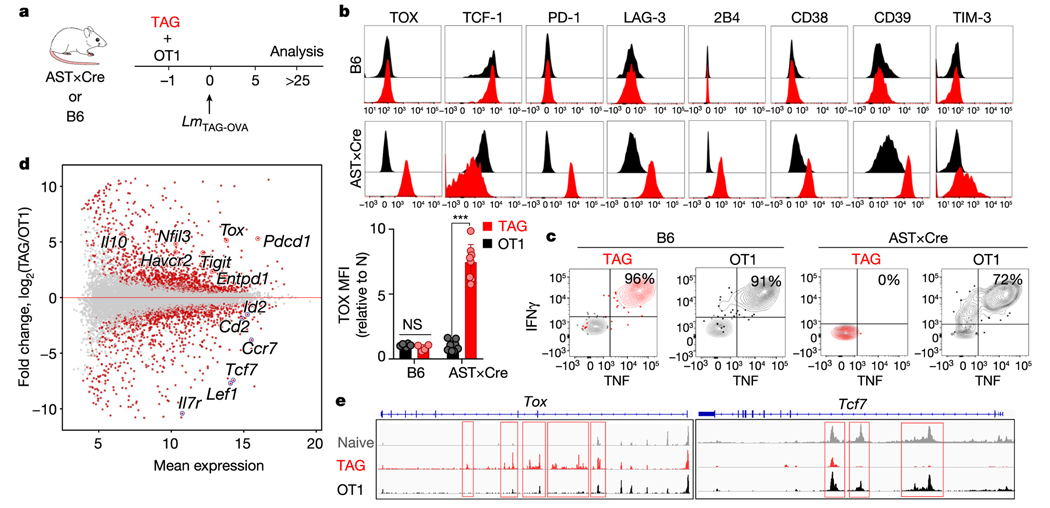
To determine the role of tumour antigen stimulation versus the tumour immunosuppressive microenvironment in TOX induction, we co-transferred equal numbers of naive tumour-specific TCRTAG (Thy1.1) cells and non-tumour-specific TCROT1 (Ly5.1) cells, which express a Kb-restricted TCR specific for ovalbumin (OVA), into the liver of tumour-bearing AST×Alb-Cre (AST mice crossed with Alb-Cre mice) or wild-type B6 control mice (Fig. 2a). One day later, recipient AST×Alb-Cre and B6 mice were immunized with Listeria co-expressing the TAG epitope I and OVA epitopes; TCRTAG and TCROT1 cells expanded equally well and expressed similar levels of activation and proliferation markers CD44 and Ki67 (Extended Data Fig. 4a). In B6 hosts, neither TCRTAG nor TCROT1 cells upregulated TOX or inhibitory receptors, and both differentiated into functional memory T cells (Fig. 2b, c). In tumour-bearing AST×Alb-Cre mice, TCRTAG cells upregulated TOX, PD-1, LAG-3, 2B4, CD38, CD39, TIM-3 and CD69, lost expression of TCF-1, and lost the ability to produce IFNγ and TNF or express CD107. By contrast, bystander TCROT1 cells from the same liver tumours did not upregulate TOX or inhibitory receptors and remained functional (Fig. 2b, c and Extended Data Fig. 4a). This finding is consistent with recent single-cell RNA-seq studies that describe distinct CD8 T cell populations in human tumours, including dysfunctional, tumour-reactive TOXhi T cells, and bystander cytotoxic T cells that are TOXlow and lack hallmarks of chronic antigen stimulation18,19.
Fig. 2 |. Chronic TCR stimulation drives TOX expression in tumour-specific CD8 T cells.
a, Experimental scheme of TCRTAG (TAG) and TCROT1 (OT1) T cell co-transfer. b, Top, expression profiles of TAG (red) and OT1 (black) isolated from the spleens of B6 mice (top; n = 6 (OT1), n = 4 (TAG)) or the livers of AST×Alb-Cre mice (bottom; n = 8 (OT1), n = 8 (TAG)), 3–4 weeks after transfer and immunization. Bottom, MFI values of TOX expression relative to naive T cells. Each symbol represents an individual mouse. Data are representative of three independent experiments. c, Intracellular IFNγ and TNF production of TAG and OT1 isolated 3–4 weeks after transfer and immunization from spleens of B6 mice (left) or liver tumour lesions of AST×Cre mice (right). Data are representative of three independent experiments. d, MA plot of the RNA-seq dataset. Significantly DEGs are shown in red. e, ATAC-seq signal profiles across the Tox and Tcf7 loci. Peaks uniquely lost or gained in TAG compared with OT1 are highlighted in red. Data are mean ± s.e.m. ***P ≤ 0.001, two-sided Student’s _t_-test. NS, not significant.
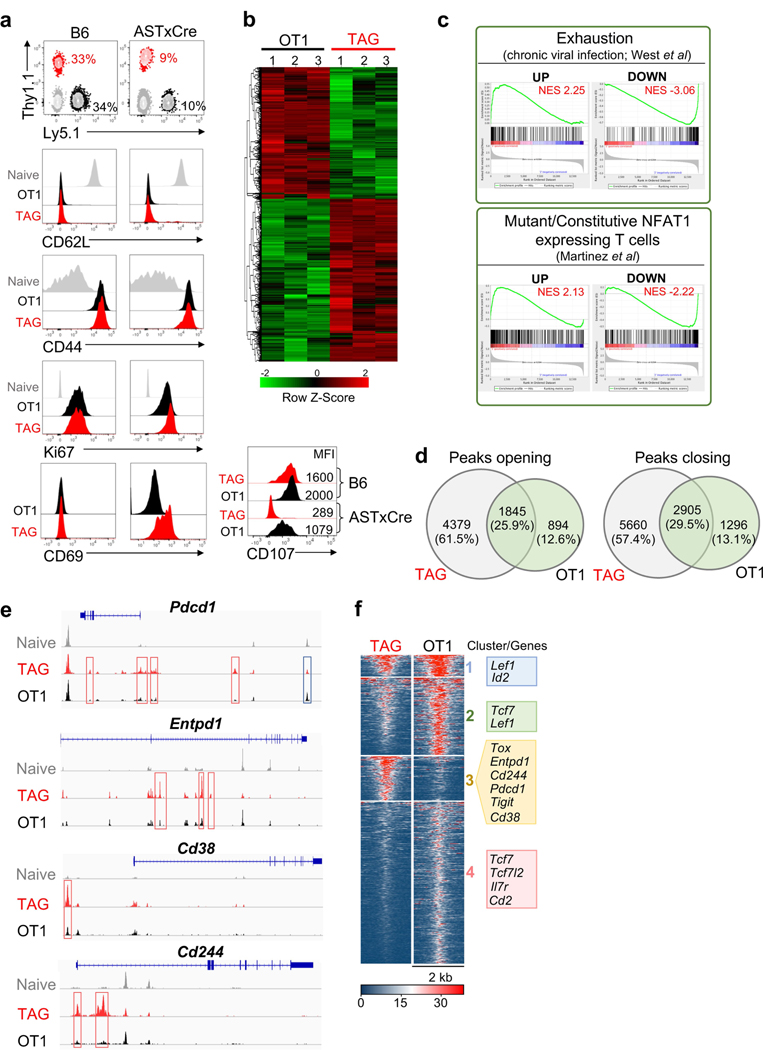
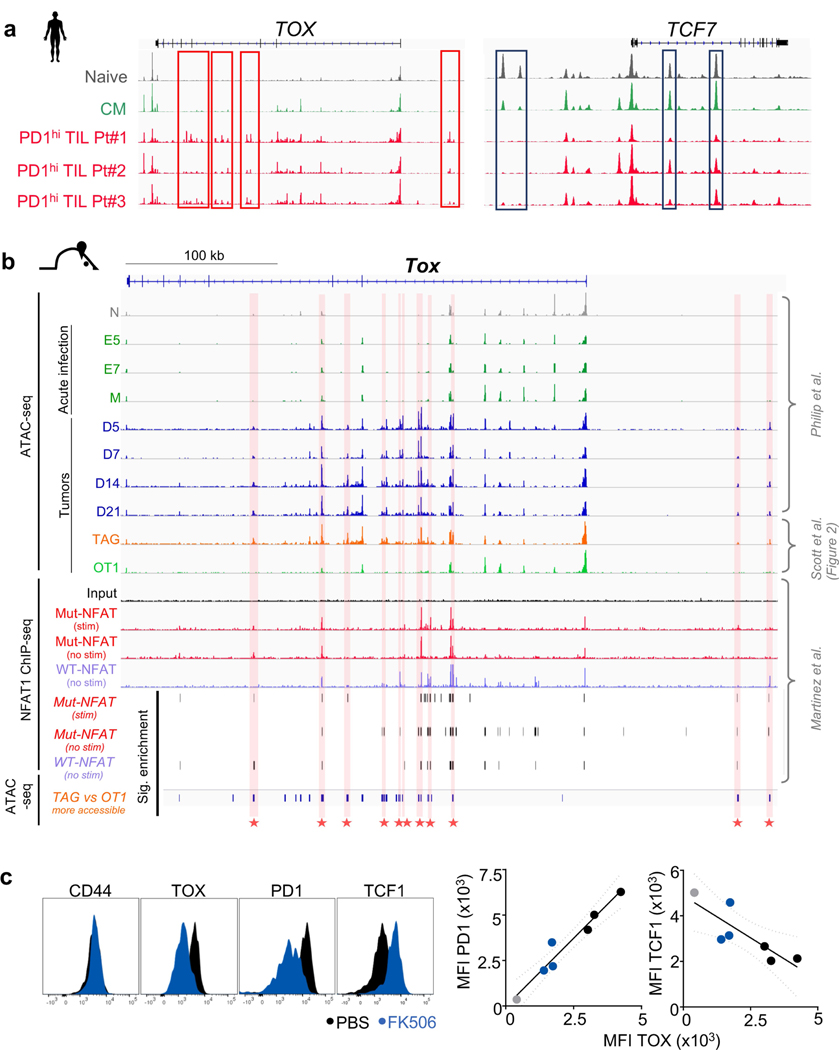
RNA-seq and assay for transposase-accessible chromatin using sequencing (ATAC-seq) analyses of liver tumour-infiltrating TCRTAG and TCROT1 cells revealed 2,347 differentially expressed genes (DEGs) and 19,071 differentially accessible peaks, including in Tox, Tcf7 and numerous inhibitory receptor-encoding genes (Fig. 2d, Extended Data Fig. 4b and Supplementary Table 1). Gene set enrichment analyses (GSEA) of the DEGs between TCRTAG and TCROT1 cells revealed enrichment for gene sets of (i) T cell exhaustion during chronic viral infection20, and (ii) gene programs induced by a mutant, constitutively active form of NFAT1 in T cells resulting in anergy or exhaustion21 (Extended Data Fig. 4c). ATAC-seq revealed that DEGs had accompanying changes in chromatin accessibility: Tox, Pdcd1 (encoding PD-1), Entpd1, Cd38 and Cd244 loci were more accessible in TCRTAG cells than in TCROT1 cells, whereas the Tcf7 locus was less accessible (Fig. 2e, Extended Data Fig. 4d–f and Supplementary Table 2). Chromatin accessibility analysis of TILs from patients with melanoma and lung cancer5 showed that PD-1hi TILs uniquely gained several peaks of open chromatin in TOX and lost multiple peaks in TCF7 when compared with human naive CD45RA+CD8+ PBMCs, or central memory CD45RA−CD45RO+CD62LhiCD8+ PBMCs from healthy donors5 (Extended Data Fig. 5a).
NFAT is a crucial regulator of T cell exhaustion and dysfunction22, and NFAT1-binding sites in genes encoding negative regulators and inhibitory receptors have increased chromatin accessibility in dysfunctional and exhausted T cells4,5,21,23,24. Thus, we compared published NFAT1 chromatin immunoprecipitation with high-throughput sequencing (ChIP–seq) data21 with our published5 and newly generated ATAC-seq datasets (Fig. 2) and found evidence that NFAT1 bound to regions within the Tox locus with significantly increased chromatin accessibility in dysfunctional TCRTAG cells (Extended Data Fig. 5b). To inhibit NFAT, we treated AST×Cre-ERT2 mice adoptively transferred with TCRTAG cells with the calcineurin inhibitor FK506 as previously described5,25,26. We found that TCRTAG cells from FK506-treated mice had decreased expression of TOX and PD-1, and increased levels of TCF-1 (Extended Data Fig. 5c), suggesting that NFAT regulates TOX expression.
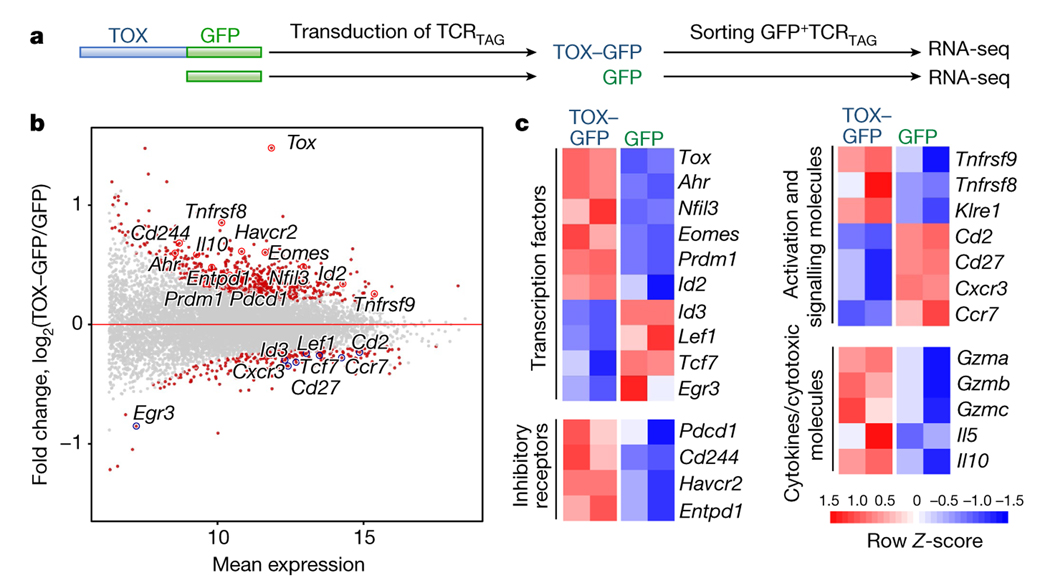
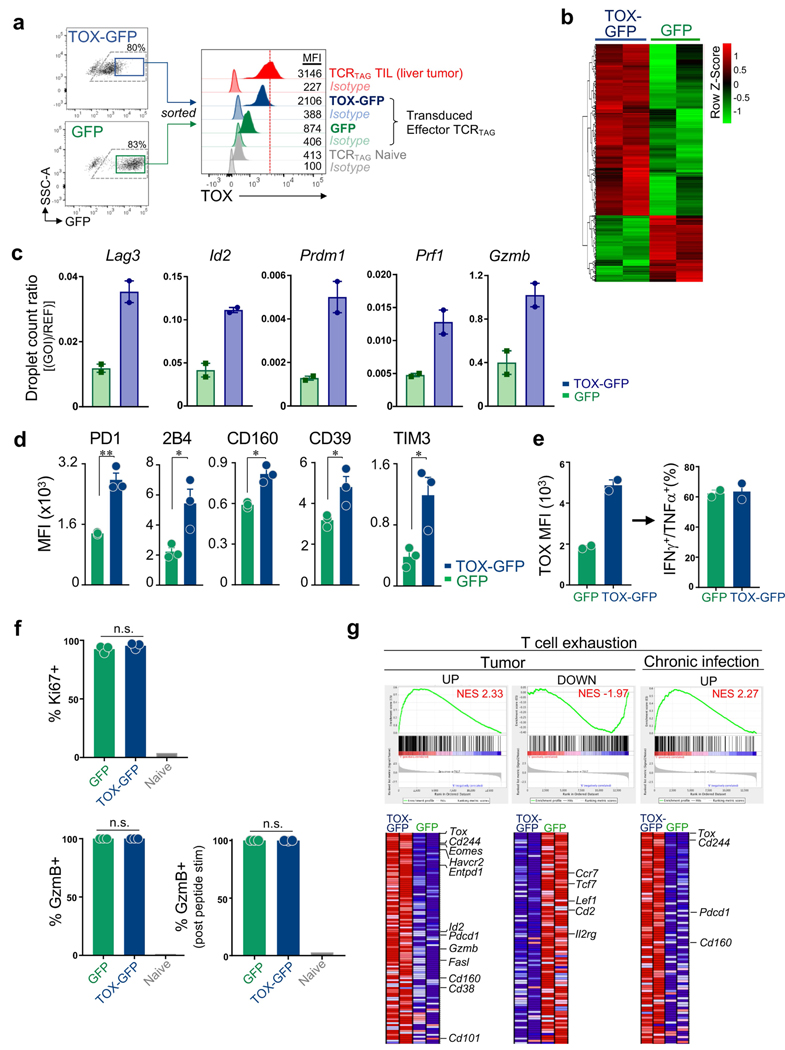
To determine whether ectopic expression of TOX in effector CD8 T cells in vitro was sufficient to induce exhaustion in the absence of chronic antigen and TCR stimulation, we transduced effector TCRTAG cells generated in vitro with retroviral vectors encoding full-length TOX fused to green fluorescent protein (GFP) or GFP alone (Fig. 3a). After transduction, effector TCRTAG cells were cultured for 6 days with IL-2 (without any additional TCR stimulation) and sorted for GFP expression (Extended Data Fig. 6a). RNA-seq analysis revealed 849 DEGs between TOX–GFP+ and GFP+ T cells (Fig. 3b, Extended Data Fig. 6b and Supplementary Table 3). GSEA revealed that the transcriptional program of TOX–GFP+ TCRTAG cells was significantly enriched for genes associated with chronic infections and tumours, with reduced expression of several genes encoding transcription factors (Tcf7, Lef1 and Id3), and increased expression of genes encoding inhibitory receptors (Pdcd1, Cd244, Havcr2 and Entpd1) and transcription factors such Despite expressing numerous exhaustion-associated genes, TOX–GFP+ TCRTAG cells remained highly functional and proliferative (Extended Data Fig. 6d–f).
Fig. 3 |. Ectopic expression of TOX is sufficient to induce a global molecular program characteristic of T cell exhaustion.
a, Experimental scheme (see also Methods). b, MA plot of RNA-seq dataset. Significantly DEGs are coloured in red. c, Heat map of RNA-seq expression (rownormalized log2 (counts per million) for DEGs; false discovery rate (FDR) < 0.10) in TOX–GFP+ and GFP+ TCRTAG cells.
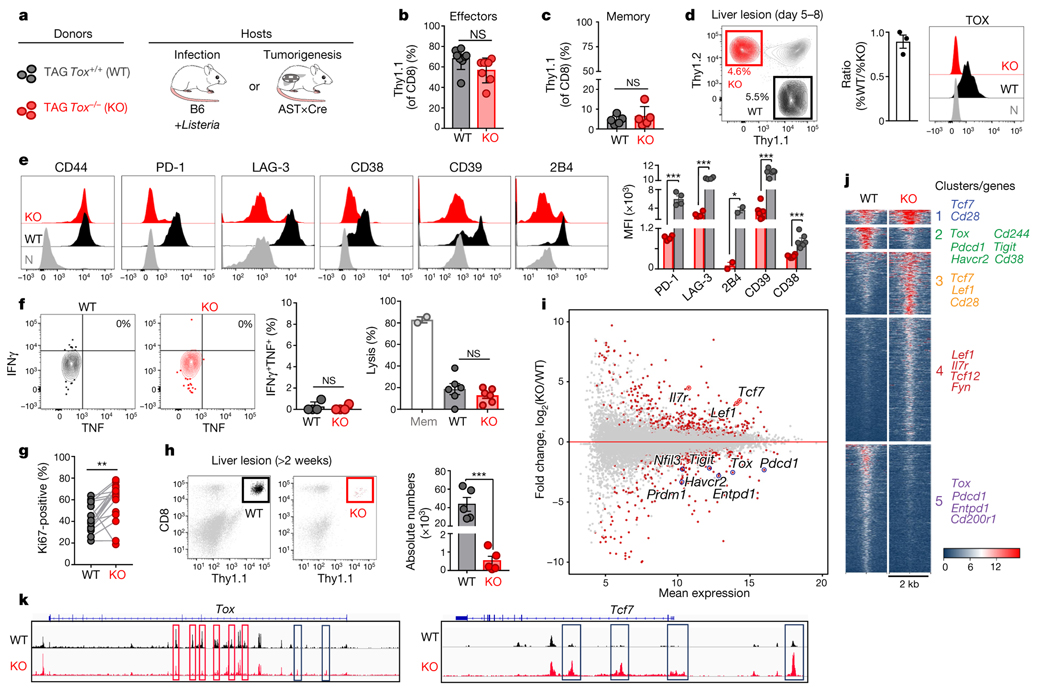
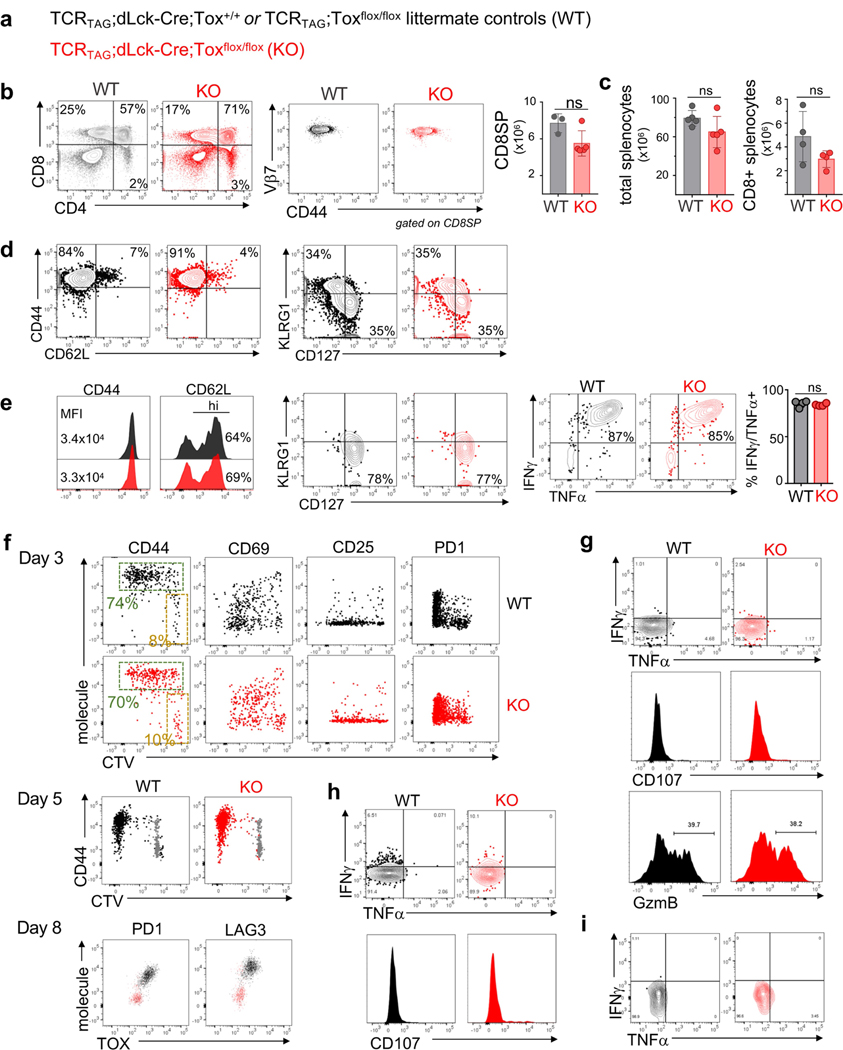
Next, we examined how genetic deletion of Tox affected CD8 T cell differentiation during acute infection or in tumours. TCRTAG mice were crossed to Tox flox/flox mice10 and mice expressing Cre-recombinase under the distal Lck promoter to generate TOX-knockout TCRTAG mice (Fig. 4a and Extended Data Fig. 7a). TCRTAG cells from TOX-knockout TCRTAG mice developed normally and similarly to littermate control mice (Extended Data Fig. 7b, c). Naive TOX-knockout and wild-type (Thy1.1+) TCRTAG cells were adoptively transferred into B6 (Thy1.2+) mice and immunized 1 day later with _Lm_TAG. TOX-knockout and wild-type TCRTAG cells expanded equally well in response to _Lm_TAG immunization (Fig. 4b), became CD44hi and CD62Llo, formed similar numbers of KLRG1loCD127hi memory precursors and KLRG1hiCD127lo short-lived effector cells8 (Extended Data Fig. 7d), differentiated into memory T cells (3–4 weeks after immunization), and produced similar amounts of IFNγ and TNF after ex vivo stimulation with peptide (Fig. 4c and Extended Data Fig. 7e). Thus, TOX is not required for the differentiation of naive T cells into effector and memory T cells during acute infection.
Fig. 4 |. Phenotypic, functional, transcriptional and epigenetic analysis of TOX-deficient T cells.
a, Experimental scheme. b, c, Percentage of wild-type (WT; black) and knockout (KO; red) Thy1.1+ effector (b) or memory (c) TCRTAG cells isolated from spleens 7 days (b) or 3 weeks (c) after _Lm_TAG infection, respectively. For b, n = 8 (WT); n = 7 (KO); for c, n = 5 (WT); n = 5 (KO); two independent experiments. d, Left, wild-type and knockout TCRTAG cells isolated from malignant liver lesions 5–8 days after transfer into AST×Cre-ERT2 (Thy1.1+Thy1.2+) mice. Middle, ratio of the percentage of wild-type and knockout T cells. Right, TOX expression of liver-infiltrating wild-type and knockout TCRTAG cells; naive TCRTAG cells are shown in grey as a control. e, Expression profiles of liver-infiltrating wild-type and knockout TCRTAG cells 8–10 days after adoptive transfer. Naive TCRTAG cells are shown in grey. Data are representative of more than five independent experiments (n = 4 (PD-1/LAG-3); n = 2 (2B4); n = 6 (CD39/CD38)). f, Left, intracellular IFNγ and TNF production of wild-type (n = 4) and TOX-knockout (n = 4) TCRTAG cells isolated 10 days after transfer from liver lesions of AST×Cre mice. Right, specific lysis of TAG-peptide-pulsed EL4 cells in chromium release assays by wild-type (n = 6) and knockout (n = 6) TCRTAG cells isolated and flow-sorted from liver tumour lesions. Results from two independent experiments. Memory (Mem) TCRTAG cells are shown as a control. g, Percentage of Ki67-positive wild-type and knockout TCRTAG cells from malignant liver lesions 6–8 days after transfer into AST×Cre mice. Data are from three independent experiments. h, Wild-type and knockout donor TCRTAG cells 19 days after transfer in liver tumours (WT, n = 5; KO, n = 5). Data are representative of two independent experiments. In b–h, each symbol represents an individual mouse. i, MA plot of RNA-seq data. Significantly DEGs are in red. j, Chromatin accessibility of wild-type and knockout TCRTAG cells. Each row represents one peak (differentially accessible between wild-type and knockout; FDR < 0.05) displayed over a 2-kb window centred on the peak summit; regions were clustered with _k_-means clustering. Genes associated with peaks within individual clusters are highlighted. k, ATAC-seq signal profiles across the Tox and Tcf7 loci. Peaks uniquely lost or gained in knockout TCRTAG cells are highlighted in red or blue, respectively. Data are mean ± s.e.m. *P ≤ 0.05, **P ≤ 0.01, ***P ≤ 0.001, two-sided Student’s _t_-test.
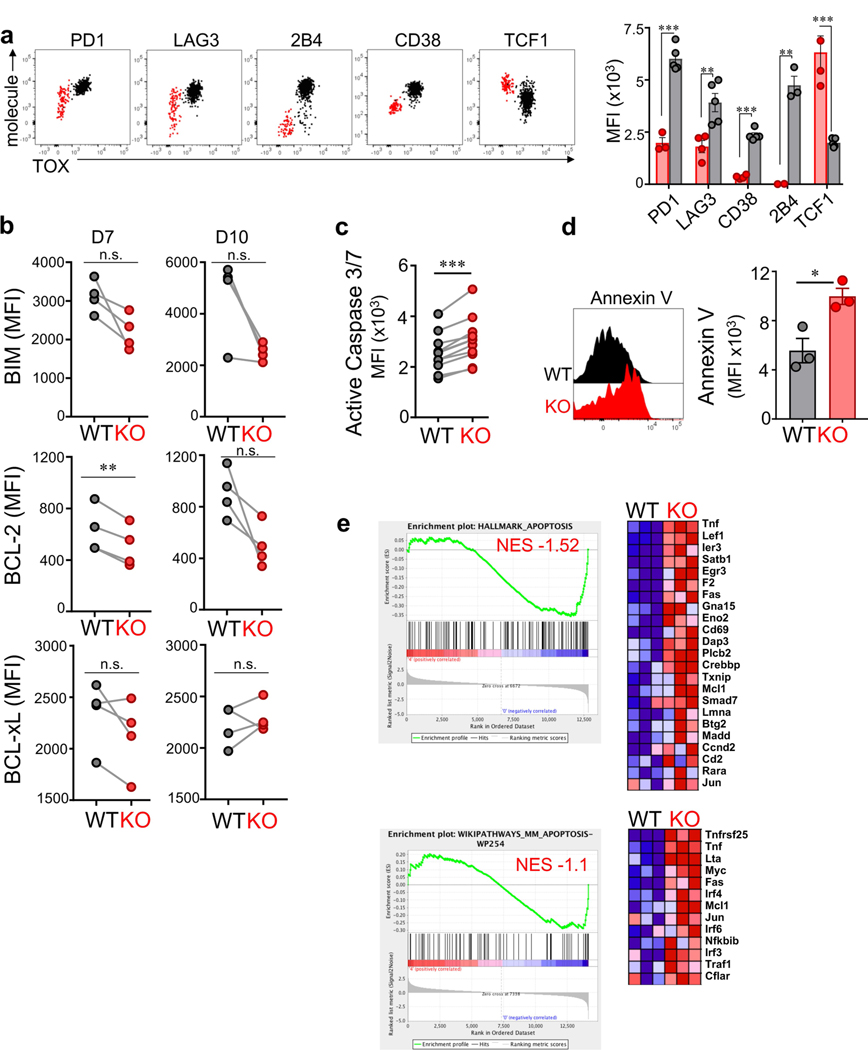
Next, we adoptively transferred naive TOX-knockout and wild-type TCRTAG cells into AST×Cre mice. TOX-knockout and wild-type TCRTAG cells equivalently infiltrated the liver (Fig. 4d), proliferated and upregulated CD44, CD69 and CD25 (Fig. 4e and Extended Data Fig. 7f). Notably, by 8–10 days after transfer, TOX-knockout TCRTAG cells did not upregulate inhibitory receptors including PD-1, LAG-3, CD38, CD39 and 2B4, in contrast to wild-type TCRTAG cells (Fig. 4e and Extended Data Fig. 7f). Nevertheless, TOX-knockout and wild-type TCRTAG cells showed comparable reductions in the production of IFNγ and TNF, the expression of CD107, granzyme B (GZMB), and the specific lysis of TAG-peptide-pulsed EL4 target cells (Fig. 4f and Extended Data Fig. 7g–i). Thus, despite their normal, ‘non-exhausted’ phenotype (Fig. 4e) and proliferative capacity (Fig. 4g), TOX-knockout TCRTAG cells remained dysfunctional, revealing that the regulation of inhibitory receptors is uncoupled from T cell effector function. Notably, by 2–3 weeks after transfer, very few TOX-knockout TCRTAG cells could be found in liver tumour lesions, whereas wild-type TOX TCRTAG cells persisted throughout the course of tumour progression (Fig. 4h and Extended Data Fig. 8a). Indeed, TOX-knockout TCRTAG cells had increased levels of active caspases 3 and 7, increased annexin V staining, and an enrichment of apoptosis genes, although the expression of pro- and anti-apoptotic proteins such as BIM, BCL-2 and BCL-xL was similar between knockout and wild-type TCRTAG cells (Extended Data Fig. 8b–e).
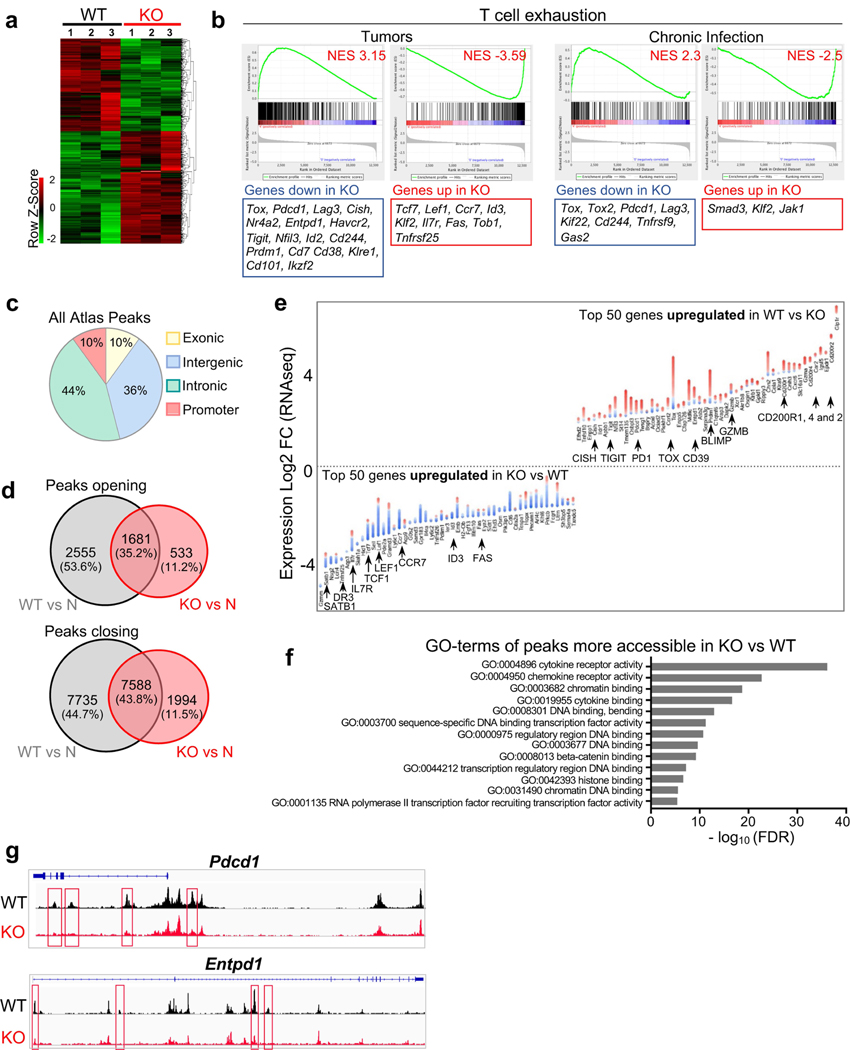
We performed RNA-seq and ATAC-seq analyses from TOX-knockout and wild-type TCRTAG cells isolated from liver tumours of AST×Cre mice 8–9 days after adoptive transfer and identified 679 DEGs and 12,166 differentially accessible chromatin regions, respectively (Fig. 4, j, Extended Data Fig. 9 and Supplementary Tables 1, 2). TOX-knockout TCRTAG cells had low expression of genes encoding transcription factors and inhibitory receptors including Nfil3, Prdm1, Cish, Pdcd1, Entpd1, Tigit, Havcr2 and Cd38, and high expression of the transcription factors Tcf7, Lef1 and Id3. GSEA of DEGs between TOX-knockout and wild-type TCRTAG cells revealed strong enrichment for genes and pathways associated with T cell exhaustion during chronic infection and tumorigenesis (Extended Data Fig. 9b). Transcriptional differences were associated with corresponding changes in chromatin accessibility patterns of the respective genes (Fig. 4j and Extended Data Fig. 9c–g). For example, the loci of Tox, Pdcd1, Cd38 and Entpd1 were less accessible in TOX-knockout TCRTAG cells than in TOX wild-type TCRTAG cells, whereas the loci of Tcf7, Cd28, Fyn and Il7r were more accessible (Fig. 4k and Extended Data Fig. 9e). More accessible regions in TOX-knockout TCRTAG cells showed significant enrichment for Gene Ontology (GO) terms associated with (i) cytokine and chemokine receptor activity; (ii) chromatin binding and bending, regulatory region DNA binding; and (iii) β-catenin binding (Extended Data Fig. 9f). We also found enrichment of apoptosis pathways in TOX-knockout TCRTAG cells and increased expression of genes associated with apoptosis such as Fas, Tnf, Gas2 and Tnfrs25 (which encodes DR3) (Extended Data Figs. 8e, 9e).
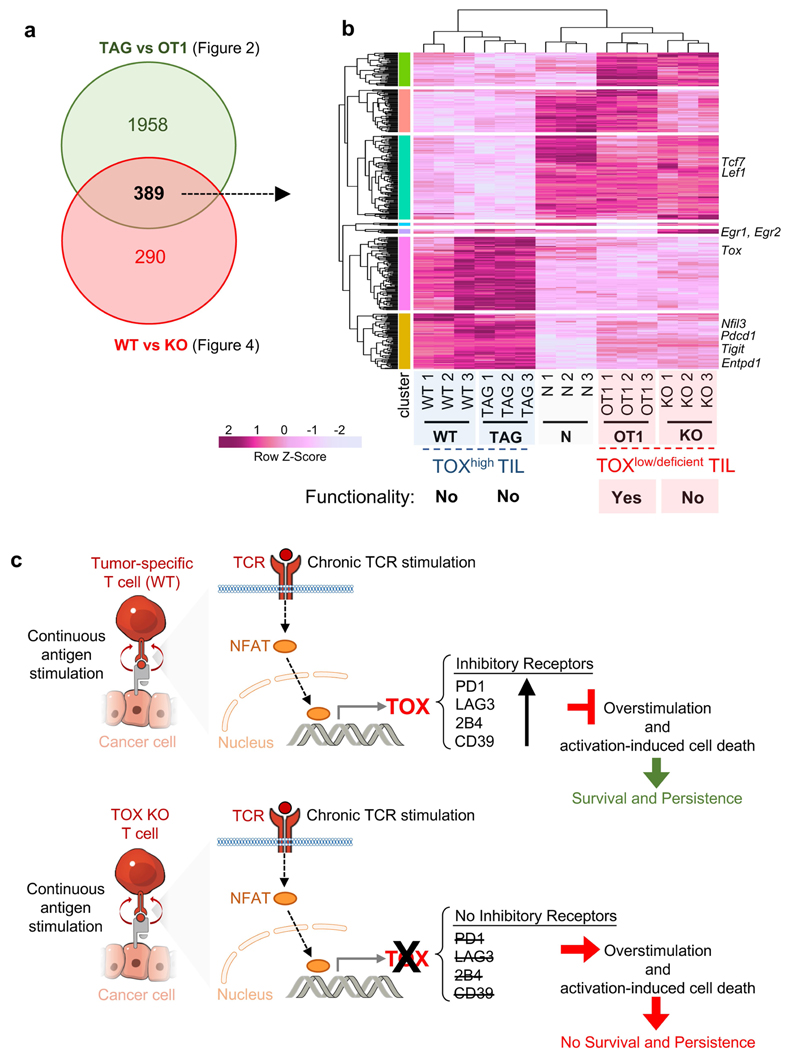
In summary, TOX is specifically required for T cell differentiation in settings of chronic antigen stimulation (such as tumours and chronic infection). A key finding of our study is that the regulation of inhibitory receptor expression is uncoupled from the loss of effector function in dysfunctional TST cells. Supporting this point is the notable phenotypic and transcriptional similarities between dysfunctional TOX-knockout TCRTAG TILs (Fig. 4) and functional TOX-negative, bystander TCROT1 TILs (Fig. 2 and Extended Data Fig. 10a, b). TOX-deficient TST cells failed to persist in tumours, and we hypothesize that the TOX-induced gene regulation of inhibitory receptors and other exhaustion-associated molecules serve as a physiological negative feedback mechanism to prevent overstimulation of antigen-specific T cells and activation-induced cell death in settings of chronic antigen stimulation such as chronic infection and cancer (Extended Data Fig. 10c).
METHODS
Mice.
AST (Albumin-floxStop-SV40 large T antigen (TAG)) mice were previously described3,5,7. TCRTAG transgenic mice (B6.Cg-Tg(TcraY1,TcrbY1)416Tev/J)27, Cre-ERT2 (B6.129-Gt(ROSA)26Sortm1(cre/ERT2)Tyj/J), Alb-Cre (B6.Cg-Tg(Alb-cre)21Mgn/J), TCROT1 (C57BL/6-Tg(TcraTcrb)1100Mjb/J), Ly5.1 (B6.SJL-Ptprca Pepcb/BoyJ), B6.Cg-Tg(Lck-icre)3779Nik/J (dLck-Cre) and C57BL/6J Thy1.1 mice were purchased from The Jackson Laboratory. Tox flox/flox mice10 were previously described, and obtained from M. Glickman, with permission from J. Kaye. Tox flox/flox mice were crossed to TCRTAG and dLck-Cre28 mice to obtain TCRTAG_Tox_ −/− (knockout) mice. TCRTRP2 mice were obtained from N. Restifo, with permission from A. Hurwitz. TCRTRP2 and TCRTAG mice were crossed to Thy.1.1 mice to generate TCRTRP2 and TCRTAG Thy.1.1 mice, respectively. TCROT1 mice were crossed to Ly5.1 mice to generate TCROT1 Ly5.1 mice. AST mice were crossed to Cre-ERT2 (Cre recombinase fused to tamoxifen-inducible oestrogen receptor) or Alb-Cre mice to obtain AST×Cre-ERT2 and AST×Alb-Cre mice, respectively. TCRPMEL and TCRP14 mice were purchased from The Jackson Laboratory. AST mice were also crossed to Thy1.1 mice to generate AST×CreERT2 Thy1.1/Thy1.2 mice. All mice were bred and maintained in the animal facility at MSKCC. Experiments were performed in compliance with the MSKCC Institutional Animal Care and Use Committee regulations.
B16 tumour model.
Approximately 5 × 10⁵–1 × 10⁶ B16 tumour cells were injected into C57BL/6J wild-type mice. Once tumours were established (1–2 weeks later), around 2 million naive TCRTRP2 or TCRPMEL (Thy1.1+) T cells were adoptively transferred and isolated from tumours at indicated time points. Tumour volumes did not exceed the permitted volumes specified by the MSKCC IACUC protocol.
Adoptive transfer studies during acute Listeria infection and in AST×Cre-ERT2 tumour models.
Naive CD8+ splenocytes from TCRTAG Thy1.1 transgenic mice were adoptively transferred into AST×Alb-Cre mice, or AST×Cre-ERT2 mice and treated with 1 mg tamoxifen 1–2 days later. For TCRTAG and TCROT1 co-transfer experiments, 3–4 × 10⁴ TCRTAG Thy1.1 and TCROT1 Ly5.1 CD8+ splenocytes were adoptively transferred into AST×Alb-Cre mice or B6 control mice; 1 day later, mice were infected with 5 × 10⁶ colony-forming units (CFU) L. monocytogenes (Lm) TAG-I OVA (co-expressing TAG-I epitope and OVA epitope SIINFEKL). For the generation of effector and memory TCRTAG CD8+ T cells, 100,000 CD8+ splenocytes from TCRTAG Thy1.1 wild-type or knockout mice were adoptively transferred into congenic B6 mice; 1 day later, mice were infected with 5 × 10⁶ CFU _Lm_TAG. Effector TCRTAG CD8+ T cells were isolated from the spleens of B6 host mice and analysed 5–7 days after Listeria infection; memory TCRTAG CD8+ T cells were isolated from spleens of B6 host mice and analysed at least 3 weeks after Listeria infection. For wild-type and knockout studies, CD8+ splenocytes from TCRTAG (wild-type) or TCRTAG TOX-knockout mice were adoptively transferred into AST×Cre-ERT2 (and 1–2 days later, mice were treated with 1 mg tamoxifen) or into AST×Alb-Cre mice. For these studies, we define knockout TCRTAG as TOX-deficient T cells.
LCMV clone 13 and LCMV Armstrong infection model.
LCMV infection was done as previously described29. In brief, 10,000 TCRP14 cells were adoptively transferred intravenously into congenic 6–8-week-old C57BL/6 mice, and mice were infected 1 day later with LCMV Armstrong (2 × 10⁵ plaque-forming units (PFU), intraperitoneally) or LCMV clone 13 (2 × 10⁶ PFU, intravenously). In mice receiving LCMV clone 13, CD4 T cells were depleted with 200 μg anti-CD4 antibody (clone GK1.5) 2 days before T cell transfer29.
Antibodies for flow cytometric analysis.
For mouse studies, the following antibodies were purchased: from BioLegend: 2B4 (m2B4), BCL-2 (BCL/10C4), CD101 (Moushi101), CD11c (N418), CD127 (A7R34), CD19 (6D5), CD25 (PC61.5), CD3 (145–2C11), CD38 (90), CD39 (Duha59), CD40 (3/23), CD44 (IM7), CD62L (MEL-14), CD69 (H1.2F3), CD70 (FR70), CD80 (16–10A1), CD86 (GL-1), CD90.1 (OX-7 and HIS51), CD90.2 (30-H12 and 53–2.1), CXCR5 (L138D7), Eomes (Dan11mag), GZMB (GB11), IFNγ (XMG1.2), IL-2 (JES6–5H4), KLRG1 (2F1), LAG-3 (C9B7W), MHC I-A/I-E (M5/114.15.2), PD-1 (RMP1–30), T-bet (4B10), TIM-3 (RMT3–23), TNF (MP6-XT22), and 7-amino-actinomycin (7-AAD); from BD Biosciences: annexin V, CD95 (Jo2), Ki67 (B56), Vb7 (TR310); BCL-xL (H-5; Santa Cruz Biotechnology); BIM (C34C5; Cell Signaling Technology), CD8 (53–6.7; eBioscience), CTLA-4 (UC10–410-11; Tonbo Biosciences), TCF-1 (C63D9; Cell Signaling Technology), TIGIT (GIGD7; eBioscience).
For human studies, the following antibodies were purchased: CD39 (A1; BioLegend), CD45RA (HI100; BioLegend), CD45RO (UCHL1; BioLegend), CD8 (RPA-T8; BioLegend), LAG-3 (17B4; Enzo Life Sciences), PD-1 (EH12.1; BD Biosciences) and TIM-3 (F38–2E2; BioLegend).
For flow cytometric detection and analysis of mouse and human TOX, anti-human/mouse TOX antibody clone REA473 was used (Miltenyi Biotec); antibody clone REA293 was used as TOX isotype (Miltenyi Biotec).
Tamoxifen treatment.
Tamoxifen was purchased from Sigma-Aldrich. A tamoxifen stock solution (5 mg ml−1 in corn oil) was prepared by warming tamoxifen in 1-ml sterile corn oil at 50 °C for approximately 15 min, then further diluted in corn oil to obtain the stock concentration of 5 mg ml−1. Tamoxifen (1 mg; 200 μl) was administered once intraperitoneally into AST×Cre-ERT2 mice.
Flow cytometric analysis.
Flow cytometric analysis was performed using BD Fortessa FACS Cell Analyzers; cells were sorted using BD FACS Aria (BD Biosciences) at the MSKCC Flow Core Facility. Flow data were analysed with FlowJo (Tree Star).
Listeria infection.
The L. monocytogenes (Lm) Δ_actA_Δ_inlB_ strain30 expressing the TAG epitope I (206-SAINNYAQKL-215, SV40 large T antigen) together with the OVA SIINFEKL epitope was generated by Aduro Biotech as previously described3,5. The Lm strain was constructed using the previously described strategy31. Experimental vaccination stocks were prepared by growing bacteria to early stationary phase, washing in PBS, formulated at approximately 1 × 10¹⁰ CFU ml−1, and stored at −80 °C. Mice were infected intraperitoneally with 5 × 10⁶ CFU of _Lm_TAG.
Cell isolation for subsequent analyses.
Spleens were mechanically disrupted with the back of a 3-ml syringe, filtered through a 70-μm strainer, and red blood cells were lysed with ammonium chloride potassium buffer. Cells were washed twice with cold RPMI 1640 media supplemented with 2 μM glutamine, 100 U ml−1 penicillin/streptomycin, and 5–10% FCS. Liver tumour and B16 tumour tissues were mechanically disrupted and dissociated with scissors (in 1–2 ml of cold complete RPMI). Dissociated tissue pieces were transferred into a 70-μm strainer (placed into a 60-mm dish with 1–2 ml of cold complete RPMI) and further dissociated with the back of a 3-ml syringe. Cell suspension was filtered through 70-μm strainers. Tumour homogenate was spun down at 400_g_ for 5 min at 4 °C. Pellet was resuspended in 15 ml of 3% FCS in HBSS, 500 μl (500 U) heparin, and 8.5 ml Percoll, mixed by several inversions, and spun at 500_g_ for 10 min at 4 °C. Pellet was lysed with ammonium chloride potassium buffer and cells were further processed for downstream applications.
Human samples.
PBMC and tumour samples were obtained from patients with cancer enrolled on a biospecimen procurement protocol approved by the MSKCC Institutional Review Board (IRB). Each patient signed an informed consent form and received a patient information form before participation. Human samples were analysed using an IRB-approved biospecimen utilization protocol. Breast cancer samples were selected from patients who had evidence of a dense mononuclear cell infiltrate on conventional haematoxylin and eosin (H&E) staining. For human ovarian tumour samples (Extended Data Fig. 3): tumour samples were obtained as per protocols approved by the IRB. All patients provided informed consent to an IRB-approved correlative research protocol before the collection of tissue (Memorial Sloan Kettering Cancer Center IRB 00144 and 06–107). Human peripheral blood lymphocytes were obtained from the New York Blood Center or from patients where indicated. Human tumours were mechanically disrupted as described for solid mouse tumours, centrifuged on Percoll gradients and further assessed by flow cytometric analysis.
FK506 studies.
Naive TCRTAG (Thy1.1+) cells were transferred into AST×Cre-ERT2 (Thy1.2+) mice, which were treated with tamoxifen 1 day later. On days 2–8, mice were treated with the calcineurin inhibitor FK506 (Prograf, 5 mg ml−1) (2.5 mg per kg per mouse intraperitoneally, once daily). Control mice were treated with PBS. All mice were analysed on day 10.
TOX overexpression experiments.
Mouse Tox cDNA (accession number NM_145711.4) without the stop codon fused in-frame with the coding sequence of a monomeric form of green fluorescent protein (mGFP) was obtained from OriGene Technologies (MR208435L2). PCR cloning was used to amplify TOX–mGFP, which was then cloned into the pMIGR1 retroviral vector to generate pMIGR1 TOX–mGFP using the restriction enzymes EcoRI and PacI. pMIGR1 TOX–mGFP and control pMIGR1-GFP containing only mGFP were used for retroviral transduction of TCRTAG CD8+ T cells as follows: on day 1, the retroviral packaging cell line Plat-Eco (Cell Biolabs) was transfected using Effectene (Qiagen) following the manufacturer’s instructions. On day 2, splenocytes from TCRTAG mice were isolated and stimulated with soluble anti-CD3 and anti-CD28 antibodies. On day 3, activated splenocytes were resuspended in the viral supernatant containing 50 U ml−1 IL-2 and 5 μg ml−1 Polybrene (Santa-Cruz Biotechnology), transferred to 12-well plates, and spun at 1,000_g_ for 90 min. This process was repeated the next day. Transduced T cells were cultured for six additional days, replacing media and adding fresh IL-2 (100 U ml−1) every other day. T cells were collected and flow-sorted for high GFP expression for downstream transcriptome analysis.
Intracellular cytokine and transcription factor staining.
Intracellular cytokine staining was performed using the Foxp3/Transcription Factor Staining Buffer Set (eBioscience) per manufacturer’s instructions. In brief, T cells were mixed with 2 × 10⁶ congenically marked splenocytes and incubated with TAG epitope I peptide (0.5 μg ml−1) or OVA peptide (0.1 μg ml−1) for 4–5 h at 37 °C in the presence of GolgiPlug (brefeldin A). Where indicated, naive splenocytes or APCs were activated either in vivo (single intraperitoneal injection of 50 μg lipopolysaccharide (LPS; Sigma; L2630), 24 h before euthanization)32 or in vitro (1-h pulse at 37 °C with 1 μg ml−1 LPS followed by extensive washing)33. Where indicated, cells were also stimulated with PMA (20 ng ml−1) and ionomycin (1 μg ml−1) for 4 h. After staining for cell-surface molecules, the cells were fixed, permeabilized and stained with antibodies to IFNγ, TNF and GZMB. Intracellular transcription factor staining was performed using the Foxp3/Transcription Factor Staining Buffer Set (eBioscience) as per the manufacturer’s instructions.
Annexin V staining.
Apoptosis was assessed by flow cytometry using V450 Annexin V (BD Biosciences; 560506) and 7-AAD following the manufacturer’s instructions.
Active caspase-3/7 analysis.
For the flow cytometric analysis of active caspase-3/7, cells were incubated with 500 nM CellEvent Caspase 3/7 Green Detection Reagent (Invitrogen; C10423) for 30 min at 37 °C.
Chromium release assay.
Mouse EL4 lymphoma cells were loaded with 150 μCi of [51Cr]sodium chromate for 2 h. TAG epitope I peptide (SAINNYAQKL) at a concentration of 1 μg ml−1 was added during last 30 min of incubation. 51Cr-labelled, TAG-I-pulsed EL4 cells were co-cultured with flow-sorted memory TCRTAG T cells or wild-type or knockout TOX TCRTAG T cells isolated and flow-sorted from liver tumours of AST×Cre mice (6–8 days after transfer) at a 5:1 (effector:target) ratio for 16 h. Medium alone or 2% Triton-X was added to set spontaneous or total lysis, respectively. Specific killing was calculated using following formula: percentage lysis = ((test counts per min − spontaneous counts per min)/(total counts per min − spontaneous counts per min))×100.
Sample preparation for ATAC-seq and RNA-seq.
Replicate samples were isolated from spleens or livers and sorted as follows: (i) naive TCRTAG Thy1.1+ T cells were sorted by flow cytometry (CD8+/CD44lo) from spleens of TCRTAG Thy1.1 transgenic mice. (ii) Wild-type and knockout TOX TCRTAG T cells were sorted from livers of established AST×Cre mice 8–9 days after transfer. Cells were gated on CD8+Thy1.1+PD-1hi/loLAGhi/loCD39hi/lo. A small aliquot of sorted cell populations was used to confirm TOX expression (for wild-type) and TOX deficiency (for knockout). (iii) TCROT1 and TCRTAG T cells were sorted from livers of established AST×Cre mice 20–21 days after transfer/Listeria infection. After flow-sorting, all samples for downstream ATAC-seq analysis were frozen in 10% FCS in DMSO and stored at −80 °C; samples for RNA-seq were directly sorted into Trizol and frozen and stored at −80 °C.
Transcriptome sequencing.
Samples for RNA-seq were sorted directly into TRIzol LS (Invitrogen). The volume was adjusted to 1 ml with PBS and samples frozen and stored at −80 °C. RNA was extracted using RNeasy mini kit (Qiagen) per instructions provided by the manufacturer. After ribogreen quantification and quality control of Agilent BioAnalyzer, total RNA underwent amplification using the SMART-seq V4 (Clonetech) ultralow input RNA kit for sequencing (12 cycles of amplification for 2–10 ng of total RNA). Subsequently, 10 ng of amplified cDNA was used to prepare Illumina Hiseq libraries with the Kapa DNA library preparation chemistry (Kapa Biosystems) using 8 cycles of PCR. Samples were barcoded and run on a Hiseq 4000, in a 50-bp/50-bp paired-end run, using the TruSeq SBS Kit v3 (Illumina).
ATAC-seq.
Frozen 25,000–50,000 cells were thawed and washed in cold PBS and lysed. Transposition was performed at 42 °C for 45 min. After purification of the DNA with the MinElute PCR purification kit (Qiagen), material was amplified for five cycles. Additional PCR cycles were evaluated by quantitative PCR. Final product was cleaned by Ampure Beads at a 1.5× ratio. Libraries were sequenced on a Hiseq 2500 1T in a 50-bp/50-bp paired-end run, using the TruSeq SBS Kit v.3 (Illumina).
Bioinformatics methods.
The quality of the sequenced reads was assessed with FastQC and QoRTs (for RNA-seq samples (ref. 34 and Babraham Bioinformatics v.0.11.7 http://www.bioinformatics.babraham.ac.uk/projects/fastqc (2010)). Unless stated otherwise, all plots involving high-throughput sequencing data were obtained with custom R scripts (see github.com/friedue/Scott2019 for the code; R: A Language and Environment for Statistical Computing https://www.R-project.org/ (2014); and ref. 35).
RNA-seq.
DNA sequencing reads were aligned with default parameters to the mouse reference genome (GRCm38) using STAR36. Gene expression estimates were obtained with featureCounts using composite gene models (union of the exons of all transcript isoforms per gene) from Gencode (version M17)37,38.
DEGs.
DEGs were determined with DESeq2. The _q_-value cut-offs for the final lists of DEG were as follows: (i) TOX–GFP versus GFP: 849 DEGs with q< 0.10; (ii) TAG versus OT1: 2,347 DEGs with q< 0.05; and (iii) wild-type versus knockout: 679 DEGs with q< 0.05.
Pathway and GO term enrichment analyses.
Gene set enrichment analyses were done using GSEA39 on RPKM values against a gene set permutation (the seed was set to 149).
Heat maps.
Heat maps were created using log2(counts per million) of genes identified as differentially expressed by DESeq2 (adjusted P< 0.05 unless otherwise noted). Rows were centred and scaled using _z_-scores.
ATAC-seq.
ATAC-seq data5 were downloaded from GEO (accession GSE89308). These datasets were processed in the same manner as the newly generated datasets described in this study.
Alignment and identification of open chromatin regions.
The data was processed following the recommendations of the ENCODE consortium (The ENCODE Consortium ATAC-seq Data Standards and Prototype Processing Pipeline https://www.encodeproject.org/atac-seq/). Reads were aligned to the mouse reference genome (version GRCm38) with BWA-backtrack40. Post-alignment filtering was done with samtools and Picard tools to remove unmapped reads, improperly paired reads, non-unique reads, and duplicates (ref. 41 and Broad Institute Picard http://broadinstitute.github.io/picard/ (2015)). To identify regions of open chromatin represented by enrichments of reads, peak calling was performed with MACS242. For every replicate, the narrowpeak results of MACS2 were used after filtering for adjusted P< 0.01.
Differentially accessible regions.
Regions where the chromatin accessibility changed between different conditions were identified with diffBind (DiffBind: Differential Binding Analysis of Chip-Seq Peak Data https://bioconductor.org/packages/release/bioc/html/DiffBind.html (2011)) with the following options: minOverlap=4, bUseSummarizeOverlaps=T, minMembers=2, bFullLibrarySize=TRUE. A total of 12,166 differentially accessible peaks were identified between wild-type and knockout TCRTAG cells (see Fig. 4); 19,071 differentially accessible peaks were identified between TCRTAG and TCROT1 cells (see Fig. 2).
Coverage files.
Individual coverage files per replicate normalized for differences in sequencing depths between the different samples were generated with bamCoverage of the deepTools suite42 using the following parameters: -bs 10 --normalizeUsing RPGC --effectiveGenomeSize 2150570000 --blackListFileName mm10. blacklist --ignoreForNormalization chrX chrY --ignoreDuplicates --minFragmentLength 40 -p 1. To create merged coverage files of replicates of the same condition, we used multiBigwigSummary to obtain the sequencing-depth-normalized coverage values for 10 bp bins along the entire genome, that is, for every condition, we obtained a table with the coverage values in every replicate within the same bin. Subsequently, we chose the mean value for every bin to represent the coverage in the resulting ‘merged; file (see github.com/friedue/Scott2019 for the code that was used). Merged coverage files were used for display in IGV and for heatmaps.
Heat maps.
Heat maps displaying the sequencing-depth-normalized coverage from different ATAC-seq samples were generated with computeMatrix and plotHeatmap of the deepTools suite43.
Every row corresponds to a single region that was determined to be differentially accessible when comparing either TCRTAG (TAG) to TCROT1 (OT1) T cells or wild-type to TOX-knockout TCRTAG T cells. The plots display the centre of each differentially accessible peak region ± 1 kb; the colour corresponds to the average normalized coverage across all replicates of the respective condition. Gene labels indicate genes that overlapped with a given differentially accessible region (anywhere along the gene).
Combining RNA-seq and ATAC-seq data.
The relationship between RNAseq and ATAC-seq was explored via ‘diamond’ plots for select genes detected as differentially expressed via DESeq2. Each gene was represented by a stack of diamond-shaped points coloured by the associated chromatin state of the gene (blue indicating closing and red indicating opening). The bottom-most point in each stack corresponds to the log2-transformed fold change in expression for that gene.
NFAT1 ChIP–seq (publicly available).
NFAT1 ChIP–seq samples were generated as previously described21 from cells expressing endogenous NFAT1 (wild type) or lacking NFAT1 (knockout). Cells lacking endogenous NFAT1 were transduced with an empty GFP vector (mock) or with a vector containing a mutated form of NFAT (CA-RIT-RV). Either cell type was either left resting (none) or stimulated with PMA and ionomycin (P + I) for 1 h.
We downloaded the sequencing results (fastq files generated by SOLiD sequencing technology) from the Sequence Read Archive (GEO series GSE64407); see Supplementary Table 4 for further details. SOLiD adapters had to be trimmed off, which we did with cutadapt44 specifying --format=sra-fastq --minimum-length 15 --colorspace and the sample specific adapter sequences via -g and -a (see https://ars.els-cdn.com/content/image/1-s2.0-S1074761315000321-mmc6.xlsx for the sample-specific adapters). The trimmed reads were subsequently aligned to the mouse genome version GRCm38 with bowtie1 using the colorspace option45. Coverage tracks normalized for differences in sequencing depths were be generated with bamCoverage of the deepTools suite (v.3.1.0)42 using the following parameters: -bs 10 --normalizeUsing RPGC --effectiveGenomeSize 2150570000 --blackListFileName mm10.blacklist --ignoreForNormalization chrX chrY --ignoreDuplicates --minFragmentLength 40 -p 1.
Blacklisted regions were downloaded from https://sites.google.com/site/anshulkundaje/projects/blacklists.
Regions of statistically significant read enrichments in the ChIP samples compared with the corresponding input samples (peaks) were identified with MACS2 (2.1.1.20160309)42 using ChIP and corresponding input files and the following parameters: -g 1.87e9 -p 0.01 --keep-dup all. For final peak files, the narrowpeak outputs of MACS2 were used, keeping only peaks with adjusted P values below 0.01.
Digital droplet PCR.
TOX–GFP-overexpressing and GFP-overexpressing TCRTAG T cells were sorted directly into TRIzol (Invitrogen). RNA was extracted with chloroform. Isopropanol and linear acrylamide were added, and the RNA was precipitated with 75% ethanol. Samples were resuspended in RNase-free water. Quantity was assessed by PicoGreen (ThermoFisher) and quality by BioAnalyzer (Agilent). Droplet generation was performed on a QX200 ddPCR system (BioRad; 864001) using cDNA generated from 100 pg total RNA with the One-Step RT-ddPCR Advanced Kit for Probes (Bio-Rad; 1864021) according to the manufacturer’s protocol with reverse transcription at 42 °C and annealing/extension at 55 °C. Each sample was evaluated in technical duplicates. Reactions were partitioned into a median of approximately 30,000 droplets per well. Plates were read and analysed with the QuantaSoft sotware to assess the number of droplets positive for the gene of interest, reference gene (Gapdh; dMmuCPE5195283), both, or neither. PrimePCR ddPCR Expression Probe Assays were ordered through Bio-Rad for the following genes of interest: Lag3 (dMmuCPE5122546), Id2 (dMmuCPE5094018), Prdm1 (dMmuCPE5113738), Prf1 (dMmuCPE5112024), and Gzmb (dMmuCPE5093986).
Data reporting.
No statistical methods were used to predetermine sample size. The investigators were not blinded to allocation during experiments and outcome assessment, and experiments were not randomized.
Reporting summary.
Further information on research design is available in the Nature Research Reporting Summary linked to this paper.
Extended Data
Extended Data Fig. 1 |. T cell differentiation during tumorigenesis.
a, Scheme of autochthonous liver cancer model to investigate tumour-specific CD8 T cell differentiation and dysfunction. AST×Cre liver cancer model. Cre-mediated deletion of the flox-stop cassette leads to TAG expression and tumour initiation. TAG-specific CD8 T cells isolated from TCRTAG transgenic mice recognize TAG epitope I (shown in red) on major histocompatibility complex (MHC) class I H-2Db. Tamoxifen-inducible Cre-ERT2 (AST×Cre-ERT2) or constitutive Alb-Cre (AST×Alb-Cre) mouse strains are used as indicated. b, Top, scheme of Listeria infection. Bottom, phenotypic characterization of Thy1.1+ effector and memory TCRTAG cells isolated from spleens 7 and more than 35 days after transfer into B6 mice followed by Listeria infection. Gating strategy is shown. KLRG1, CD127, CD44 and CD62L expression levels are shown. c, Naive congenically marked (Thy1.1+) TCRTAG CD8 T cells were adoptively transferred into (Thy1.2+) B6 mice and immunized with TAG-expressing Listeria strain, or were transferred into tumour-bearing (Thy1.2+) AST×Alb-Cre mice. T cells were isolated 7 or more than 20 days after transfer from either spleens (for effector and memory T cells after Listeria infection) or liver tumour lesions of AST×Alb-Cre mice. TOX expression was assessed by flow cytometry. TOX isotype is shown as a control for each sample. Naive TCRTAG cells are shown in grey as a control. d, Flow cytometric analysis of TCRTAG cells isolated from liver lesions of AST×Cre-ERT2 mice more than 20 days after transfer (red). TOX expression with PD-1, LAG-3, 2B4, CD39, TIGIT, TIM-3, CD101, CD38, CTLA4 and TCF-1 expression levels are shown. Naive TCRTAG cells are shown in grey as a control. e–g, Intracellular IFNγ and TNF production of TCRTAG cells isolated at days 7–10 and day 60 after transfer into AST×Cre-ERT2 mice after 4-h ex vivo peptide stimulation with antigen-presenting cells (APCs) (from B6 spleens) (e), or peptide stimulation with in vitro (f, top) or in vivo (f, bottom) LPS-activated splenocytes (f), or stimulation with PMA and ionomycin (g). LPS-mediated activation of APCs was confirmed by flow cytometric analysis assessing the upregulation of MHC-II, CD80, CD86 and CD40 on CD11c+ APCs, CD11b+ APCs and CD19+ B cells (splenocytes). Memory TCRTAG cells are shown as controls. Gates are set based on no-peptide controls. All FACS plots are gated on CD8+Thy1.1+ TCRTAG cells (experiments in f and g are repeated twice). These data are representative of more than ten independent experiments.
Extended Data Fig. 2 |. Antigen-specific CD8 T cell differentiation during acute and chronic viral LCMV infections, acute Listeria infection, and during tumorigenesis.
a, Top, experimental scheme for acute L. monocytogenes (expressing TAG epitope I) infection (green) and AST×Cre-ERT2 liver tumorigenesis after treatment with tamoxifen (red). Bottom, experimental scheme for acute (Armstrong; blue) and chronic (clone 13; orange) infection with LCMV. b, Expression profiles of TOX, PD-1, LAG-3 and TCF-1 at various time points after infection or tamoxifen treatment. Relative MFI values are shown normalized to naive transgenic TCRP14 T cells (specific for the LCMV epitope GP33) or naive TCRTAG T cells (dashed grey line). c, Top, flow cytometric analysis of TOX, TCF-1, PD-1, LAG-3, 2B4, TIM-3, CD39, TIGIT, CD38 and CTLA4 expression levels of TCRTAG T cells after Listeria infection (green) or tamoxifen treatment (red). Bottom, flow cytometric analysis of TOX, TCF-1, PD-1, LAG-3, 2B4, TIM-3 and CD39 expression levels of GP33-specific T cells at indicated time points after infections with LCMV Armstrong (blue) and LCMV clone 13 (orange). Naive T cells are shown in grey as a control. Data are mean ± s.d. and are representative of two independent experiments with n = 2 (Listeria) and n = 2–3 (AST×Cre-ERT2; LCMV Armstrong; LCMV clone 13) mice per time point.
Extended Data Fig. 3 |. Phenotypic and functional characterization of TILs from mouse and human tumours.
a–c, TCRTRP2 (TRP2) and TCRPMEL (PMEL) TILs in mouse B16 melanoma tumours. a, TOX expression and TCF-1, PD-1, LAG-3, CD39, 2B4 and TIM-3 expression levels of TRP2 (Thy1.1+) TILs (red; top) and PMEL (Thy1.1+) TILs (red; bottom) isolated more than 15 days after adoptive transfer from established B16 melanoma tumours growing subcutaneously in B6 (Thy1.2+) mice. Naive CD8 T cells are shown in grey as a control. T cells are gated on CD8+Thy1.1+ cells. b, Intracellular IFNγ and TNF production of TRP2 and PMEL TILs after 4-h peptide stimulation ex vivo. c, Relative MFI values of TOX, TCF-1 and PD-1 of the indicated tumour models and TIL specificities shown on a log10 scale. Each symbol represents an individual mouse. Data are mean ± s.e.m of n = 2 (PMEL); n = 4 (TRP2); and n = 5 (TAG) mice, and are representative of two independent experiments. d–g, Phenotypic characterization and TOX expression profiles of human TILs and PBMCs isolated from patients with melanoma, lung, breast and ovarian cancer. d, Flow cytometric analysis of PBMCs and TILs of patients with breast cancer. TOX expression of TILs and matched PBMC CD8+ T cells. Gating strategy is shown. CD45RO+PD-1hiCD39hi (TILs; red), CD45RO+PD-1hi (PBMCs; blue), CD45RO+PD-1lo (PBMCs; green), and CD45RA+CD45RO− (naive PBMCs; grey). TOX isotypes are shown as controls for each sample. e, Top, TOX expression in human CD45RO+PD-1loCD39lo (dark blue) and CD45RO+PD-1hiCD39hi (red) TILs isolated from human primary melanoma. Isotypes are shown and data correspond to Fig. 1f. Bottom, TOX expression of TILs and matched PBMC CD8+ T cells from patients with melanoma. CD45RO+PD-1hi (TIL; red; n = 4), CD45RO+PD-1hi (PBMCs; blue, n = 4). TOX isotypes are shown as controls for each sample/patient. Bar plot shows MFI values for TOX. Each symbol represents an individual TIL and PBMC matched pair. f, TOX expression in human PD-1hi TILs isolated from human primary ovarian tumours. Flow plots are gated on CD8+CD45RO+PD-1hi T cells (red). CD8+CD45RO+ T cells from healthy donors are shown in grey. Gating strategy is shown. Each symbol represents a patient or healthy donor sample. g, TOX, CD39, TIM-3 and LAG-3 expression of CD8+CD45RO+PD-1hi (red) and CD8+CD45RO+PD-1lo (blue) TILs from human melanoma (n = 5), breast (n = 5) and lung (n = 6) tumours. Each symbol represents an individual matched PD-1hi/PD-1lo patient sample. Data are mean ± s.e.m. *P ≤ 0.05, **P ≤ 0.01, ***P ≤ 0.001, two-sided Student’s _t_-test. ns, not significant.
Extended Data Fig. 4 |. Phenotypic, functional, transcriptional and epigenetic characterization of TCR TAG and TCROT1 cells in liver tumours.
a, Approximately 3 × 10⁴ TCRTAG (TAG, red; Thy1.1+) and TCROT1 (OT1, black; Ly5.1+) T cells were transferred into wild-type B6 mice or liver tumour-bearing AST×Alb-Cre mice and immunized with 5 × 10⁶ CFU of _Listeria Lm_TAG-I-OVA. Three to four weeks after immunization, livers from AST×Alb-Cre mice and spleens from B6 mice were analysed for the presence of donor TAG and OT1 T cells by FACS; the percentages of CD8 T cells are shown. Expression of CD62L, CD44, CD69 and Ki67 of TAG and OT1 T cells. Naive T cells are shown in grey as a control. CD107 expression after 4-h TAG or OVA peptide stimulation of TAG and OT1 TILs isolated 3–4 weeks after transfer. Flow plots are gated on CD8+Thy1.1+ and CD8+Ly5.1+ cells. Data are representative of three independent experiments. b, Heat map of RNA-seq-normalized expression values (log2(counts per million)) across all samples (colour corresponds to _z_-scores) for genes differentially expressed between TAG and OT1 T cells (FDR < 0.05). **c**, GSEA of RNA-seq data generated from TAG and OT1T cells isolated from AST×Cre liver lesions 3 weeks after adoptive transfer and _Listeria_ infection. Gene sets used: T cell exhaustion during chronic viral infection20 (GEO accession GSE30962) and mutant/constitutivelyactive form of NFAT1-overexpressing CD8 T cells21. NES, normalized enrichment score. **d**, Venn diagrams showing the numbers and percentage of significantly opening (left) and closing (right) peaks between TAG and OT1 T cells (FDR < 0.05, log2-transformed fold change > 2). e, Genome browser view of ATAC-seq signal intensities of TAG and OT1 T cells at Pdcd1, Entpd1, Cd38 and Cd244 loci. Red or blue boxes indicate peaks that become significantly more accessible or inaccessible in TAG versus OT1 T cells, respectively. ATAC-seq peaks from naive TAG T cells are shown in grey as a control. f, Chromatin accessibility heat map for TAG and OT1 T cells. Each row represents one peak (differentially accessible between TAG and OT1 T cells; FDR < 0.05) displayed over a 2-kb window centred on the peak summit; regions were clustered using _k_-means clustering. Genes associated with individual clusters are highlighted.
Extended Data Fig. 5 |. Chromatin accessibility of the mouse and human Tox locus.
a, Accessibility of TOX and TCF7 loci in human tumour-infiltrating PD-1hiCD8+ T cells. ATAC-seq signal profiles of TOX (left) and TCF7 (right) in naive CD8+CD45RA+ (grey), CD8+CD45RO+CD62L+ central memory T cells (green) and CD8+CD45RO+PD-1hi TILs isolated from patients with melanoma and lung cancer (red). Red or blue boxes, respectively, indicate peaks that become accessible or inaccessible in PD-1hi TILs as compared to naive or memory T cells. Naive and memory T cells were isolated from PBMCs of healthy donors. b, c, NFAT1 binds to differentially accessible regions in the Tox locus in mice and pharmacological targeting of NFAT1 reduces TOX expression. b, Genome browser view of the Tox locus and numerous ATAC-seq and ChIP–seq tracks. On top, ATAC-seq signals of naive (N; grey), effector (E5, E7; green), memory (M; green), dysfunctional liver tumour-infiltrating TCRTAG cells (blue series, with D indicating the days after transfer when T cells were isolated from liver lesions) are shown. These data are from ref. 5. These are followed by newly generated ATAC-seq data from TCRTAG (TAG; orange) and TCROT1 (OT1; green) cells from AST×Cre liver lesions (as described in Fig. 2) as well as NFAT1 ChIP–seq tracks generated previously22 representing wild-type NFAT1 (blue) and mutant/constitutive active NFAT1-overexpressing T cells (red) (with and without stimulation). The vertical bars at the bottom of the plot represent statistically significantly enriched NFAT1-binding sites (peaks) as well as regions with statistically significantly changing accessibility between ATAC-seq of OT1 and TAG T cells. Red stars and pink boxes highlight NFAT1-binding sites that overlap with regions of increased chromatin accessibility in dysfunctional TCRTAG compared to TCROT1 cells. c, Pharmacological targeting of NFAT signalling decreases TOX expression in vivo. Naive TCRTAG (Thy1.1+) cells were transferred into AST×Cre-ERT2 (Thy1.2+) mice, which were treated with tamoxifen (Tam) 1 day later. At days 2–9, mice were treated with the calcineurin inhibitor FK506 (2.5 mg per kg per mouse; blue, n = 3) or PBS (control group; black, n = 3). At day 10, TCRTAG cells were isolated from livers and assessed for expression of CD44, TOX, PD-1 and TCF-1. Linear regression analysis of MFI values are shown. Naive TCRTAG cells are shown in grey as a control (n = 1). Each symbol represents an individual mouse. _R_2= 0.6886 (TOX/TCF-1); _R_2 = 0.947 (TOX/PD-1); data are representative of two independent experiments. Dotted lines represent 95% confidence interval.
Extended Data Fig. 6 |. Ectopic expression of TOX in T cells in vitro induces a molecular signature of T cell exhaustion.
a, Gating strategy for TOX–GFP-expressing (blue) and GFP-expressing (green) TCRTAG cells, and their corresponding TOX expression levels. TOX isotypes are shown for each sample. Naive TCRTAG cells adoptively transferred into AST×Cre mice and isolated from liver tumours after transfer (red), and naive TCRTAG cells (grey) are shown as controls. Inset numbers show MFI values. b, Heat map of RNA-seq expression values (row normalized log2(counts per million)) for genes differentially expressed between TOX–GFP and GFP TCRTAG cells (FDR < 0.10). c, Relative expression of selected genes as determined by digital droplet PCR. Data show raw droplet counts normalized to the housekeeping gene, Gapdh; n = 2 (TOX– GFP, GFP). d, Flow cytometric analysis of PD-1, 2B4, CD160, CD39 and TIM-3 expression levels of TOX–GFP (n = 3) or GFP (n = 3)-expressing TCRTAG cells. e, FACS analysis of TOX expression (left) on day 6 after spinfection of TCRTAG cells transduced with TOX–GFP (n = 2) or GFP (n = 2), and cytokine production (right) after 4-h peptide stimulation. f, Percentage of Ki67+ cells (top), and GZMB+ cells (with or without 4-h peptide stimulation) (bottom) in TCRTAG cells transduced with TOX–GFP (blue, n = 3) or GFP (green, n = 3). Naive TCRTAG cells are shown in grey as a control (n = 1). Data are mean ± s.e.m and representative of two independent experiments (n = 3 per experiment, with n representing a biological replicate/individual transduced spleen). *P ≤ 0.05, **P ≤ 0.01, two-sided Student’s _t_-test. g, GSEA of TCRTAG cells transduced with TOX–GFP or GFP. T cell exhaustion gene sets used: tumour-specific T cell dysfunction5 (left), and T cell exhaustion during chronic viral infection20 (GEO accession GSE30962) (right). Corresponding heat maps with selected genes with significant enrichment scores are shown below.
Extended Data Fig. 7 |. Phenotypic and functional characterization of TOX wild-type and knockout TCRTAG mice.
a, Mouse strains generated and used in this study. We define wild type as littermate controls TCRTAG;dLck-Cre;Tox+/+ or TCRTAG;Tox fl/fl. We define knockout as TOX-deficient T cells from TCRTAG;dLck-Cre;Tox fl/fl mice. b, Thymocytes and peripheral CD8 T cells from knockout mice develop normally. CD4 and CD8 flow staining of thymocytes isolated from knockout (red, n = 5) or littermate controls (grey, n = 3). TCR Vβ7 and CD44 expression, and enumeration of single-positive CD8+ thymocytes from knockout and wild-type mice. c, Enumeration of total splenocytes (n = 5) and CD8+ splenocytes (n = 4) of knockout and wild-type mice. d, e, TOX is not required for effector and memory CD8 T cell differentiation during acute Listeria infection. d, Approximately 1 × 10⁵ congenically marked naive wild-type and knockout TCRTAG T cells were adoptively transferred into B6 mice, and infected with Listeria 1 day later. Flow cytometric analysis of CD44, CD62L, CD127 and KLRG1 expression directly ex vivo (inset numbers show percentage in respective quadrants) of wild-type and knockout effector TCRTAG cells isolated from spleens of _Lm_TAG-immunized B6 mice 7 days after immunization. e, Flow cytometric analysis of CD44, CD62L, CD127 and KLRG1 expression of wild-type and knockout memory TCRTAG cells isolated from spleens of _Lm_TAG-immunized B6 mice 3 weeks after immunization. Right, intracellular IFNγ and TNF production after 4-h ex vivo TAG peptide stimulation of wild-type (n = 4) and knockout (n = 4) memory TCRTAG T cells. Flow plots are gated on CD8+Thy1.1+ cells. Data are representative of at least three independent experiments. f–i, Phenotypic and functional characterization of TOX wild-type and knockout TCRTAG cells differentiating in developing liver tumours of AST×Cre mice. f, Top, CD44, CD69, CD25 and PD-1 expression and CellTrace Violet (CTV) dilution of adoptively transferred, CTV-labelled naive wild-type (black) or knockout (red) TCRTAG cells isolated from livers of AST×Cre mice 3 days after transfer. Data are representative of three independent experiments. Middle, expression of CD44 and proliferation (CTV dilution) of wild-type (black) or knockout (red) TCRTAG cells isolated from AST×Cre liver lesions 5 days after transfer. CTV-labelled TCRTAG cells transferred into B6 control mice are shown in grey as controls transferred and isolated at the same time points. Bottom, PD-1 and LAG-3 expression together with TOX expression of wild-type and knockout TCRTAG cells isolated from the livers of AST×Cre mice 8 days after transfer. All FACS plots are gated on CD8+ and Thy1.1+. g, Flow cytometric analysis of intracellular IFNγ and TNF production (top), CD107 degranulation (middle), and GZMB expression (bottom) of day 7–10 wild-type (black) or knockout (red) TCRTAG cells after 4-h peptide stimulation. h, i, PMA and ionomycin stimulation (h) or 4-h peptide stimulation using in vivo LPS-activated APCs (i). Each sample is gated on its respective no-peptide control. All flow plots are gated on CD8+Thy1.1+ T cells. Data are representative of three independent experiment and shown as mean ± s.e.m. P values determined by two sided Student’s _t_-test.
Extended Data Fig. 8 |. TOX wild-type and knockout TCRTAG cells reveal differences in genes and proteins associated with apoptosis.
a, Flow cytometric analysis of PD-1 (n = 3 (KO); n = 5 (WT)), LAG-3 (n = 4 (KO); n = 5 (WT)), CD38 (n = 4 (KO); n = 5 (WT)), 2B4 (n = 2 (KO); n = 3 (WT)), and TCF-1 (n = 4 (KO); n = 5 (WT)), expression levels in wild-type (black) or knockout (red) TCRTAG cells isolated from liver lesions approximately 3 weeks after adoptive transfer. Data are representative of at least three independent experiments. b, Flow cytometric analysis of TOX wild-type (black) and knockout (red) TCRTAG cells isolated 7–10 days after transfer from AST×Cre liver lesions. BIM, BCL-2 and BCL-xL expression levels were assessed directly ex vivo. Each pair of symbols represents an individual mouse (n = 4). Data are representative of two independent experiments. c, Flow cytometric analysis of active caspases 3 and 7 in TOX wild-type (black) and knockout (red) TCRTAG cells. These data are combined results of two experiments (n = 11). Each pair of symbols represents an individual mouse. d, Representative histograms and quantification of annexin V+ wild-type (black, n = 3) and knockout (red, n = 3) TCRTAG cells isolated 7–10 days after transfer from AST×Cre liver lesions. e, GSEA of DEGs between TOX wild-type and knockout T cells. ‘Hallmark_apoptosis’ and ‘wikipathways_MM_apoptosis_WP254’ gene sets show normalized enrichment score (NES) of −1.52 and −1.1, respectively, and the corresponding heat maps of genes with significant enrichment scores are shown. Data are mean ± s.e.m. *P ≤ 0.05, **P ≤ 0.01, ***P ≤ 0.001, two-sided Student’s _t_-test.
Extended Data Fig. 9 |. TOX wild-type and knockout TCRTAG cells reveal transcriptional and chromatin accessibility changes.
a, Heat map of RNA-seq expression (row normalized log2(counts per million)) for genes differentially expressed between TOX wild-type and knockout TCRTAG cells (FDR < 0.05). **b**, GSEA between wild-type and knockout TCRTAG. T cell exhaustion gene sets used: tumour-specific T cell dysfunction5 (left) and T cell exhaustion during chronic viral infection20 (GEO accession GSE30962) (right). Selected genes with significant enrichment score are listed. **c**, Pie chart showing the proportions of reproducible ATAC-seq peaks in indicated regions for all peaks within the atlas. **d**, Venn diagrams showing the numbers and percentages of significantly opening (top) and closing (bottom) peaks between TOX wild-type and knockout TCRTAG cells (FDR < 0.05, log2-transformed fold change > 2). e, Gains and losses of regulatory elements for the top 100 most DEGs between TOX wild-type and knockout TCRTAG cells that were part of the gene set of tumour-specific T cell dysfunction5. The plot is divided into top and bottom 50 genes with the highest and lowest respective log2-transformed fold change of gene expression. Each gene is illustrated by a stack of diamonds, in which each diamond represents a region of high chromatin accessibility (peak) overlapping with the locus of the respective gene. Red diamonds denote peaks that are more accessible in wild-type (and less accessible in TOX KO) T cells; blue diamonds denote peaks that are more accessible in TOX knockout T cells. f, Molecular function (GO terms) enriched in genes associated with peaks that are more accessible in TOX knockout versus wild-type T cells. g, ATAC-seq signal profiles across the Pdcd1 and Entpd1 loci. Peaks less accessible in knockout TCRTAG cells are highlighted in red.
Extended Data Fig. 10 |. Comparison of functional TOXlow OT1 and dysfunctional TOX knockout T cells in tumours with proposed model on the role of TOX in tumour-specific CD8 T cell exhaustion and dysfunction.
a, DEGs of the TAG versus OT1 comparison (see Fig. 2) were compared with DEGs of the wild-type versus TOX-knockout comparison (see Fig. 4). There were 389 genes identified to be significantly differentially expressed in both (WT vs KO and TAG vs OT1). b, Heat map of normalized expression values (log2(counts per million)) across all samples (colour corresponds to _z_-scores) for these 389 genes. Selected genes of interest are highlighted. c, Proposed model on the role of TOX in tumour-specific CD8 T cell exhaustion and dysfunction. Top, antigen-specific T cells in solid tumours are continuously triggered with tumour antigen. Chronic TCR stimulation leads to NFAT-mediated expression of TOX. TOX induces a transcriptional and epigenetic program and phenotype associated with exhaustion, including the expression of numerous inhibitory receptors (for example, PD-1, LAG-3, 2B4, CD39 and CD38) and downregulation of transcription factors (such as TCF-1). The TOX-mediated exhaustion program prevents T cells from overactivation or overstimulation and activation-induced cell death. Bottom, TOX-deficient T cells do not upregulate inhibitory receptors, become overstimulated or overactivated, and eventually undergo activation-induced cell death. Despite their non-exhausted phenotype, TOX-deficient T cells are dysfunctional.
Supplementary Material
1531023_Supp_Tab4
1531023_Supp_Tab3
1531023_Supp_Tab1
1531023_Supp_Tab2
Acknowledgements
We thank the members of the Schietinger laboratory, S. Reiner and M. Li for discussions and technical help; R. Nadler for technical assistance; A. Hurwitz and N. Restifo for providing TRP2 transgenic mice; MSKCC Flow Cytometry Core, especially R. Gardner; Integrated Genomics Operation Core, especially A. Viale, N. Mohibullah, A. Farina and R. Patel. We thank the J. Sun laboratory and B. Moltedo (Rudensky laboratory) for providing LCMV strains. D.Z., A. Schietinger, M.D.H. and C.A.K. are members of the Parker Institute for Cancer Immunotherapy, which supports the MSKCC Cancer Immunotherapy Program. This work was supported by NIH-NCI grants DP2 CA225212, R00 CA172371 (to A. Schietinger), U54 CA209975, V Foundation for Cancer Research (to A. Schietinger), the Anna Fuller Foundation (to A. Schietinger), the William and Ella Owens Medical Research Foundation (to A. Schietinger), the Josie Robertson Young Investigator Award (to A. Schietinger), NIH-NCI grant K08 CA158069 (to M.P.), V Foundation Scholar Award (to M.P.), Serodino Family Adventure Allee Fund (to M.P.), the Parker Institute for Cancer Immunotherapy (C.A.K. and A. Schietinger), the Weill Cornell Medicine Core Laboratories Center (P.Z., F.D., D.B.), Francois Wallace Monahan Fellowship (to O.L.), NIH-NIAID U19 AI11143 (to M.S.G.), NIH-NIAID R01 AI054977 (to J.K.), the Damon Runyon Cancer Research Foundation CI-96-18 (to C.A.K.), NCI R33 CA22539 (to C.A.K.), the Manhasset Women’s Coalition Against Breast Cancer (to C.A.K.), the MSK Cancer Center Core Grant P30 CA008748. The Integrated Genomics Operation Core was supported by Cycle for Survival and the MarieJosée and Henry R. Kravis Center for Molecular Oncology.
Competing interests C.A.K. is a consultant and/or advisor to Aleta Biotherapeutics, Bellicum Pharmaceuticals, Bristol-Meyers Squibb, Cell Design Labs, G1 Therapeutics, Klus Pharma, Obsidian Therapeutics and Rxi Therapeutics. C.A.K. receives research funding unrelated to this work from Kite/Gilead. M.D.H. has received research funding from Bristol-Myers Squibb; is paid as a consultant to Merck, Bristol-Myers Squibb, AstraZeneca, Genentech/Roche, Janssen, Nektar, Syndax, Mirati, and Shattuck Labs; has received travel support/honoraria from AstraZeneca and BMS; a patent has been filed by MSK related to the use of tumour mutation burden to predict response to immunotherapy (PCT/US2015/062208), which has received licensing fees from PGDx. A. Snyder is a current employee and owns stock in Merck. D.Z. reports grants from Merck, and consulting fees from Merck, Synlogic Therapeutics, Trieza Therapeutics, and Tesaro. D.Z. owns a patent concerning the use of Newcastle Disease Virus for cancer therapy. M.S.G. is a paid consultant to Vedanta Biosciences and Takeda for work unrelated to this study. E.A.C. is a consultant to Pfizer, Novartis, Genentech/Roche, Cota, Heron Therapeutics, and Bristol-Myers Squibb; has received travel support/honoraria from Pfizer and Novartis; and receives research funding from Genentech/Roche unrelated to this work.
Footnotes
Online content
Any methods, additional references, Nature Research reporting summaries, source data, extended data, supplementary information, acknowledgements, peer review information; details of author contributions and competing interests; and statements of data and code availability are available at https://doi.org/10.1038/s41586-019-1324-y.
Data availability
All data generated and supporting the findings of this study are available within the paper. The RNA-seq and ATAC-seq data have been deposited in the Gene Expression Omnibus (GEO) under accession number GSE126974. Source Data are provided with the online version of the paper. Additional information and materials will be made available upon request.
References
- 1.Thommen DS & Schumacher TN T cell dysfunction in cancer. Cancer Cell 33, 547–562 (2018). [DOI] [PMC free article] [PubMed] [Google Scholar]
- 2.Baitsch L et al. Exhaustion of tumor-specific CD8+ T cells in metastases from melanoma patients. J. Clin. Invest. 121, 2350–2360 (2011). [DOI] [PMC free article] [PubMed] [Google Scholar]
- 3.Schietinger A et al. Tumor-specific T cell dysfunction is a dynamic antigen-driven differentiation program initiated early during tumorigenesis. Immunity 45, 389–401 (2016). [DOI] [PMC free article] [PubMed] [Google Scholar]
- 4.Mognol GP et al. Exhaustion-associated regulatory regions in CD8+ tumor-infiltrating T cells. Proc. Natl Acad. Sci. USA 114, E2776–E2785 (2017). [DOI] [PMC free article] [PubMed] [Google Scholar]
- 5.Philip M et al. Chromatin states define tumour-specific T cell dysfunction and reprogramming. Nature 545, 452–456 (2017). [DOI] [PMC free article] [PubMed] [Google Scholar]
- 6.Henning AN, Roychoudhuri R & Restifo NP Epigenetic control of CD8+ T cell differentiation. Nat. Rev. Immunol. 18, 340–356 (2018). [DOI] [PMC free article] [PubMed] [Google Scholar]
- 7.Stahl S et al. Tumor agonist peptides break tolerance and elicit effective CTL responses in an inducible mouse model of hepatocellular carcinoma. Immunol. Lett. 123, 31–37 (2009). [DOI] [PubMed] [Google Scholar]
- 8.Kaech SM & Cui W Transcriptional control of effector and memory CD8+ T cell differentiation. Nat. Rev. Immunol. 12, 749–761 (2012). [DOI] [PMC free article] [PubMed] [Google Scholar]
- 9.O’Flaherty E & Kaye J TOX defines a conserved subfamily of HMG-box proteins. BMC Genomics 4, 13 (2003). [DOI] [PMC free article] [PubMed] [Google Scholar]
- 10.Aliahmad P & Kaye J Development of all CD4 T lineages requires nuclear factor TOX. J. Exp. Med. 205, 245–256 (2008). [DOI] [PMC free article] [PubMed] [Google Scholar]
- 11.Aliahmad P, Seksenyan A & Kaye J The many roles of TOX in the immune system. Curr. Opin. Immunol. 24, 173–177 (2012). [DOI] [PMC free article] [PubMed] [Google Scholar]
- 12.Seehus CR et al. The development of innate lymphoid cells requires TOX-dependent generation of a common innate lymphoid cell progenitor. Nat. Immunol. 16, 599–608 (2015). [DOI] [PMC free article] [PubMed] [Google Scholar]
- 13.Page N et al. Expression of the DNA-binding factor TOX promotes the encephalitogenic potential of microbe-induced autoreactive CD8+ T cells. Immunity 48, 937–950 (2018). [DOI] [PMC free article] [PubMed] [Google Scholar]
- 14.Wherry EJ & Kurachi M Molecular and cellular insights into T cell exhaustion. Nat. Rev. Immunol. 15, 486–499 (2015). [DOI] [PMC free article] [PubMed] [Google Scholar]
- 15.Schietinger A & Greenberg PD Tolerance and exhaustion: defining mechanisms of T cell dysfunction. Trends Immunol. 35, 51–60 (2014). [DOI] [PMC free article] [PubMed] [Google Scholar]
- 16.Bloom MB et al. Identification of tyrosinase-related protein 2 as a tumour rejection antigen for the B16 melanoma. J. Exp. Med. 185, 453–459 (1997). [DOI] [PMC free article] [PubMed] [Google Scholar]
- 17.Overwijk WW et al. Tumor regression and autoimmunity after reversal of a functionally tolerant state of self-reactive CD8+ T cells. J. Exp. Med. 198, 569–580 (2003). [DOI] [PMC free article] [PubMed] [Google Scholar]
- 18.Li H et al. Dysfunctional CD8 T cells form a proliferative, dynamically regulated compartment within human melanoma. Cell 176, 775–789 (2019). [DOI] [PMC free article] [PubMed] [Google Scholar]
- 19.Simoni Y et al. Bystander CD8+ T cells are abundant and phenotypically distinct in human tumour infiltrates. Nature 557, 575–579 (2018). [DOI] [PubMed] [Google Scholar]
- 20.West EE et al. Tight regulation of memory CD8+ T cells limits their effectiveness during sustained high viral load. Immunity 35, 285–298 (2011). [DOI] [PMC free article] [PubMed] [Google Scholar]
- 21.Martinez GJ et al. The transcription factor NFAT promotes exhaustion of activated CD8+ T cells. Immunity 42, 265–278 (2015). [DOI] [PMC free article] [PubMed] [Google Scholar]
- 22.Macian F NFAT proteins: key regulators of T-cell development and function. Nat. Rev. Immunol. 5, 472–484 (2005). [DOI] [PubMed] [Google Scholar]
- 23.Man K et al. Transcription factor IRF4 promotes CD8+ T cell exhaustion and limits the development of memory-like T cells during chronic infection. Immunity 47, 1129–1141 (2017). [DOI] [PubMed] [Google Scholar]
- 24.Scott-Browne JP et al. Dynamic changes in chromatin accessibility occur in CD8+ T cells responding to viral infection. Immunity 45, 1327–1340 (2016). [DOI] [PMC free article] [PubMed] [Google Scholar]
- 25.Flanagan WM, Corthésy B, Bram RJ & Crabtree GR Nuclear association of a T-cell transcription factor blocked by FK-506 and cyclosporin A. Nature 352, 803–807 (1991). [DOI] [PubMed] [Google Scholar]
- 26.Jain J et al. The T-cell transcription factor NFATp is a substrate for calcineurin and interacts with Fos and Jun. Nature 365, 352–355 (1993). [DOI] [PubMed] [Google Scholar]
- 27.Staveley-O’Carroll K et al. In vivo ligation of CD40 enhances priming against the endogenous tumour antigen and promotes CD8+ T cell effector function in SV40 T antigen transgenic mice. J. Immunol. 171, 697–707 (2003). [DOI] [PubMed] [Google Scholar]
- 28.Wang Q, Strong J & Killeen N Homeostatic competition among T cells revealed by conditional inactivation of the mouse Cd4 gene. J. Exp. Med. 194, 1721–1730 (2001). [DOI] [PMC free article] [PubMed] [Google Scholar]
- 29.Wherry EJ et al. Molecular signature of CD8+ T cell exhaustion during chronic viral infection. Immunity 27, 670–684 (2007). [DOI] [PubMed] [Google Scholar]
- 30.Brockstedt DG et al. Listeria-based cancer vaccines that segregate immunogenicity from toxicity. Proc. Natl Acad. Sci. USA 101, 13832–13837 (2004). [DOI] [PMC free article] [PubMed] [Google Scholar]
- 31.Sinnathamby G et al. Priming and activation of human ovarian and breast cancer-specific CD8+ T cells by polyvalent Listeria monocytogenes-based vaccines. J. Immunother. 32, 856–869 (2009). [DOI] [PubMed] [Google Scholar]
- 32.Espinosa-Carrasco G et al. Systemic LPS translocation activates cross-presenting dendritic cells but is dispensable for the breakdown of CD8+ T cell peripheral tolerance in irradiated mice. PLoS ONE 10, e0130041 (2015). [DOI] [PMC free article] [PubMed] [Google Scholar]
- 33.Zhang N & Bevan MJ TGF-β signaling to T cells inhibits autoimmunity during lymphopenia-driven proliferation. Nat. Immunol. 13, 667–673 (2012). [DOI] [PMC free article] [PubMed] [Google Scholar]
- 34.Hartley SW & Mullikin JC QoRTs: a comprehensive toolset for quality control and data processing of RNA-seq experiments. BMC Bioinformatics 16, 224 (2015). [DOI] [PMC free article] [PubMed] [Google Scholar]
- 35.Wickham H ggplot2: Elegant Graphics for Data Analysis (Springer; New York, 2009). [Google Scholar]
- 36.Dobin A et al. STAR: ultrafast universal RNA-seq aligner. Bioinformatics 29, 15–21 (2013). [DOI] [PMC free article] [PubMed] [Google Scholar]
- 37.Liao Y, Smyth GK & Shi W featureCounts: an efficient general purpose program for assigning sequence reads to genomic features. Bioinformatics 30, 923–930 (2014). [DOI] [PubMed] [Google Scholar]
- 38.Harrow J et al. GENCODE: the reference human genome annotation for The ENCODE Project. Genome Res. 22, 1760–1774 (2012). [DOI] [PMC free article] [PubMed] [Google Scholar]
- 39.Subramanian A et al. Gene set enrichment analysis: a knowledge-based approach for interpreting genome-wide expression profiles. Proc. Natl Acad. Sci. USA 102, 15545–15550 (2005). [DOI] [PMC free article] [PubMed] [Google Scholar]
- 40.Li H & Durbin R Fast and accurate short read alignment with Burrows– Wheeler transform. Bioinformatics 25, 1754–1760 (2009). [DOI] [PMC free article] [PubMed] [Google Scholar]
- 41.Li H et al. The Sequence Alignment/Map format and SAMtools. Bioinformatics 25, 2078–2079 (2009). [DOI] [PMC free article] [PubMed] [Google Scholar]
- 42.Liu T Use model-based Analysis of ChIP–seq (MACS) to analyze short reads generated by sequencing protein–DNA interactions in embryonic stem cells. Methods Mol. Biol. 1150, 81–95 (2014). [DOI] [PubMed] [Google Scholar]
- 43.Ramírez F et al. deepTools2: a next generation web server for deep-sequencing data analysis. Nucleic Acids Res. 44, W160–165 (2016). [DOI] [PMC free article] [PubMed] [Google Scholar]
- 44.Martin Marcel. Cutadapt removes adapter sequences from high-throughput sequencing reads. EMBnet J. 17, 10–12 (2011). [Google Scholar]
- 45.Langmead B, Trapnell C, Pop M & Salzberg SL Ultrafast and memory-efficient alignment of short DNA sequences to the human genome. Genome Biol. 10, R25 (2009). [DOI] [PMC free article] [PubMed] [Google Scholar]
Associated Data
This section collects any data citations, data availability statements, or supplementary materials included in this article.
Supplementary Materials
1531023_Supp_Tab4
1531023_Supp_Tab3
1531023_Supp_Tab1
1531023_Supp_Tab2
