ZScore in Statistics | Definition, Formula, Calculation and Uses (original) (raw)
Last Updated : 12 Jul, 2025
**Z-Score in statistics is a measurement of how many standard deviations away a data point is from the mean of a distribution. A z-score of 0 indicates that the data point's score is the same as the mean score. A positive z-score indicates that the data point is above average, while a negative z-score indicates that the data point is below average.
It provides a way to compare individual data points across different distributions by standardizing the values, allowing for meaningful comparisons even when the original data sets have different means and standard deviations.
**What is Z-Score?
**Z-score, also known as the **standard score, tells us the deviation of a data point from the mean by expressing it in terms of standard deviations above or below the mean. It gives us an idea of how far a data point is from the mean. Hence, the Z-Score is measured in terms of standard deviation from the mean. For example, a **Z-score of 2 indicates the value is 2 **standard deviations away from the mean. To use a z-score, we need to know the population mean (μ) and also the population standard deviation (σ).
**Z-score is a statistical measure that describes a value's position relative to the mean of a group of values. It is expressed in terms of standard deviations from the mean. The Z-score indicates how many standard deviations an element is from the mean.
**Z-Score Formula
To calculate the z- score for any given data we need the value of the element along with the mean and standard deviation. A z-score can be calculated using the following Z- score formula.
z = (X - μ) / σ
where,
- z = Z-Score
- X = Value of Element
- μ = Population Mean
- σ = Population Standard Deviation

**How to Calculate Z-Score?
We are given the population mean (μ), the population standard deviation (σ), and the observed value (x) by substituting these values in the z- score formula we can calculate the Z-Score value. Depending upon whether the given Z-Score is positive or negative, we can use positive Z-Table or negative Z-Table available online or on the back of your statistics textbook in the appendix.
**Example 1: You take the GATE examination and score 500. The mean score for the GATE is 390 and the standard deviation is 45. How well did you score on the test compared to the average test taker?
**Solution:
Following data is readily available in the above question statement
Raw score/observed value = X = 500
Mean score = μ = 390
Standard deviation = σ = 45
By applying the z-score formula ,
z = (X - μ) / σ
z = (500 - 390) / 45
z = 110 / 45 = 2.44
This means that your z-score is **2.44.
Since the Z-Score is positive 2.44, we will make use of the positive Z-Table.
Now let's take a look at Z Table (CC-BY) to know how well you scored compared to the other test-takers.
Follow the instruction below to find the probability from the table.
Here, **z-score = 2.44, which indicates that the data point is 2.44 standard deviations above the mean.
- Firstly, map the first two digits 2.4 on the Y-axis.
- Then along the X-axis, map 0.04
- Join both axes. The intersection of the two will provide you the cumulative probability associated with the Z-score value you're looking for
**[This probability represents the area under the standard normal curve to the left of the Z-score]
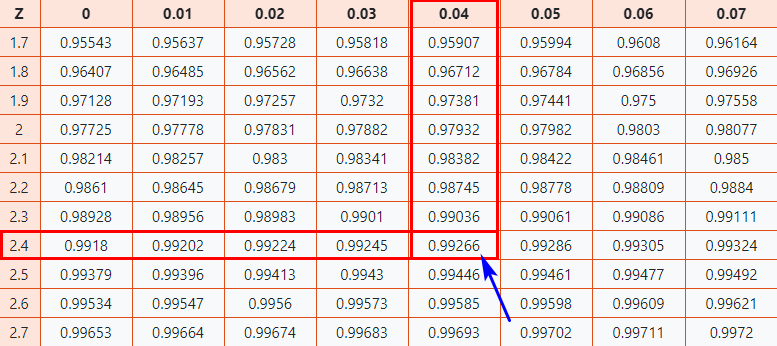
Normal distribution table
As a result, you will get the final value which is **0.99266.
Now, we need to compare how our original score of 500 on the GATE examination compares to the average score of the batch. To do that we need to convert the cumulative probability associated with the Z-score into a percentage value.
**0.99266 × 100 = 99.266%
Finally, you can say that you have performed well than almost **99% of other test-takers.
**Example 2: What is the probability that a student scores between 350 and 400 (with a mean score μ of 390 and a standard deviation σ of 45)?
**Solution:
Min score = X1 = 350
Max score = X2 = 400
By applying the z-score formula ,
z1 = (X1 - μ) / σ
z1 = (350 - 390) / 45
z1 = -40 / 45 = -0.88
z2 = (X2 - μ) / σ
z2 = (400 - 390) / 45
z2 = 10 / 45 = 0.22
Since z1 is negative, we will have to look at a negative Z-Table and find that cumulative probability p1, the first probability, is **0.18943.
z2 is positive, so we use a positive Z-Table which yields a cumulative probability p2 of **0.58706.
The final probability is computed by subtracting p1 from p2:
p = p2 - p1
p = 0.58706 - 0.18943 = 0.39763
The probability that a student scores between 350 and 400 is **39.763% (0.39763 * 100).
How to interpret Z- score
- **Z-Score = 0: A Z-score of 0 indicates that the data point is exactly at the mean of the distribution.
- **Positive Z-Score: A positive Z-score indicates that the data point is above the mean. For example, a Z-score of 1.5 means the data point is 1.5 standard deviations above the mean.
- **Negative Z-Score: A negative Z-score indicates that the data point is below the mean. For example, a Z-score of -2 means the data point is 2 standard deviations below the mean.
- **Magnitude of Z-Score: The magnitude of the Z-score shows how far away the data point is from the mean. A larger absolute value of the Z-score indicates that the data point is farther from the mean, while a smaller absolute value indicates it is closer.
- **Common Thresholds:
- **Z-Score > 2 or < -2: Often considered unusual or significant, indicating the data point is more than 2 standard deviations away from the mean.
- **Z-Score > 3 or < -3: Typically considered an outlier, suggesting the data point is extremely far from the mean.
Properties of Z-Score
- The magnitude of the Z-score reflects how far a data point is from the mean in terms of standard deviations.
- An element having a z-score of less than 0 represents that the element is less than the mean.
- Z-scores allow for the comparison of data points from different distributions.
- An element having a z-score greater than 0 represents that the element is greater than the mean.
- An element having a z-score equal to 0 represents that the element is equal to the mean.
- An element having a z-score equal to 1 represents that the element is 1 standard deviation greater than the mean; a z-score equal to 2, 2 standard deviations greater than the mean, and so on.
- An element having a z-score equal to -1 represents that the element is 1 standard deviation less than the mean; a z-score equal to -2, 2 standard deviations less than the mean, and so on.
- If the number of elements in a given set is large, then about 68% of the elements have a z-score between -1 and 1; about 95% have a z-score between -2 and 2; about 99% have a z-score between -3 and 3. This is known as the Empirical Rule, and it states the percentage of data within certain standard deviations from the mean in a normal distribution as demonstrated in the image below
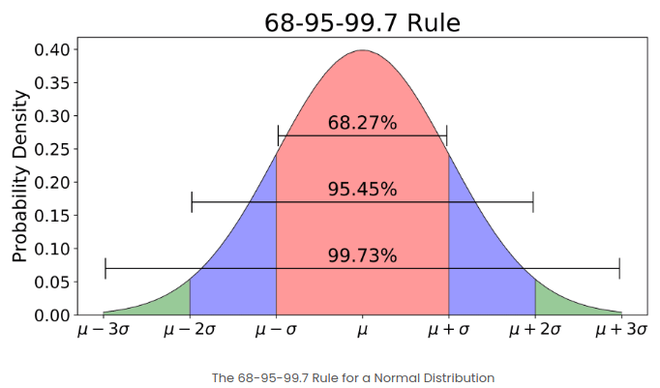
The empirical rule in Normal distribution
Calculate Outliers Using the Z-Score Value
We can calculate outliers in the data using the z-score value of the data points. The steps to consider an outlier data point are as :
- At first, we gather the dataset in which we want to see the outliers
- We will calculate the mean and standard deviation of the dataset, These values will be used to calculate the z-score value of each data point.
- We will calculate the z-score value for each data point. The formula for calculating the z-score value will be the same as
Z = \frac{{X - \mu}}{{\sigma}}
where X will be the data point, μ is the mean of the data, and σ is the standard deviation of the dataset. - We will determine the cutoff value for the z-score after which the data point could be considered as an outlier. This cutoff value is a hyperparameter that we decide depending on our project.
- A data point whose z-score value is greater than 3 means the data point does not belong to the 99.73 % point of the dataset.
- Any data point whose z-score is greater than our decided cutoff value will be considered an outlier.
**Also Check: **Z score for Outlier Detection - Python
Solved Examples on Z-score Formula
Example 1: Basic Z-score calculation
Mean (μ) = 70
Standard deviation (σ) = 5
Data point (x) = 80
Z-score formula: Z = (x - μ) / σ
Solution:
Z = (80 - 70) / 5
Z = 10 / 5
Z = 2
This means the data point is 2 standard deviations above the mean.
Example 2: Z-score with negative result
Mean (μ) = 100
Standard deviation (σ) = 15
Data point (x) = 85
Solution:
Z- score formula : Z = (x - μ) / σ
Z = (85 - 100) / 15
Z = -15 / 15
Z = -1
This means the data point is 1 standard deviation below the mean.
Example 3: What percentage of people have a lower IQ than this person having an IQ of 130 ?
**Mean IQ (μ) = 100, Standard deviation (σ) = 15, Person's IQ (x) = 130
Calculate Z-score:
Z = (130 - 100) / 15 = 2
Use a standard normal distribution table or calculator to find the area to the left of Z = 2.
Area = 0.9772
Convert to percentage:
97.72% of people have a lower IQ than this person.
Example 4: Finding the corresponding height for a given a Z-score
**Mean height (μ) = 170 cm, Standard deviation (σ) = 8 cm, Z-score = -1.5
Use the Z-score formula and solve for x:
-1.5 = (x - 170) / 8
-12 = x - 170
x = 158 cm
The height corresponding to a Z-score of -1.5 is 158 cm.
Example 5: Z-score in a dataset
A dataset of exam scores: 75, 82, 90, 68, 95
Calculate the Z-score for 82.
Step 1: Calculate the mean (μ)
μ = (75 + 82 + 90 + 68 + 95) / 5 = 82
Step 2: Calculate the standard deviation (σ)
σ = √[Σ(x - μ)² / (n-1)]
σ = √[((-7)² + 0² + 8² + (-14)² + 13²) / 4]
σ = √(466 / 4) = √116.5 ≈ 10.79
Step 3: Calculate the Z-score for 82
Z = (82 - 82) / 10.79 = 0
Explanation: The Z-score of 0 indicates that 82 is exactly at the mean of the dataset.
Example 6: Comparing scores from different distributions
**Alice scored 130 on an IQ test with μ = 100 and σ = 15
**Bob scored 28 on an aptitude test with μ = 20 and σ = 5
Who performed better relative to their test's distribution?
Alice's Z-score: Z_A = (130 - 100) / 15 = 2
Bob's Z-score: Z_B = (28 - 20) / 5 = 1.6
Explanation: Alice performed better relative to her test's distribution because her Z-score (2) is higher than Bob's (1.6).
Example 7: Using Z-score for probability Scores on a standardized test are normally distributed with μ = 500 and σ = 100 calculate the probability of scoring above 650?
Step 1: Calculate the Z-score for 650
Z = (650 - 500) / 100 = 1.5
Step 2: Find the area to the right of Z = 1.5 in a standard normal distribution table
Area = 1 - 0.9332 = 0.0668
Explanation: The probability of scoring above 650 is approximately 0.0668 or 6.68%.
Example 8: Z-score for sample means
A population has μ = 50 and σ = 10. We take samples of size n = 25.
Question: What's the Z-score for a sample mean of 53?
Step 1: Calculate the standard error of the mean
SE = σ / √n = 10 / √25 = 2
Step 2: Calculate the Z-score using the standard error
Z = (x̄ - μ) / SE = (53 - 50) / 2 = 1.5
Explanation: This Z-score tells us how many standard errors the sample mean is from the population mean. A Z-score of 1.5 indicates that the sample mean of 53 is 1.5 standard errors above the population mean.
Practice Problems on Z-score Formula
**Problems 1. In a normal distribution with a mean of 50 and a standard deviation of 10, what is the Z-score for a value of 65?
**Problems 2. A dataset has a mean of 100 and a standard deviation of 15. Calculate the Z-score for a value of 85.
**Problems 3. The weights of adult males in a population are normally distributed with a mean of 180 pounds and a standard deviation of 30 pounds. What weight corresponds to a Z-score of 1.5?
**Problems 4. IQ scores are normally distributed with a mean of 100 and a standard deviation of 15. What percentage of people have an IQ above 130?
**Problems 5. A company's employee satisfaction scores have a mean of 7.5 and a standard deviation of 1.2. If an employee's satisfaction score has a Z-score of -0.8, what is their actual score?
**Problems 6. In a normal distribution, what percentage of data falls between Z-scores of -1 and +1?
**Problems 7. A student scores 78 on a test where the mean is 70 and the standard deviation is 8. Calculate the student's Z-score.
**Problems 8. The heights of a group of plants are normally distributed with a mean of 25 cm and a standard deviation of 3 cm. What height corresponds to the 90th percentile?
**Problems 9. A dataset has the following values: 2, 4, 6, 8, 10. Calculate the Z-score for the value 8.
**Problems 10. A machine produces parts with a mean length of 15 cm and a standard deviation of 0.5 cm. If a part is considered defective when its Z-score is greater than 2 or less than -2, what are the acceptable length ranges for the parts?
Implementation of Z-Score in Python
We can use Python to calculate the z-score value of data points in the dataset. Also, we will use the numpy library to calculate mean and standard deviation of the dataset.
Python `
import numpy as np
def calculate_z_score(data):
Mean of the dataset
mean = np.mean(data)Standard Deviation of tha dataset
std_dev = np.std(data)Z-score of tha data points
z_scores = (data - mean) / std_dev
return z_scores
Example dataset
dataset = [3,9, 23, 43,53, 4, 5,30, 35, 50, 70, 150, 6, 7, 8, 9, 10] z_scores = calculate_z_score(dataset) print('Z-Score :',z_scores)
Data points which lies outside 3 standard deviatioms are outliers
i.e outside range of99.73% values
outliers = [data_point for data_point,
z_score in zip(dataset, z_scores) if z_score > 3]
print(f'\nThe outliers in the dataset is {outliers}')
`
**Output:
Z-Score : [-0.7574907 -0.59097335 -0.20243286 0.35262498 0.6301539 -0.72973781
-0.70198492 -0.00816262 0.13060185 0.54689523 1.10195307 3.32218443
-0.67423202 -0.64647913 -0.61872624 -0.59097335 -0.56322046]
The outliers in the dataset is [150]
Application of Z-Score
- **Feature Scaling: Z-scores are often used to standardize features so that they’re all on the same scale. This means each feature will have a mean of 0 and a standard deviation of 1, which helps certain machine learning algorithms (like k-nearest neighbors or support vector machines) work better by treating all features equally.
- **Spotting Outliers: Z-scores help identify outliers in your data. If a data point has a Z-score that’s really high or low (usually beyond +3 or -3), it might be considered an outlier because it's far from the average.
- **Anomaly Detection: Z-scores are also used to find anomalies - instances that don’t behave like the rest of the data. These could be rare or unexpected events that might need further investigation.
- **Standardizing Data: Z-scores standardize data, which means they adjust the data to a common scale (with a mean of 0 and standard deviation of 1).
- **Regression and Residuals: In regression models, we can use Z-scores to check the residuals (the differences between predicted and actual values). If the Z-scores of residuals are far from 0, it might indicate an issue with the model, like changing variance (called heteroscedasticity).
Z-Scores vs. Standard Deviation
| Z- Score | Standard Deviation |
|---|---|
| Transform raw data into a standardized scale. | Measures the amount of variation or dispersion in a set of values. |
| Makes it easier to compare values from different datasets because they take away the original units of measurement. | Standard Deviation retains the original units of measurement, making it less suitable for direct comparisons between datasets with different units. |
| Indicate how far a data point is from the mean in terms of standard deviations, providing a measure of the data point's relative position within the distribution | Expressed in the same units as the original data, providing an absolute measure of how spread out the values are around the mean |
**Check: **Z-Score Table
Applications of Z-Scores in Engineering
1. Standardization
Z-scores are used to standardize data, allowing comparison between different datasets with different units or scales.
2. Identifying Outliers
Z-scores help in detecting outliers in a dataset, which are values significantly higher or lower than the rest.
3. Statistical Testing
In hypothesis testing, Z-scores are used to determine the significance of results by comparing observed data to a standard normal distribution.
4. Quality Control
In manufacturing and quality control, Z-scores help monitor process performance and product quality by comparing measurements to specifications.
5. Finance
In finance, Z-scores are used in risk management and investment analysis to evaluate the relative performance of assets.
Why are Z-scores Called Standard Scores?
**Z-scores are also known as **standard scores because they standardize the value of a random variable. This means that the list of standardized scores has a mean of 0 and a standard deviation of 1.0. **Z-scores also **allow for the comparison of scores on different kinds of variables. This is because they use relative standing to equate scores from different variables or distributions.
Z-scores are frequently used to compare a variable to a standard normal distribution (with μ = 0 and σ = 1).
Related Articles:
Conclusion
**Z-score is an essential statistical tool that **provides a standardized measure of how a data point deviates from the mean of a distribution. Its is used in various fields, including finance, education, health, and engineering, making it a versatile method for data analysis. By transforming raw data into a standardized scale, Z-scores facilitate the **comparison of different datasets and the **identification of outliers. This standardization is crucial for statistical testing, quality control, and risk management. Understanding how to calculate and interpret Z-scores allows for more effective **data analysis and decision-making.