How to use Prometheus to Monitor Docker Containerized Applications (original) (raw)
Last Updated : 23 Jul, 2025
Containerization has transformed software development by providing portability and consistency through platforms like **Docker. Yet ensuring the health of those containerized applications requires monitoring. **Prometheus is a monitoring tool that uses its powerful features to monitor the application and make sure that the application is in good health. In this article first, you will understand what is, and then I will guide you through the steps to monitor your Docker container by using Prometheus.
What is Prometheus Exporter?
**Prometheus is an open-source **monitoring and **alerting toolkit, which collects time series data from various sources, allowing users to monitor and analyze metrics related to system performance. It also monitors resource utilization and application location.
What is Docker Prometheus Grafana?
- **Docker:Imagine it as a magic box containing all the parts that an app needs to function. It makes arranging apps simple and neat without creating any issues with your PC.
- **Prometheus: Think of it as an inquiring acquaintance who monitors the efficiency of your apps. It collects information about their internal states, such as their acceleration rate and level of overloading.
- **Grafana: This is comparable to a cool artist creating colorful graphs and visuals out of all the Prometheus data. It allows you to quickly assess how well your apps are functioning.
Steps to use Prometheus to Monitor Docker Applications
**Step 1: Setup Prometheus on Linux and Windows
- Install Prometheus on Ubuntu by using the below command. If you want the latest version, you can get a link from the official page.

- If you are using windows then use these commands to install Prometheus.

- Then you have to configure the daemon.json on Ubuntu . This will ensure docker daemon as a Prometheus target .
- In Ubuntu daemon.json is present in /etc/docker/ directory.
vi /etc/docker/daemon.json
{
"metrics-addr": "0.0.0.0:9323",
"experimental":true
}

- After editing the daemon.json you have to save and restart your docker service.
sudo service docker restart
If you are using docker desktop on windows then you first have to open Docker desktop and then edit docker engine file .
{
"builder": {
"gc": {
"defaultKeepStorage": "20GB",
"enabled": true
}
},
"experimental": true,
"metrics-addr": "0.0.0.0:9323"
}

Then you can save and restart the docker desktop .
What is Node Exporter and configure
A small application called Node Exporter is installed on your PC or server. It functions similar to a detective who is always monitoring the system and collecting information about things like CPU, RAM, disk space, and other things. subsequently, it propagates this data to Prometheus and other monitoring tools.
Setup Node Exporter (Optional)
Here are the steps to set up Node Exporter on Linux:
- **Download Node Exporter: Go to the Prometheus GitHub releases page and download the latest version of Node Exporter for Linux.
- **Extract the Downloaded File: Once downloaded, extract the Node Exporter file using a tool like tar.
- **Move Node Exporter to a Folder: Move the extracted Node Exporter folder to a location like /usr/local/bin/ for easy access.
- **Create a Service File: Create a service file for Node Exporter using a text editor like nano or vim. This file tells Linux how to manage Node Exporter.
- **Add Service Configuration: In the service file, specify the command to start Node Exporter.
- **Reload systemd and Start the Service: Reload systemd to recognize the new service file and start Node Exporter using systemctl commands.
- **Enable Auto-Start on Boot: Enable Node Exporter to start automatically whenever the system boots up.
- **Check Node Exporter Status: Verify that Node Exporter is running without errors by checking its status.
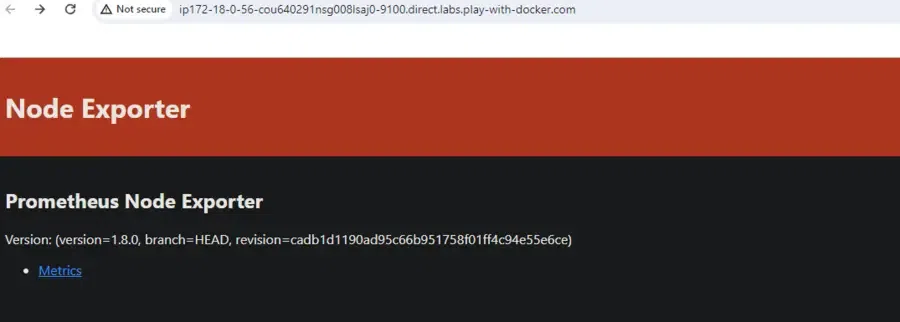
- **Access Metrics: You can now access Node Exporter metrics through a web browser using http://<your_server_ip>:9100/metrics.
**Run the Node Exporter Container: Node Exporter image, run the container with the following command:
docker run -d --name=node-exporter -p 9100:9100 prom/node-exporter
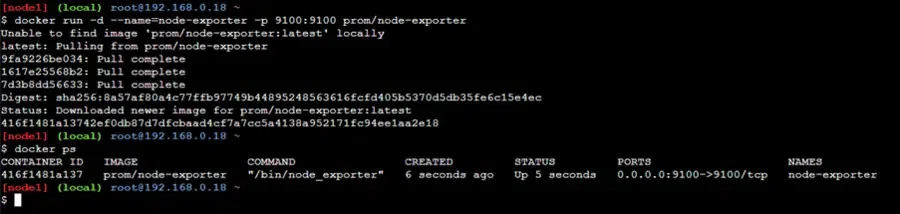
List the container by using the below command
docker ps
**Step 2: Scrape Container Metrics
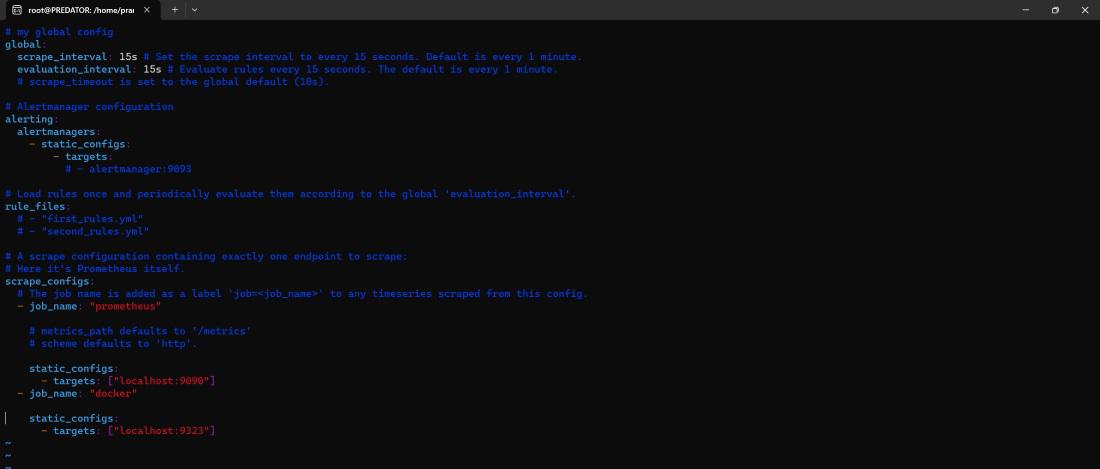
- **For Ubuntu Users: Edit the prometheus.yml to scrape all your container metrics from http://localhost:9323/metrics.
cd prometheus-2.48.1.linux-amd64
vi prometheus.yml
Here is the simple and sample scrap config file. Based on your requirements update the scrap config file.
global:
scrape_interval: 10s
scrape_configs:
- job_name: promethheus
static_configs:- targets:
- localhost:9090
- targets:
- job_name: docker
static_configs:- targets:
- localhost:9323
- targets:
- **For Windows Users: Edit the configuration file to scrape all your container metrics as shown in the below.
cd prometheus-2.49.1.windows-amd64
vi prometheus.yml

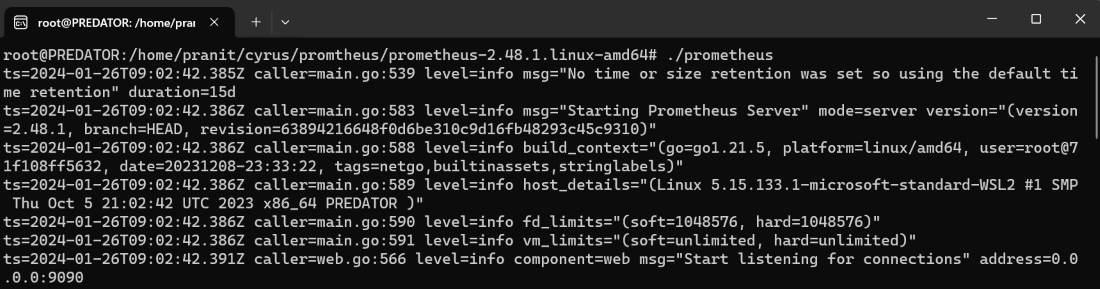
- **For Ubuntu Users: Now start the Prometheus server and connect it on.
./prometheus
- For Windows UsersBased**:** Now start the Prometheus server and connect it as shown in the image below.
./prometheus.exe

Step 3: Setup Alertmanager (Optional)
- **Download Alertmanager: Go to the Prometheus website and download the Alertmanager binary that matches your operating system. For Linux, you'll typically download a tarball.
- **Extract the Tarball: Once downloaded, extract the contents of the tarball to a location on your Linux system using the tar command. For example:
tar -xzf alertmanager-*.tar.gz
- **Configure Alertmanager: Inside the extracted directory, you'll find a configuration file named alertmanager.yml or alertmanager. yaml. Customize this file according to your requirements. You'll typically define the notification integrations (like email, Slack, etc.) and their configurations here.
- **Start Alertmanager: After configuring Alertmanager, you can start it by running the Alertmanager binary. You can do this from the directory where you extracted the tarball.
./alertmanager --config.file=alertmanager.yml
You may want to run Alertmanager as a background service or use tools like Systemd to manage it as a service.
- **Verify Alertmanager is Running: You can verify that Alertmanager is running by accessing its web interface. By default, it runs on port 9093. Open your web browser and navigate to http://localhost:9093 to access the Alertmanager interface. You should see the Alertmanager UI, indicating that it's up and running.
- **Integrate with Prometheus: Lastly, you need to configure Prometheus to send alerts to Alertmanager. This is typically done by configuring Prometheus's prometheus.yml file to include an alerting rule file (alerting.rules.yml), where you define the conditions for triggering alerts. In this file, specify the alertmanager_url parameter to point to your Alertmanager instance.
Step 4: Output
There are many metrics exposed in http://localhost:9323/metrics. You can choose any query and execute it on the Prometheus server. For example, to see the number of containers in stop state use this query "**engine_daemon_container_states_containers{state="stopped"}"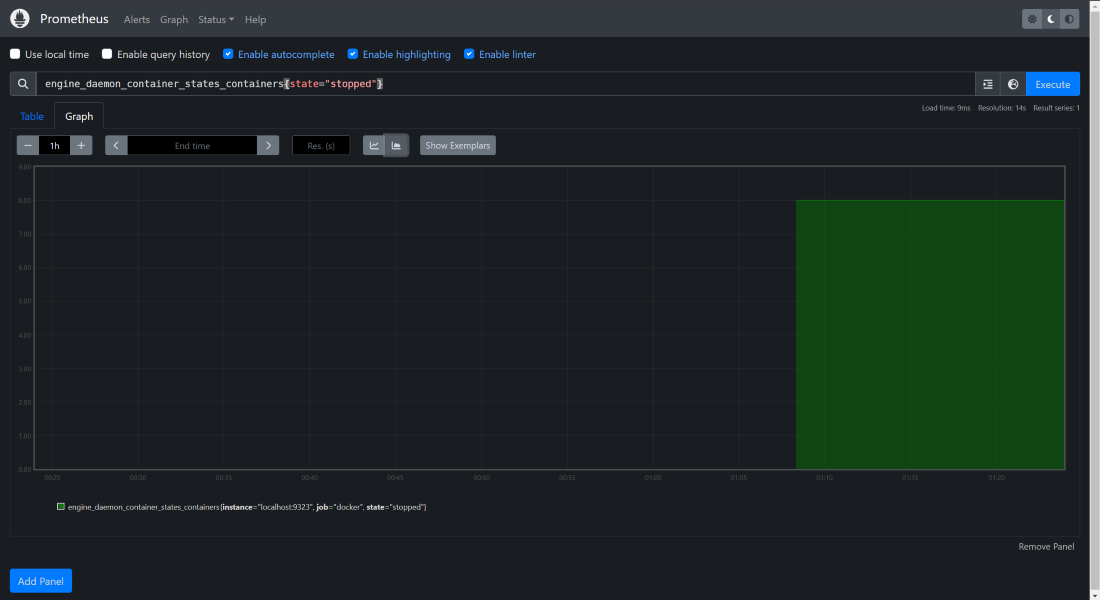
To know more about the Installation of Docker, Read this Article.
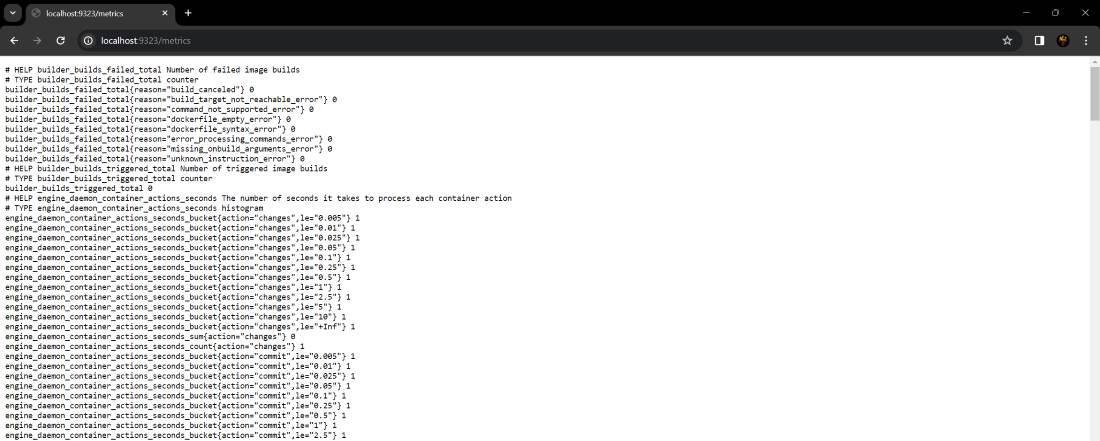
**Docker Metrics: We can visit this URL to see all the exposed metrics of your Docker service.
What is Push Gateway?
Consider Pushgateway as a metrics mailbox. Prometheus typically gathers metrics from your various services and machines on its own. Yet, some objects, like temporary jobs, are not always capable of sending measures directly to Prometheus.
Basically, Pushgateway acts as a mailbox for these jobs to deposit their measurements. Prometheus then visits, checks the mailbox and gets those metrics. In this manner, your monitoring system incorporates even difficult metrics from contract work!
People also Ask
| Article | Link |
|---|---|
| Installation of Docker on Ubuntu | Read |
| Installation of Docker on Windows | Read |
Conclusion
You have first understood what is Prometheus. Then you have then learned about how to install Prometheus and configure Prometheus to extract metrics from your Docker containers. At the end, you have also executed a PromQL query to see a number of containers in the stopped state. You have now successfully completed all the steps to use Prometheus to monitor docker containers.