Process Management Commands in Linux (original) (raw)
Last Updated : 22 Dec, 2025
Process management commands in Linux are used to monitor, control, and manage running processes on the system. These commands help users and administrators view active processes, control execution, analyze performance, and troubleshoot system behavior efficiently.
- Used to view running and background processes
- Helps control process priority and execution
- Monitors CPU, memory, and system performance
- Essential for system monitoring and troubleshooting
The following commands are used for process management in Linux.
1. accton
The accton command is used to enable or disable process accounting. It records information about processes executed on the system.
- Tracks process execution
- Used for auditing and monitoring
- Admin-level command
**Syntax:
accton file_name
**Example:
accton on

- This enables process accounting.
2. bg
The bg command is used to resume a stopped job in the background. It allows processes to continue running without blocking the terminal.
- Runs jobs in background
- Used with job control
- Improves multitasking
**Syntax:
bg job_id
**Example:
bg %1
- This resumes job 1 in the background.
3. chrt
The chrt command is used to set or view real-time scheduling attributes of a process. It controls process priority.
- Manages scheduling priority
- Used for real-time processes
- Advanced system command
**Syntax:
chrt [options] command
**Example:
To see the current scheduling policy:
- Firefox is running and to find its's pid we run the following command:
$ pidof -s firefox
- In my case the pid is 5794, here is the image

Now to retrieve the current scheduling policy and priority for the firefox process, use chrt in the following way:
$ chrt -p 5794

4. fg
The fg command brings a background job to the foreground. It allows interaction with the running process.
- Moves job to foreground
- Works with job control
- Used after bg
**Syntax:
fg job_id
**Example:
sleep 60 &
fg %3
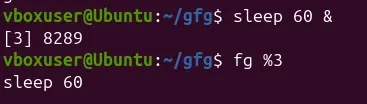
- This brings job 3 to the foreground.
5. kill
The kill command is used to send signals to processes. It is commonly used to terminate unresponsive processes.
- Stops running processes
- Sends signals to processes
- Essential for process control
**Syntax:
kill signal pid
**Example:
top
kill 1234
- top: Shows running processes along with their process IDs, CPU usage, and memory usage in real time.
- kill 1234: Terminates the process with the process ID 1234.
6. mpstat
The mpstat command displays CPU usage statistics for processors. It helps monitor system performance.
- Displays CPU performance
- Useful for performance analysis
- Part of sysstat package
**Syntax:
mpstat
**Example:
mpstat
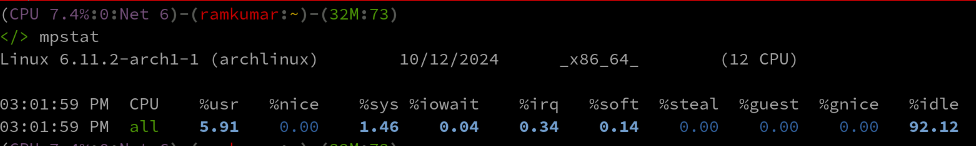
- This shows CPU usage details.
7. pidof
The pidof command displays the process ID of a running program. It helps locate processes quickly.
- Finds process ID
- Useful for scripting
- Simple and fast
**Syntax:
pidof process_name
**Example:
pidof bash
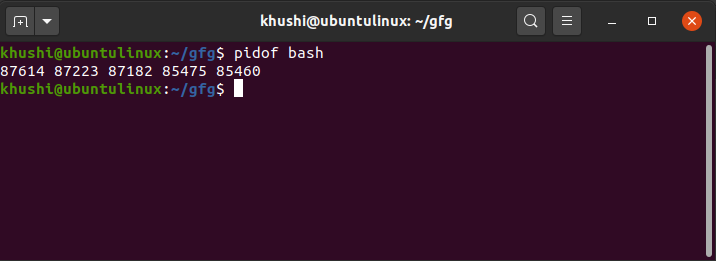
- This shows the PID of the bash service.
8. pmap
The pmap command displays the memory usage of a process. It helps analyze memory consumption.
- Shows memory map
- Useful for debugging
- Process analysis tool
**Syntax:
pmap pid
**Example:
pmap 9123

- This displays memory usage of the process.
9. ps
The ps command displays information about running processes. It shows process ID, status, and resource usage.
- Lists active processes
- Shows process details
- Common monitoring command
**Syntax:
ps
Example:
ps aux
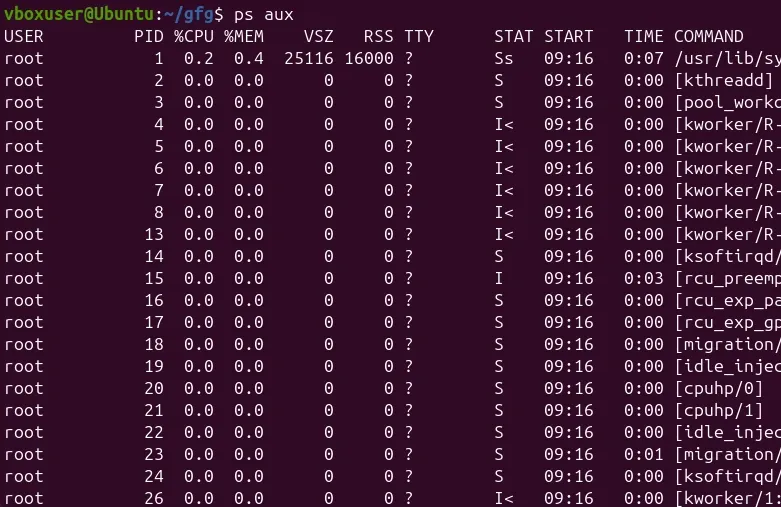
- This displays all running processes.
10. top
The top command provides a real-time view of running processes. It shows CPU and memory usage dynamically.
- Real-time monitoring
- Displays system load
- Interactive command
**Syntax:
top
**Example:
top
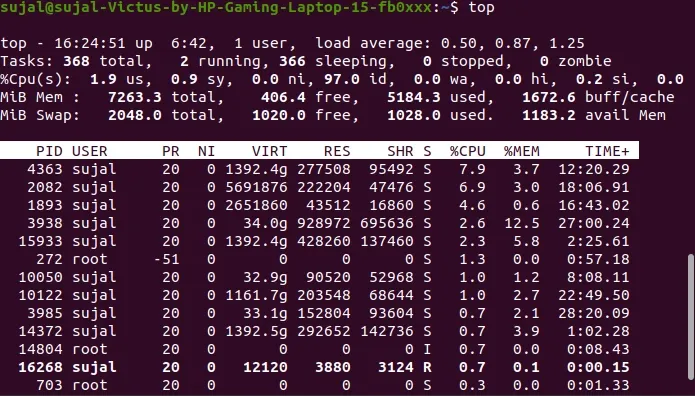
- This shows live process activity.
11. htop
The htop command is an enhanced version of top. It provides a more user-friendly and interactive interface.
- Colorful display
- Interactive process control
- Easier than top
**Syntax:
htop
**Example:
htop
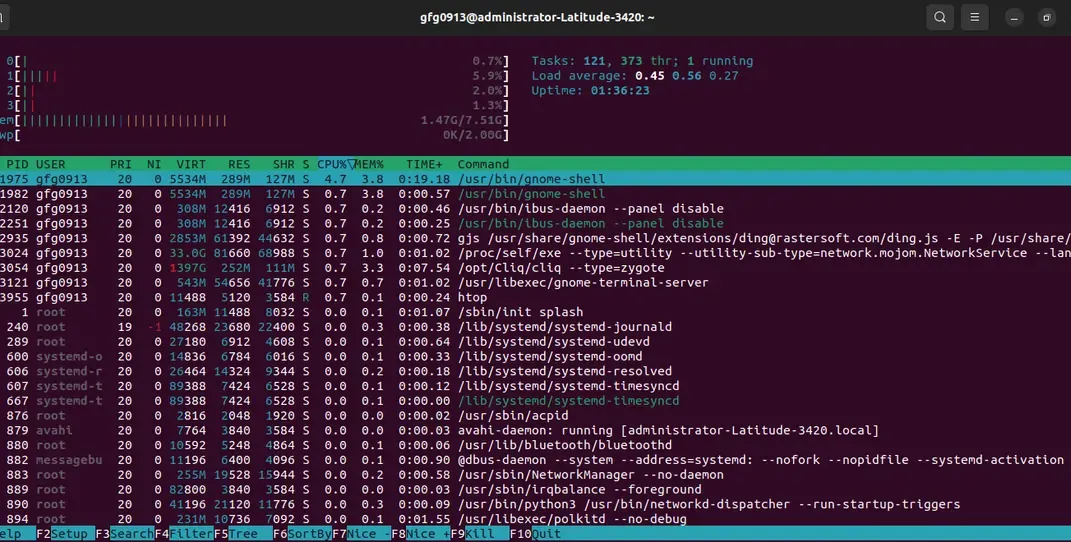
- This displays an interactive process viewer.
12. strace
The strace command traces system calls made by a process. It is useful for debugging applications.
- Traces system calls
- Used for debugging
- Advanced diagnostic tool
**Syntax:
strace command
**Example:
strace ls
- This traces system calls made by ls.
13. time
The time command measures how long a command takes to execute. It displays execution time and resource usage.
- Measures execution time
- Displays CPU usage
- Useful for performance testing
**Syntax:
time [options] command [arguments]
**Example:
time -p sleep 3
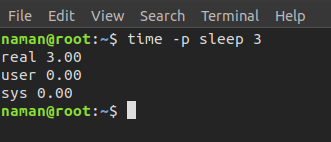
- **Real Time: The actual elapsed time, from start to finish, including time spent waiting for I/O and other processes.
- **User Time: The amount of CPU time spent executing user-mode instructions within the process.
- **System Time: The amount of CPU time spent executing system-level instructions on behalf of the process.
14. watch
The watch command runs a command repeatedly at fixed intervals. It is useful for monitoring changes.
- Repeats command output
- Used for monitoring
- Live updates
**Syntax:
watch [options] command
**Example:
watch -d free -m
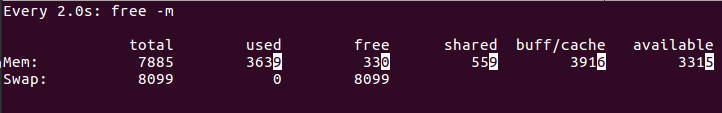
- It displays total RAM, used memory, free memory, shared memory, buffer/cache usage, available memory, and swap space status
15. vmstat
The vmstat command displays memory, CPU, and I/O statistics. It provides an overview of system performance.
- Shows system statistics
- Monitors memory usage
- Performance analysis tool
**Syntax:
vmstat
**Example:
vmstat
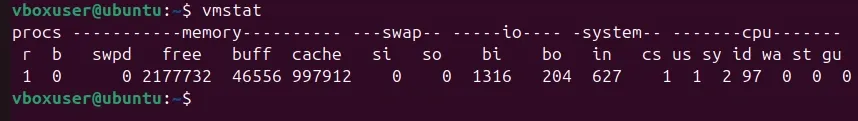
- This displays system resource usage.
16. uptime
The uptime command displays how long the system has been running. It also shows system load averages.
- Shows system running time
- Displays load average
- Quick system status check
**Syntax:
uptime
**Example:
uptime
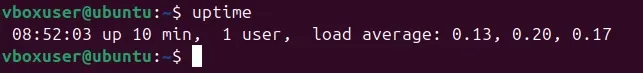
- This shows system uptime.
17. w
The w command displays information about logged-in users and their running processes. It combines user and process details.
- Shows logged-in users
- Displays running processes
- Useful for monitoring activity
**Syntax:
w
**Example:
w

- This shows active users and their processes.