When to use aov() vs. anova() in R (original) (raw)
Last Updated : 28 Jul, 2025
Analysis of Variance (ANOVA) is a statistical technique used to determine if there are significant differences between the means of three or more independent groups. In R, ANOVA can be performed using aov() or anova() functions.
aov() Function in R
The aov() function fits an ANOVA model using a formula to compare group means based on categorical variables.
**Syntax:
aov(formula, data, subset, na.action)
**Parameters:
- **formula: This parameter specifies the model to be fitted
- **data: This parameter is an optional data frame containing the variables in the model
- **subset: An optional parameter which is used to denote the subset of the observation.
- **na.action: Use to handle the missing values. It determines what to do if missing values are encountered.
**Implementation of aov() Function in R
We use the aov() function in R programming language to perform a one-way ANOVA that checks whether multiple groups have different means based on a single factor.
**1. Creating the Dataset and Applying aov() Function
We create a dataset representing weight loss from three different exercise programs and fit a one-way ANOVA model.
- **set.seed: Ensures reproducibility by fixing the random number generation.
- **data.frame: Creates a structured data frame with two variables.
- **rep: Repeats the elements of a vector for generating group labels.
- **runif: Generates random numbers from a uniform distribution.
- **aov: Fits the one-way ANOVA model.
- **summary: Displays the ANOVA table with results. R `
set.seed(0) df <- data.frame(program = rep(c("A", "B", "C"), each=30), weight_loss = c(runif(30, 0, 3), runif(30, 0, 5), runif(30, 1, 7))) fit <- aov(weight_loss ~ program, data=df) summary(fit)
`
**Output:
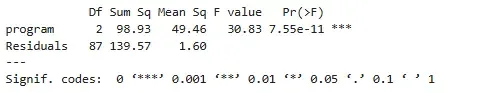
Output
- **Df: Degrees of freedom associated with each source of variation (e.g., between groups and within groups).
- **Sum Sq: Sum of Squares, measures the total variation attributed to each source.
- **Mean Sq: Mean Square, calculated by dividing the sum of squares by its corresponding degrees of freedom.
- **F value: Ratio of Mean Square of the group to the Mean Square of the residuals, used to test if group means differ significantly.
- **Pr(>F): P-value for the F-statistic, indicates whether the factor (e.g., program) has a statistically significant effect.
- **Residuals: Variation in the data that cannot be explained by the model, represents within-group variance.
- **Signif. codes: A legend showing how to interpret the p-value significance levels using stars.
anova() Function in R
The anova() function conducts an ANOVA test, which partitions the total variance observed in a dataset into different components attributed to different sources of variation. These sources can include factors, interactions between factors and residual error.
**Syntax:
anova(model)
**Parameter:
- **model: This parameter specifies the model object to be analyzed, it could be linear model as well as general model not a problem at all
**Implementation of anova() Function in R
We use the anova() function to compare a full and reduced regression model and check if adding more predictors improves model fit significantly.
**1. Creating the Dataset and Comparing Models
We simulate a dataset where the exam score is affected by the number of study hours, then compare a linear and polynomial model.
- **set.seed: Controls randomness for consistent results.
- **runif: Generates random values for independent variable.
- **lm: Fits a linear regression model.
- **poly: Generates orthogonal polynomials for polynomial regression.
- **anova: Compares nested models to test if the additional terms improve model performance. R `
set.seed(1) df <- data.frame(hours = runif(50, 5, 15), score=50) df$score = df$score + df$hours^3/150 + df$hours*runif(50, 1, 2) full <- lm(score ~ poly(hours,2), data=df) reduced <- lm(score ~ hours, data=df) anova(full, reduced)
`
**Output:
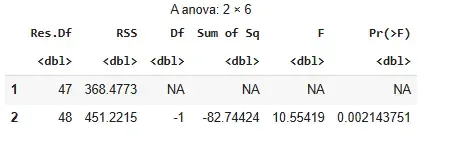
Output
- **Model 1: Uses quadratic term
poly(hours, 2). - **Model 2: Uses linear term
hours. - **Res.Df: Degrees of freedom left.
- **RSS: Error left after fitting model.
- **Df: Difference in degrees of freedom.
- **Sum of Sq: Change in error.
- **F: Test statistic for comparison.
- **Pr(>F): P-value. Lower means better fit.
- **Signif. codes: Show significance level.
**Conclusion: Quadratic model is significantly better.
Key Differences between aov() and anova()
Here's a detailed difference between aov() and anova() with respect to different parameters.
| Feature | aov() | anova() |
|---|---|---|
| Purpose | Fits ANOVA models directly to the data. | Performs ANOVA on fitted model objects. |
| Input Format of Model | Accepts formula-based models (y ~ x1 + x2). | Accepts model objects generated by functions like lm() or glm(). |
| Output Format | ANOVA table showing sources of variation and statistics. | ANOVA table comparing models or testing added terms. |
| Usage | Used for directly conducting ANOVA on data. | Used for comparing models or testing significance of predictors. |
| Flexibility | Best suited for simpler models with categorical predictors. | More flexible for comparing nested models or complex designs. |
| Example | aov(response ~ factor, data = my_data). | anova(lm_model1, lm_model2). |
When to Use aov() in R
- Use when directly testing group mean differences.
- Suitable for simple designs with categorical factors.
- Formula interface (response ~ group).
- For analyzing variance in a single model.
When to Use anova() in R
- Use when comparing multiple models (nested or non-nested).
- Suitable for checking the effect of added predictors.
- Works with models created using lm(), glm(), etc.
- Helpful in model selection or testing interactions.