The human splicing code reveals new insights into the genetic determinants of disease (original) (raw)
. Author manuscript; available in PMC: 2016 Jan 9.
Published in final edited form as: Science. 2014 Dec 18;347(6218):1254806. doi: 10.1126/science.1254806
Abstract
Introduction
Advancing whole-genome precision medicine requires understanding how gene expression is altered by genetic variants, especially those that are outside of protein-coding regions. We developed a computational technique that scores how strongly genetic variants alter RNA splicing, a critical step in gene expression whose disruption contributes to many diseases, including cancers and neurological disorders. A genome-wide analysis reveals tens of thousands of variants that alter splicing and are enriched with a wide range of known diseases. Our results provide insight into the genetic basis of spinal muscular atrophy, hereditary nonpolyposis colorectal cancer and autism spectrum disorder.
Methods
We used machine learning to derive a computational model that takes as input DNA sequences and applies general rules to predict splicing in human tissues. Given a test variant, our model computes a score that predicts how much the variant disrupts splicing. The model was derived in such a way that it can be used to study diverse diseases and disorders, and to determine the consequences of common, rare, and even spontaneous variants.
Results
Our technique is able to accurately classify disease-causing variants and provides insights into the role of aberrant splicing in disease. We scored over 650,000 DNA variants and found that disease-causing variants have higher scores than common variants and even those associated with disease in genome-wide association studies. Our model predicts substantial and unexpected aberrant splicing due to variants within introns and exons, including those far from the splice site. For example, among intronic variants that are more than 30 nucleotides away from a splice site, known disease variants alter splicing nine times more often than common variants; among missense exonic disease variants, those that least impact protein function are over five times more likely to alter splicing than other variants.
Autism has been associated with disrupted splicing in brain regions, so we used our method to score variants detected using whole genome sequencing data from individuals with and without autism. Genes with high scoring variants include many that have been previously linked with autism, as well as new genes with known neurodevelopmental phenotypes. Most of the high scoring variants are intronic and cannot be detected by exome analysis techniques.
When we score clinical variants in spinal muscular atrophy and colorectal cancer genes, up to 94% of variants found to disrupt splicing using minigene reporters are correctly classified.
Discussion
In the context of precision medicine, causal support for variants that is independent of existing studies is greatly needed. Our computational model was trained to predict splicing from DNA sequence alone, without using disease annotations or population data. Consequently, its predictions are independent of and complementary to population data, genome-wide association studies (GWAS), expression-based quantitative trait loci (QTL), and functional annotations of the genome. As such, our technique greatly expands the opportunities for understanding the genetic determinants of disease.
Regulatory _cis_-elements comprise a significant portion of the human genome (1, 2) and form the ‘regulatory code’ that directs gene expression, depending on cellular conditions. Development of computational ‘regulatory models’ that can read the code for any gene and predict relative concentrations of transcripts (3–5) raises the possibility that these models can be used to identify variants that lead to misregulated gene expression and human disease (6). Unlike many existing approaches (7–9), regulatory models do not suffer from the ascertainment biases inherent in databases of disease annotations.
A computational model of splicing
Misregulation of splicing contributes significantly to human disease (10), so we developed a computational model of splicing regulation that can be applied to any sequence containing a triplet of exons (Fig. 1a). The method extracts DNA sequence features, or _cis_-elements and, for a given cell type, uses them to predict the percent of transcripts with the central exon spliced in (PSI or Ψ), along with a Bayesian confidence estimate. To train the model, 10,689 exons that have evidence of alternative splicing were mined and 1393 sequence features were extracted from each exon and its neighboring introns and exons. RNA-seq data from the Illumina Human Body Map 2.0 project (NCBI GSE30611) was used to estimate Ψ for each exon in each of 16 human tissues, and the model was trained to predict Ψ given the tissue type and the sequence features. Unlike existing methods (3, 11, 12), our computational model was derived using human data, incorporates over 300 new sequence features, and outputs real-valued absolute Ψ values for individual tissues, rather than categorical Ψ values for tissue differences (Supporting Online Materials Sec. S1-S4).
Figure 1. The human splicing code.
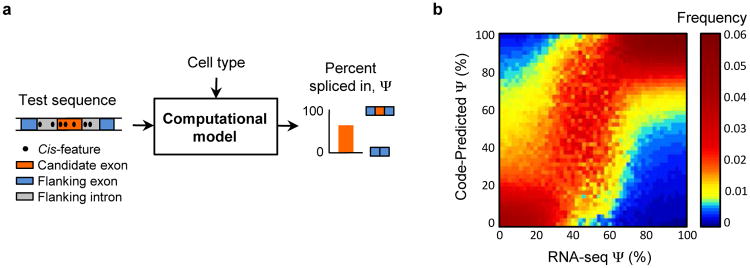
(a) For a given cell type, the computational model extracts the regulatory code from a test DNA sequence and predicts the percent of transcripts with the exon spliced in, Ψ. (b) Predictions were made for 10,689 test exons profiled in 16 tissues, exons and tissues were binned according to their RNA-seq assessed values of Ψ, and for each bin (column) the distribution of code-predicted Ψ is plotted (_n_=56,104).
We observe good agreement (_R_2=0.65) between code-predicted Ψ and RNA-seq assessed Ψ for exons that are held out during training (Fig. 1b). On the task of classifying high (Ψ≥67%) versus low (Ψ≤33%) inclusion, the area under the receiver-operator characteristic curve (AUC) is 95.5%. For quality control, we only examined exon-tissue combinations (_n_=56,784) for which the standard deviation of the RNA-seq assessed Ψ is less than 10%, and cross-validation was used to ensure that test cases were not used during training (Sec. S5.1 and Table S3). The prediction accuracy is even higher (_R_2=0.94, AUC=99.1%) for the 50% of predictions with highest confidence (_n_=28,392). The model is robust and accurate for categories of data that were not included during training, including genes with low expression, genes from excluded chromosomes, tissue differences in splicing levels, tissues from independent sources, and RT-PCR quantified splicing levels (Sec. S5.1-S5.2).
We next investigated whether our computational model accounts for the effects of known RNA-binding proteins (RBPs), which are key splicing regulators. We compared how well the calculated RBP binding affinity from Ray et. al. (13) correlates with the observed variation in splicing, and found 2080 strong correlations (P<0.01, multiple hypothesis-corrected permutation test). Then we correlated the RBP binding affinities with the residual splicing activity not captured by the code, which was obtained by subtracting the code predictions from the observed values. The number of strong correlations dropped to 60, suggesting that our computational model mostly encompasses the collective effects of known RBPs (Fig 2 and Sec. S5.3).
Figure 2. Accounting for RNA-binding proteins.

(a) The splicing code accounts for the affinities of RNA-binding proteins assayed in 98 in vitro experiments (13). (b) When code-predicted Ψ values are subtracted from RNA-seq assessed values of Ψ, their correlations with the binding affinities mostly vanish.
Our model also accounts for the effects of disruptions in _trans_-acting factors. We examined knockdown data for Muscleblind-like (MBNL) RBPs in Hela cells (14). There are 664 exons that exhibit a significant change in RNA-seq assessed Ψ upon MBNL knockdown and 26,457 exons whose levels do not change significantly upon knockdown. When we scored exons by how much the model predicts Ψ will change when the MBNL features are removed in silico, we found that MBNL-regulated exons frequently have higher scores (_P_=6.2e-57, Kolmogorov-Smirnov or KS test, 31.4%). The computational model predicts the effects of MBNL knockdown more accurately than directly examining MBNL binding sites (10.9% improvement in the AUC, _P_=1.4e-14, Bootstrap test, Sec. S5.4).
In contrast to correlation-based linear methods, where sequence features act independently, our computational model incorporates crucial context-dependent effects. When we derived tissue-specific linear models by searching over the most predictive set of sequence features, they always accounted for significantly less data variance (_R_2<0.49) than our context-dependent model (_R_2=0.65). Importantly, we found that in our model, the same feature can influence Ψ differently in different _cis_-contexts established by other sequence features and in different _trans_-contexts specified by cell type (Sec. S6.1 and Figs. S14-S15). For instance, 40 of the 100 most strongly predictive sequence features frequently switch the direction of their effect in at least one tissue, depending on _cis_-context.
We wondered whether our computational model could accurately predict differences in splicing levels between individuals using only their genotype. We analyzed genotype and RNA-seq data for lymphoblastoid cell lines from four individuals (15) and used our model to predict PSI in white blood cells, for pairs of individuals that have differing SNPs (Sec. S5.5). When we examined 99 exons that exhibit a significant difference in RNA-seq assessed PSI between pairs of individuals and whose predicted difference in PSI was above a noise threshold, we found that our technique correctly predicted the direction of change in 73% of cases (_P_=3.5e-6, Binomial test).
Genome-wide analysis of splicing misregulation and disease
To assess the implications of genetic variation on splicing regulation, we mapped 658,420 single nucleotide variations (SNVs) to exonic and intronic sequences containing the regulatory code for ∼120,000 exons in ∼16,000 genes (Sec. S7). Of these SNVs, 543,525 are single nucleotide polymorphisms (SNPs), which are common (minor allele frequency or MAF>1%) (16), whereas 114,895 have been linked to diseases and are mostly rare (MAF<1%) (17). To score the effect of every SNV on splicing regulation, we applied the regulatory model to the sequence with and without the SNV and computed the difference in predicted splicing level, ΔΨ, for each tissue (Fig. 3a). We studied the effects of SNVs using the largest value of ΔΨ across tissues, as well as a ‘regulatory score’ that aggregates the magnitude of ΔΨ across tissues (Sec. S7.1).
Figure 3. Genome-wide analysis of genetic variations.

(a) To assess the effect of a single nucleotide variation (SNV), the computational model is applied to the reference sequence and the variant. Then, the maximum difference ΔΨ across tissues is computed, along with a ‘regulatory score’ that also accounts for prediction confidence (Sec. S7). (b) The effect on Ψ of 658,420 intronic and exonic SNVs. (c) Locations and predicted ΔΨ of 81,608 disease annotated intronic SNVs and synonymous or missense exonic SNVs. In different sequence regions, the scores of disease SNVs tend to be larger than those of SNPs (Ansari-Bradley tests for equal dispersion, n includes both types).
The code provides an unprecedented view of the impact of SNVs on splicing regulation (Fig. 3b). It reveals 20,813 unique SNVs that disrupt splicing (|ΔΨ|≥5%, listed in Table S4), frequently in a way that depends on _cis_-context (Sec. S7.6 and Fig. S21). Diverse methods of validation support the functional impact of these disruptions. Intronic SNVs that are close to splice sites frequently cause misregulation, but 465 intronic SNVs that are more than 30nt from any splice site also induce substantive changes. Within exons, significant deviations are induced by 9,525 nonsense SNVs and 1273 missense SNVs, but also for 579 synonymous SNVs, a result supported by recent data showing that synonymous mutations frequently contribute to human cancer (18).
To explore the causal implications of high-scoring SNVs in the context of disease, we examined whether disease SNVs are predicted to disrupt splicing (|ΔΨ|≥5%) more frequently than common SNPs, of which a large portion are thought to be under neutral selection (19). We plotted the locations and ΔΨ for 81,608 disease SNVs located up to 100nt into exons or up to 300nt into their adjacent introns (Fig. 3c).
Our technique reveals widespread processes whereby disease SNVs cause misregulation of splicing. Databases of disease annotations were not used to train our model, so it is not susceptible to overfitting already discovered disease SNVs or inherent ascertainment biases (7–9).
We found that intronic disease SNVs that are more than 30nt from any splice site are 9.0 times more likely to disrupt splicing regulation than common SNPs in the same region (_P_=5.1e-68, two sample t-test, _n_=1639 and _n_=24,535). Within exons, synonymous disease SNVs are on average 9.3 times more likely to disrupt splicing regulation than synonymous SNPs (_P_=8.0e-116, two sample t-test, _n_=2652 and _n_=4510).
Missense SNVs have previously been examined mainly in the context of how they alter protein function (7). Our method enables the exploration of their effects on splicing regulation. We found that missense disease SNVs are not more likely to disrupt splicing than missense SNPs (_P_=0.22, two-sample t-test, _n_=58,918 and _n_=2981), which contradicts previously published evidence that they do (_P_≈0.05) (9). However, when we examined 789 and 1757 missense disease SNVs that analysis using Condel (20) indicates minimally and maximally alter protein function, we found that SNVs that minimally alter protein function are on average 5.6 times more likely to disrupt splicing regulation (_P_=4.5e-14, two-sample t-test), elucidating a ‘disease by misregulation’ mechanism (Sec. S7.5).
We found that within introns, the regulatory scores of 457 GWAS-implicated SNPs that mapped to regulatory regions (21) are quite similar to non-GWAS SNPs (_P_=0.27, KS test, _n_=262,804), whereas the scores of disease SNVs are significantly higher (P<1e-320, KS test, 71.2%, _n_=280,638). Less than 5% of GWAS SNPs are estimated to cause misregulation in a fashion similar to disease SNVs (Sec. S7.4), indicating that our method can detect disease SNVs that are not detectable by GWAS (Fig. 4a).
Figure 4. Regulatory scores of GWAS SNPs.
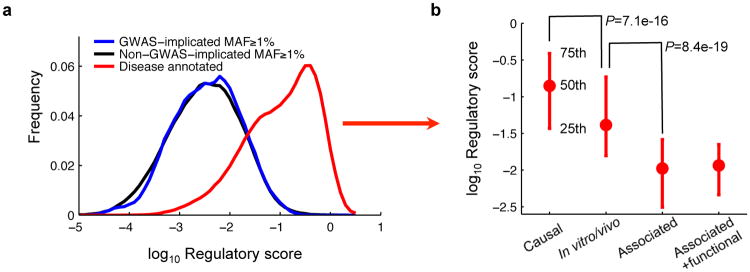
(a) Distributions of regulatory scores for GWAS-implicated SNPs (_n_=457), non-GWAS-implicated SNPs (_n_=262,347) and disease SNVs (_n_=18,291) in introns. (b) Regulatory scores of disease annotated intronic SNVs that are causal (_n_=17,631), supported by in vitro/vivo data (_n_=224), only associated (_n_=324), or associated but have additional functional evidence (_n_=112). t-test _P_-values.
In further support of the functional specificity of our approach, we found that the regulatory scores of disease SNVs with strong experimental evidence are substantially higher than those with weak or indirect evidence (Fig. 4b).
Next, we used the computational model to analyze three human diseases with different characteristics: spinal muscular atrophy (autosomal recessive single gene), nonpolyposis colorectal cancer (oligogenic) and autism spectrum disorder (multigenic).
Spinal muscular atrophy (SMA)
To explore misregulation of SMN1/2, which is associated with spinal muscular atrophy, a leading cause of infant mortality (22), we used the computational model to simulate the effects of over 700 known and novel mutations around exon 7 in SMN1/2. We first examined the regulatory consequences of four nucleotides that differ between SMN1 and SMN2, labeled C6T, G-44A, A100G, and A215G in Fig. 5a, where “-44” indicates 44nt upstream of the 3′ splice site. These substitutions are known to lead to decreased inclusion of exon 7 in SMN2 and loss of function.
Figure 5. The mutational landscape of spinal muscular atrophy.

(a) Spinal muscular atrophy arises when there is homozygous loss of SMN1 function, but functional protein can be produced by modifying the regulation of SMN2, which differs from SMN1 in four nucleotides (red lightning bolts) and exhibits decreased inclusion of exon 7. (b) Three mutations that the splicing code predicts will increase exon 7 inclusion in SMN2 (green lighting bolts) were selected from predictions for all possible single-nucleotide substitutions 150nt into the intron. These were validated using RT-PCR (c), along with the predicted differences in SMN1 and SMN2 regulation due to three individual substitutions and all four substitutions. Predictions and RT-PCR data have a Spearman correlation of 0.82 (_P_=0.017, one-sided permutation test). (d) Predicted ΔΨ for 85 individual mutations located in four regions are plotted against RT-PCR-assessed values; the Spearman correlation is 0.74 (_P_=5.7e-16, one-sided permutation test).
Our method predicts that exon 7 skipping is predominantly caused by C6T and to a much lesser degree by G-44A, while A100G and A215G are predicted to not significantly impact splicing. The prediction for C6T is consistent with previously published mutagenesis data (22). Mutagenesis data indicate that A100G enhances skipping by 36% to 63% (23) in the SMN2 context. Using a Z-score threshold of 1, our computational model also predicts a small but significant skipping effect of A100G in the SMN2 context. We used minigene reporters to test our predictions and found that in all cases, they are supported by the experimental data, including the negligible effect of A100G mutation in the SMN1 context (red, Fig. 5b). Further, our prediction for G-44A is consistent with antisense oligonucleotide experiments indicating that it overlaps with a splicing suppressor (24).
To explore mutations that may result in gain of SMN2 function, we simulated the regulatory effects of all 420 possible point mutations in 140nt of intronic sequence upstream of exon 7 (Fig. 5b). Minigene reporter data for the top three predictions confirm that none of them exhibit decreased inclusion and two of them cause increased inclusion (green, Fig. 5b). Together, the predictions for SMN1 and SMN2 mutations (Fig. 5c) have a Spearman correlation of 0.82 with the experimental data (_P_=0.017, _n_=7, one-sided permutation test).
We generated a literature-curated compendium of mutagenesis data for 85 variations located in three exonic regulatory regions previously tested using in vivo selection, plus an intronic region. When our model is used to predict ΔΨ for these cases (Fig. 5d), the direction of regulation is correct in 85% of cases and the Spearman correlation is 0.74 (_P_=5.7e-16, one-sided permutation test). We additionally used our method to simulate ΔΨ for 101 mutants selected in vivo to increase Ψ, with point mutations in the first six nucleotides in exon 7 and also in the entire exon (22). Increases in Ψ are correctly predicted in 98.7% of the 78 high confidence cases (Table S6).
Nonpolyposis colorectal cancer
Lynch syndrome, or hereditary nonpolyposis colorectal cancer accounts for ∼3% of colorectal cancer cases (25) and nearly 90% of reported variations occur in the DNA mismatch repair (MMR) genes MLH1 and MSH2 (26). Numerous studies have shown that misregulation of splicing accounts for a major portion of cases (27), but also that existing computational predictions for variations that do not directly disrupt splice sites are not correlated with experimental data (27, 28). It has been suggested that this is because existing tools do not take interactions between regulatory features into account (28).
We evaluated 977 SNVs, 156 of which are nonsense, in MLH1 and MSH2 (26) using our computational model and found that high levels of misregulation are predicted (Fig. 6a and Sec. S9, Tables S7-S8): 32.3% of SNVs exhibited a ΔΨ that was larger than that of 95% of common SNVs (_P_=4.2e-135, one-sided binomial test). To avoid bias, MLH1, MSH2, and their variants were not included during model training. Additionally, the majority of predictions are concordant with published RT-PCR data (Tables S9-S10). When predicted ΔΨ is used to classify increased skipping versus no change for SNVs where there is RT-PCR data available, AUCs of 92.4% and 93.8% (Fig. 6b) are achieved for 134 MLH1 mutants and 73 MSH2 variants (_P_=2.8e-24 and _P_=8.7e-15, one-sided permutation tests, Sec. S9).
Figure 6. The mutational landscape of nonpolyposis colorectal cancer.

(a) Predicted ΔΨ for mutations in MLH1 and MSH2 arising in patients with nonpolyposis colorectal cancer, or Lynch syndrome. Coding sequence (CDS) numbering is based on GenBank NM_000249.3 and NM_000251.2 and starts at A of the ATG translation initiation codon. (b) Validation using 134 MLH1 variations tested by RT-PCR (AUC=92.4%, _P_=2.8e-24, one-sided permutation test) and 73 MSH2 variations (AUC=93.8%, _P_=8.7e-15, one-sided permutation test).
To further test the specificity of our method, we mapped 80 common SNPs to MLH1 and MSH2 and compared their regulatory scores to those of the SNVs found in tumors. Common SNPs had significantly lower scores (_P_=8.1e-11, KS test, 40.0%, _n_=1058), indicating that our method successfully detects causal variants (Sec. S9).
Our method sheds light on unresolved hypotheses for the mechanisms of specific mutations. Three missense substitutions in the second nucleotide of codon 659 in exon 17 of MLH1 are observed in Lynch syndrome patients: c.1976G>T, c.1976G>C, and c.1976G>A Evidence indicates that these likely do not change protein function, suggesting that the mechanism is splicing misregulation (29-31). Indeed, RT-PCR data indicates that c.1976G>T and c.1976G>C induce increased exon skipping (29). However, previous computational analyses either fail to predict misregulation (30) or, because the mutations increase the strength of an exonic splicing enhancer, erroneously predict increased exon inclusion (32) (Sec. S9). We applied our computational model and found that it confidently and correctly predicts increased skipping in all three cases (Table S10), and also correctly predicts that c.1976G>C has a stronger effect than c.1976G>T. We can thus hypothesize that c.1976G>A induces aberrant splicing and renders the translated protein dysfunctional.
Autism spectrum disorder (ASD)
ASD is a neurodevelopmental condition characterized by language deficiency, restricted and repetitive interests, and challenges in social skills. It is highly heritable, but its significant clinical and genetic heterogeneity has complicated the identification of all etiologic genetic variants (33). Through the study of rare genetic variants, ∼100 genes have now been implicated in ASD (34) and these are estimated to account for ∼20% of the etiologic cause in different cohorts examined (35, 36). More recent studies using whole genome sequencing revealed higher yields of contributing mutations but these studies have only focused on exonic regions (37). Common genetic variants may also have an effect in ASD, but few studies replicate the same loci (38). Splicing misregulation as a cause of ASD is evidenced by examples of genes involved in ASD, such as Neurexins and Neuroligins, that are extensively alternatively spliced (39), and recent transcriptomic analyses showing consistent deviations in alternative splicing patterns in the cortical regions of ASD cases (40).
To identify genes with SNVs that potentially cause splicing misregulation in ASD cases, we used our regulatory model to analyze the genomes of five idiopathic ASD cases, which do not have ASD-associated cytogenetic markers such as chromosome 15q duplication (Sec. S10.1). We sequenced these genomes using brain samples from the Autism Tissue Program (41), and selected the genomes of twelve controls consisting of three subgroups of four controls each. As a control, we clustered the ASD and control genomes using genome-wide genetic similarity and verified that they cluster by ethnic group, but not by disease condition or other covariates, indicating that overall, the ASD and control SNVs are not grossly biased by non-disease effects (Sec. S10.2 and Fig. S27).
The genomes of cases and controls were scanned for SNVs (Sec. S10.1) and, to focus our analysis on rare variants, we only kept high quality homozygous and heterozygous-reference (in which one allele matches the reference allele) SNVs that do not correspond to common SNPs. This resulted in a median of ∼42,000 SNVs per subject.
We examined genes with high expression in brain tissues, which are more frequently implicated in ASD, and did not find an enrichment of SNVs in ASD cases versus controls (_P_=0.24, Fisher's exact test, Sec. S10.7). Aiming to separate causal SNVs from non-causal ones, we identified SNVs that our technique predicts will cause splicing misregulation (Fig. 7a). All variants were mapped onto the splicing code within canonical Ensembl transcripts, resulting in 15,739 SNVs, whose code-predicted ΔΨs were then computed (Tables S13.1-S13.4). We identified genes with misregulated splicing in cases and also in controls by applying a threshold to ΔΨ equal to the 2nd and also the 3rd percentile of ΔΨ for common SNPs (Fig. 7b and Sec. S10.4), and genes misregulated in both cases and controls were removed from further analysis.
Figure 7. Splicing misregulation in individuals with autism.
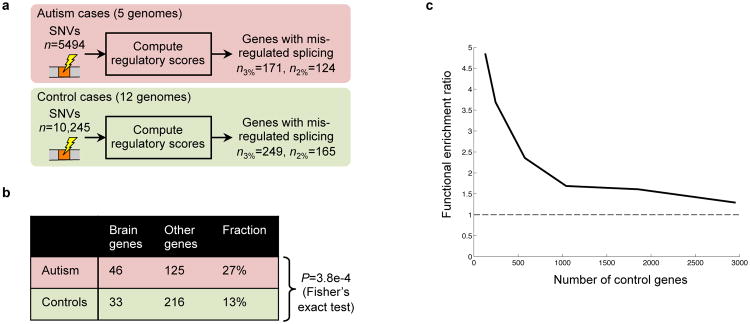
(a) Genes containing at least one SNV that the computational model predicts will cause decreased exon inclusion were identified in five autism spectrum disorder (ASD) cases and twelve controls, by thresholding ΔΨ using either the 2nd or 3rd percentile of ΔΨ for SNPs. (b) Genes that our method predicts are misregulated in ASD cases more frequently have high expression in brain tissues than in control cases. (c) The effect of varying the threshold on ΔΨ, and thus the number of case and control genes, on the odds ratio for the enrichment of central nervous system development genes (GO:0007417); in all cases, P<0.05.
Among genes that our technique predicts are misregulated in ASD cases (_n_=171), 27% have high expression in brain, whereas for controls (_n_=249), only 13% have high expression in brain (_P_=3.8e-4, Fisher's exact test). When we examined genes with low or no expression in brain tissues, we did not observe significant differences (Sec. S10.7). Further, when we make the threshold used to identify misregulated genes more stringent, we see that enrichment of ASD-related functions is amplified (Fig. 7c). These results open the door to discovering new genetic determinants of ASD, and also suggest that more generally, our splicing model can be used to sift through variants to support precision medicine and whole genome variant studies.
We tested Gene Ontology annotation and pathway based gene-sets for enrichment in misregulated genes; to account for biases such as gene length, we tested the gene enrichment in ASD genomes compared to control genomes. Interestingly, we found categories related to synaptic transmission, neuron projection and growth (Fig 8). Gene permutation analysis shows that enrichment in neurodevelopmental gene sets is significant (empirical FDR < 4%). In addition, repeating the analysis for a subset of control genomes versus another subset of control genomes did not produce any significant results, and top-ranking gene sets were not neurodevelopmental.
Figure 8. Misregulated genes and functional categories enriched in individuals with autism.

Gene Ontology and pathway categories that are enriched (_P_≤0.01, Fisher's exact test) in misregulated genes from ASD cases compared to controls were identified (_n_=18), along with the corresponding set of genes from ASD cases. Each gene set is shown as a red or pink dot, depending on whether the 2nd or 3rd percentile threshold was used for detection (Fig. 7a), and size is proportional to the number of genes in the set. Edge thickness indicates the fraction of genes shared between two sets. Groups of functionally related gene sets are highlighted by blond discs. The names of novel genes that are not already implicated in ASD and have neural-related phenotypes are printed in black, the names of genes already implicated in ASD are printed in red, and otherwise gene names are printed in pale blue. If a gene is in multiple categories, the number of categories is written in superscript and genes in which a stop codon is introduced by the SNV are labeled ‘s’.
We found 39 genes with predicted splicing alterations that are associated with at least one enriched function and we additionally prioritized 19 of these genes as more compelling ASD disease candidates, because they are known to have neurological, neurobehavioral or neurodevelopmental phenotypes in human (HPO and OMIM) or mouse (MGI/MPO) (Table S16). The analysis reveals interesting candidates and only CTNND2 and PTEN have been previously implicated or suggested to play a role in ASD (34, 42). Our study suggests new candidate ASD genes, including ALDH5A1, GLI2, GRIN1, KCNH3, LAMA2, and NISCH, in addition to other possibilities. Our results are robust to choices made in the analysis (Sec. S10.5) and can be combined with other approaches, e.g. (43), to develop diagnostic techniques.
Discussion
Our results from profiling the genome-wide effects of over 650,000 SNVs shed light on how genetic variation impacts splicing. Further, our in-depth results from the analysis of thousands of variations in diverse disorders, including spinal muscular atrophy, nonpolyposis colorectal cancer and autism, exemplify the wide range of applicability of our technique and provide insights into the genetic determinants of these diseases.
In the context of precision medicine, the importance of providing causal evidence for putative variants with the goal of avoiding the effects of confounding factors, such as population stratification, has recently been underscored (44, 45). The ability of our computational technique (available at http://tools.genes.toronto.edu, also see Sec. S11) to provide regulatory evidence for a variant's disruptiveness is supported by accurate predictions for test sequences that were not used during training, discrimination of disease variants even though the model was not trained using disease labels, and strong correlation between code-predicted changes in splicing induced by mutations and experimental data using minigene reporters.
Our approach contrasts with techniques that use functional annotations of the genome (2, 8, 46), tools that are trained using existing disease annotations and thus suffer from overfitting to known mutations or severe selection bias (7–9, 47, 48); genome-wide association studies (GWAS) (49, 50); and expression-based quantitative trait loci (QTL) (15, 51). To compare our method with using functional genome annotations, we removed missense exonic SNVs that may affect phenotype without changing splicing regulation, yielding 26,403 SNVs that map to canonical Ensembl transcripts. At a false positive rate of 0.1%, we found that scoring SNVs by their overlap with functional annotations detects 1.4% of disease variants, whereas our method is 25 times more sensitive and detects 35.9% of disease variants (Sec. S7.2).
Compared to state of the art methods that examine perturbations of motifs and genome annotations, but that do not account for changes in gene regulation (47, 48), our method is nearly ten times more sensitive in each of several sequence regions (Fig. S18).
While our technique does not directly detect variants associated with a phenotype of interest, when it is combined with phenotype-matched genotype data, such as those generated by whole genome sequencing, it can detect variants relevant to phenotype, as demonstrated by our autism analysis.
In contrast to GWAS (49), splicing QTL analysis (51), and other methods that use allele frequencies within populations to score variants (46), our technique does not directly depend on allele frequencies, but instead detects variants that are predicted to cause changes in regulation. Consequently, it can be applied to rare and even spontaneous variants. Also, our approach can be combined with population-based methods so as to amplify their specificity and identify causal variants in the context of specific diseases, either by providing more refined scores or by scoring variants in the same linkage disequilibrium block as a GWAS- or QTL-identified non-causal SNP. When we evaluated 453 splicing QTLs that were identified using blood samples and the genotypes of 922 individuals (51), we found that a subset of splicing QTLs had high regulatory scores, as computed using our method, compared to those of common SNPs in general (_P_=4.2e-10, KS test, 15.4%).
One concern is that our method successfully detects rare disease variants because they are rare, rather than because they cause disease. However, our method was derived without using disease mutation data, so it does not directly depend on allele frequency. Indeed, when we separately analyzed rare variants (0.1%<MAF<1%), moderately common variants (1%<MAF<5%), and disease variants (annotated in HGMD), we found that the disease variants have significantly different regulatory scores than the rare and common variants, but the distribution of regulatory scores is indistinguishable for rare and common variants. These results indicate that the scores generated by our method for rare disease variants are high because of their disease effect, not simply because they are rare. (See Sec. S7.7 for details.)
Potential sources of prediction error include unaccounted for RNA features, inaccuracies in computed features, imperfect modeling of splicing levels, and limitations due to a focus on cassette splicing. Even so, the method described here performs extraordinarily well, as assessed both by validation of splicing prediction using several diverse sources of data, and by its ability to detect disease mutations.
We anticipate that it will be important to seek regulatory models that encompass other major steps in gene regulation, including chromatin dynamics, transcription, polyadenylation, mRNA turnover, protein synthesis, and protein stabilization. These processes influence transcript levels in a highly integrated manner within the cell, so modeling them jointly should lead to more accurate predictions. Moreover, evidence suggests that DNA elements previously thought to be pertinent to only one regulatory process may in fact span several steps in the regulatory chain. Examples include nucleosome positioning, epigenetic modifications, and chromatin interactions (52).
Material and Methods
Details of all datasets, learning algorithms, statistical analyses, experimental validation, and web tool implementation are provided in the supplementary online material. Here we provide a brief summary. The human splicing code was assembled using on 1393 carefully designed sequence features extracted from each of the 10,689 alternatively spliced exons and their corresponding PSI values profiled in 16 normal tissues from human BodyMap 2.0 (NCBI GSE30611) RNA-seq data. The features of an exon were extracted from its proximal genomic sequences, including exon/intron lengths, splice site signals, counts of splicing factor motifs, 1- to 3-mer frequencies, retrovirus repeats, nucleosome positioning, RNA secondary structures, etc. The computational model was learned using a Bayesian machine learning algorithm, with extreme care exercised to prevent overfitting. Since the model was built using the reference genome only, its performance was first validated using held out data, including additional RNA-seq (53), RT-PCR, RBP binding (13), and MBNL knockdown (14) datasets. The model was further evaluated using genome-wide SNVs, including common SNPs in dbSNP135 (16), point mutations in HGMD (17), and rare variants from ANNOVAR (54). Finally, the splicing model was applied in three disease studies: spinal muscular atrophy (SMA), hereditary nonpolyposis colorectal cancer, and autism spectrum disorder (ASD). A large number of literature-curated data from splicing assays were used to validate our predictions for SMA and nonpolyposis colorectal cancer mutations, with additional mutagenesis experiments carried out for SMA. When applying our computational model to ASD, we performed whole genome sequencing on five ASD and four control subjects (deposited at the European Genome-phenome Archive, http://www.ebi.ac.uk/ega/, with accession number EGAS00001000928). To make our splicing code publically available, we created a mutation analysis web tool (http://tools.genes.toronto.edu/), programed in Python under the Flask web framework (http://flask.pocoo.org/) while also making use of MongoDB (http://www.mongodb.org/), and Celery distributed task queue (http://celery.readthedocs.org/).
Supplementary Material
"Supplemental Methods"
"Supplementary Tables"
Acknowledgments
BJF designed the study and wrote the manuscript, with input from BJB, SWS, NJ, YB, QM and other co-authors. HYX trained the models. HYX, BJF, NJ and LJL developed the bootstrap method for quantifying Ψ. LJL mined exons, mapped reads and designed additional features, extending the original feature set developed by YB, BJF and BJB. HYX, BJF, HSN, QM and TRH analyzed RNAcompete data. BJF, HYX, LJL and BA performed the genome-wide SNV analysis. LJL, YH, BJF and ARK tested predictions for SMN1/2. BA and BJF tested predictions for MLH1/MSH2. BA, DM, RY, BJF and SWS analyzed ASD genomes. SG conducted wild-type RT-PCR assays. HB developed the web tool and feature visualization, with input from BJF, HYX, BA and LJL. We thank the Center of Applied Genomics at the Toronto Hospital for Sick Children for providing HGMD annotations, Gary Schroth at Illumina for providing the BodyMap RNA-seq data, and Mike Brudno, Orion Buske, Chris Smith and Tim Sterne-Weiler for comments on the web tool and relevant literature. This work was supported by CIHR, NSERC, John C. Polanyi, the University of Toronto McLaughlin Centre and Ontario Genomics Institute (OGI) funding to BJF; CIHR and McLaughlin funding to BJB; McLaughlin, Genome Canada, OGI and Autism Speaks funding to SWS, NIH grant R37-GM42699a to ARK; CIHR funding to QM; a CIHR Banting Fellowship to HSN; and an NSERC Alexander Graham Bell Scholarship to SG. SWS holds the GlaxoSmithline-CIHR Chair in Genome Sciences. BJB holds the Banbury Chair of Medical Research at the University of Toronto. BJF, SWS and TRH are Fellows of the Canadian Institute for Advanced Research. BJF holds the Canada Research Chair in Biological Computation.
References
- 1.Lindblad-Toh K, et al. Nature. 2011;478:476–82. doi: 10.1038/nature10530. [DOI] [PMC free article] [PubMed] [Google Scholar]
- 2.Bernstein BE, et al. Nature. 2012;489:57–74. [Google Scholar]
- 3.Barash Y, et al. Nature. 2010;465:53–9. doi: 10.1038/nature09000. [DOI] [PubMed] [Google Scholar]
- 4.Zhang C, et al. Science. 2010;329:439–43. doi: 10.1126/science.1191150. [DOI] [PMC free article] [PubMed] [Google Scholar]
- 5.Barbosa-Morais NL, et al. Science. 2012;338:1587–1593. doi: 10.1126/science.1230612. [DOI] [PubMed] [Google Scholar]
- 6.Segal E, Widom J. Nat Rev Genet. 2009;10:443–56. doi: 10.1038/nrg2591. [DOI] [PMC free article] [PubMed] [Google Scholar]
- 7.Gnad F, Baucom A, Mukhyala K, Manning G, Zhang Z. BMC Genomics. 2013;14 Suppl 3:S7. doi: 10.1186/1471-2164-14-S3-S7. [DOI] [PMC free article] [PubMed] [Google Scholar]
- 8.Kircher M, et al. Nat Genet. 2014;46:310–315. doi: 10.1038/ng.2892. [DOI] [PMC free article] [PubMed] [Google Scholar]
- 9.Mort M, et al. Genome Biol. 2014;15:R19. doi: 10.1186/gb-2014-15-1-r19. [DOI] [PMC free article] [PubMed] [Google Scholar]
- 10.Sterne-Weiler T, Sanford JR. Genome Biol. 2014;15:201. doi: 10.1186/gb4150. [DOI] [PMC free article] [PubMed] [Google Scholar]
- 11.Xiong HY, Barash Y, Frey BJ. Bioinformatics. 2011;27:2554–62. doi: 10.1093/bioinformatics/btr444. [DOI] [PubMed] [Google Scholar]
- 12.Barash Y, et al. Genome Biol. 2013;14:R114. doi: 10.1186/gb-2013-14-10-r114. [DOI] [PMC free article] [PubMed] [Google Scholar]
- 13.Ray D, et al. Nature. 2013;499:172–7. doi: 10.1038/nature12311. [DOI] [PMC free article] [PubMed] [Google Scholar]
- 14.Han H, et al. Nature. 2013;498:241–5. doi: 10.1038/nature12270. [DOI] [PMC free article] [PubMed] [Google Scholar]
- 15.Lappalainen T, et al. Nature. 2013;501:506–11. doi: 10.1038/nature12531. [DOI] [PMC free article] [PubMed] [Google Scholar]
- 16.Sherry ST, et al. Nucleic Acids Res. 2001;29:308–11. doi: 10.1093/nar/29.1.308. [DOI] [PMC free article] [PubMed] [Google Scholar]
- 17.Stenson PD, et al. Genome Med. 2009;1:13. doi: 10.1186/gm13. [DOI] [PMC free article] [PubMed] [Google Scholar]
- 18.Supek F, Miñana B, Valcárcel J, Gabaldón T, Lehner B. Cell. 2014;156:1324–35. doi: 10.1016/j.cell.2014.01.051. [DOI] [PubMed] [Google Scholar]
- 19.Kimura M. The Neutral Theory of Molecular Evolution. 1983 doi: 10.1038/scientificamerican1179-98. [DOI] [PubMed] [Google Scholar]
- 20.González-Pérez A, López-Bigas N. Am J Hum Genet. 2011;88:440–9. doi: 10.1016/j.ajhg.2011.03.004. [DOI] [PMC free article] [PubMed] [Google Scholar]
- 21.Hindorff LA, et al. PNAS. 2009;106:9362–7. doi: 10.1073/pnas.0903103106. [DOI] [PMC free article] [PubMed] [Google Scholar]
- 22.Singh RN. RNA Biol. 2007;4:7–10. doi: 10.4161/rna.4.1.4535. [DOI] [PubMed] [Google Scholar]
- 23.Kashima T, Rao N, Manley JL. PNAS. 2007;104:3426–31. doi: 10.1073/pnas.0700343104. [DOI] [PMC free article] [PubMed] [Google Scholar]
- 24.Hua Y, Vickers TA, Okunola HL, Bennett CF, Krainer AR. Am J Hum Genet. 2008;82:834–848. doi: 10.1016/j.ajhg.2008.01.014. [DOI] [PMC free article] [PubMed] [Google Scholar]
- 25.Barnetson RA, et al. Hum Mutat. 2008;29:367–74. doi: 10.1002/humu.20635. [DOI] [PubMed] [Google Scholar]
- 26.Peltomäki P, Vasen H. Dis Markers. 2004;20:269–276. doi: 10.1155/2004/305058. [DOI] [PMC free article] [PubMed] [Google Scholar]
- 27.Arnold S, et al. Hum Mutat. 2009;30:757–70. doi: 10.1002/humu.20936. [DOI] [PMC free article] [PubMed] [Google Scholar]
- 28.Betz B, et al. J Cancer Res Clin Oncol. 2010;136:123–34. doi: 10.1007/s00432-009-0643-z. [DOI] [PMC free article] [PubMed] [Google Scholar]
- 29.Nyström-Lahti M, et al. Genes Chromosom Cancer. 1999;26:372–375. doi: 10.1002/(sici)1098-2264(199912)26:4<372::aid-gcc12>3.0.co;2-v. [DOI] [PubMed] [Google Scholar]
- 30.Lastella P, Surdo NC, Resta N, Guanti G, Stella A. BMC Genomics. 2006;7:243. doi: 10.1186/1471-2164-7-243. [DOI] [PMC free article] [PubMed] [Google Scholar]
- 31.Kosinski J, Hinrichsen I, Bujnicki JM, Friedhoff P, Plotz G. Hum Mutat. 2010;31:975–82. doi: 10.1002/humu.21301. [DOI] [PMC free article] [PubMed] [Google Scholar]
- 32.Smith PJ, et al. Hum Mol Genet. 2006;15:2490–508. doi: 10.1093/hmg/ddl171. [DOI] [PubMed] [Google Scholar]
- 33.Buxbaum JD, et al. Neuron. 2012;76:1052–6. doi: 10.1016/j.neuron.2012.12.008. [DOI] [PMC free article] [PubMed] [Google Scholar]
- 34.Betancur C. Brain Res. 2011;1380:42–77. doi: 10.1016/j.brainres.2010.11.078. [DOI] [PubMed] [Google Scholar]
- 35.Devlin B, Scherer SW. Curr Opin Genet Dev. 2012;22:229–37. doi: 10.1016/j.gde.2012.03.002. [DOI] [PubMed] [Google Scholar]
- 36.Iossifov I, et al. Neuron. 2012;74:285–99. doi: 10.1016/j.neuron.2012.04.009. [DOI] [PMC free article] [PubMed] [Google Scholar]
- 37.Jiang Y, et al. Am J Hum Genet. 2013;93:249–63. doi: 10.1016/j.ajhg.2013.06.012. [DOI] [PMC free article] [PubMed] [Google Scholar]
- 38.Anney R, et al. Hum Mol Genet. 2010;19:4072–82. doi: 10.1093/hmg/ddq307. [DOI] [PMC free article] [PubMed] [Google Scholar]
- 39.Südhof TC. Nature. 2008;455:903–11. doi: 10.1038/nature07456. [DOI] [PMC free article] [PubMed] [Google Scholar]
- 40.Voineagu I, et al. Nature. 2011;474:380–4. doi: 10.1038/nature10110. [DOI] [PMC free article] [PubMed] [Google Scholar]
- 41.Wintle RF, et al. Autism Res. 2011;4:89–97. doi: 10.1002/aur.173. [DOI] [PMC free article] [PubMed] [Google Scholar]
- 42.Pinto D, et al. Nature. 2010;466:368–72. doi: 10.1038/nature09146. [DOI] [PMC free article] [PubMed] [Google Scholar]
- 43.Uddin M, et al. Nat Genet. 2014;46:742–7. doi: 10.1038/ng.2980. [DOI] [PubMed] [Google Scholar]
- 44.Skafidas E, et al. Mol Psychiatry. 2014;19:504–10. doi: 10.1038/mp.2012.126. [DOI] [PMC free article] [PubMed] [Google Scholar]
- 45.Robinson EB, et al. Mol Psychiatry. 2014;19:859–861. doi: 10.1038/mp.2013.125. [DOI] [PMC free article] [PubMed] [Google Scholar]
- 46.Khurana E, et al. Science. 2013;342:1235587. doi: 10.1126/science.1235587. [DOI] [PMC free article] [PubMed] [Google Scholar]
- 47.Lim KH, Ferraris L, Filloux ME, Raphael BJ, Fairbrother WG. PNAS. 2011;108:11093–8. doi: 10.1073/pnas.1101135108. [DOI] [PMC free article] [PubMed] [Google Scholar]
- 48.Woolfe A, Mullikin JC, Elnitski L. Genome Biol. 2010;11:R20. doi: 10.1186/gb-2010-11-2-r20. [DOI] [PMC free article] [PubMed] [Google Scholar]
- 49.Stranger BE, et al. Science. 2007;315:848–53. doi: 10.1126/science.1136678. [DOI] [PMC free article] [PubMed] [Google Scholar]
- 50.Tennessen Ja, et al. Science. 2012;337:64–9. doi: 10.1126/science.1219240. [DOI] [PMC free article] [PubMed] [Google Scholar]
- 51.Battle A, et al. Genome Res. 2014;24:14–24. doi: 10.1101/gr.155192.113. [DOI] [PMC free article] [PubMed] [Google Scholar]
- 52.Braunschweig U, Gueroussov S, Plocik AM, Graveley BR, Blencowe BJ. Cell. 2013;152:1252–69. doi: 10.1016/j.cell.2013.02.034. [DOI] [PMC free article] [PubMed] [Google Scholar]
- 53.Brawand D, et al. Nature. 2011;478:343–8. doi: 10.1038/nature10532. [DOI] [PubMed] [Google Scholar]
- 54.Wang K, Li M, Hakonarson H. Nucleic Acids Res. 2010;38:e164. doi: 10.1093/nar/gkq603. [DOI] [PMC free article] [PubMed] [Google Scholar]
Associated Data
This section collects any data citations, data availability statements, or supplementary materials included in this article.
Supplementary Materials
"Supplemental Methods"
"Supplementary Tables"